Abstract
Fluorescence polarization (FP) has become a powerful technique to quantitatively analyze the binding of a small soluble fluorescence-labeled probe to a larger soluble protein and its displacement by other molecules. Here, we describe a detailed protocol to identify small molecules capable of targeting p53-MDM2/ MDMX interactions using a fluorescence polarization assay with Rhodamine-labeled p53 peptides.
Keywords: Fluorescence polarization, p53, MDM2, MDMX, Small molecules
1. Introduction
MDM2 (HDM2 in human) and MDMX (also known as MDM4) are two chief monitor proteins of the tumor suppressor p53. In a feedback fashion, they directly bind to p53, inhibit its transcriptional activity, and mediate its ubiquitination and degradation. The interactions between p53 and MDM2 or MDMX are mediated mainly by three key residues (Phe19, Trp23, and Leu26) of p53 and the hydrophobic pocket in the N-terminal domain of MDM2 or of MDMX (1–3). Despite the similarity in the p53 recognition surface of MDM2 and MDMX, a number of MDM2 inhibitors have been reported to show significantly less affinity to MDMX (1, 4, 5). Given that both MDM2 and MDMX are over-expressed in many cancers and function as the major suppressors of p53 in cells, working independently or synergistically, the identification and development of p53-MDM2/MDMX dual inhibitors are appealing and highly desirable, but still remain challenging (2, 6, 7).
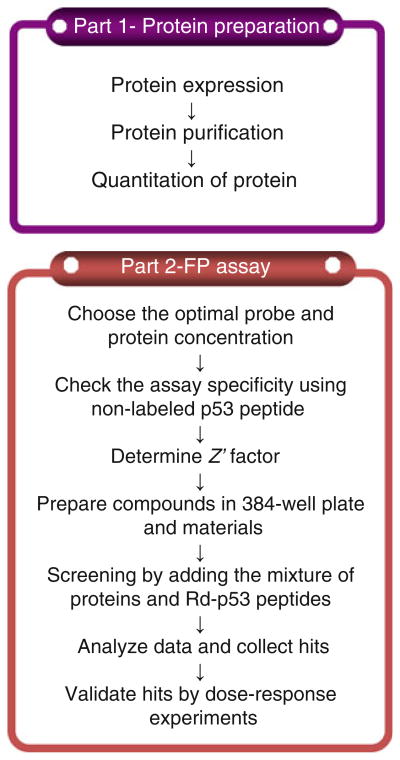
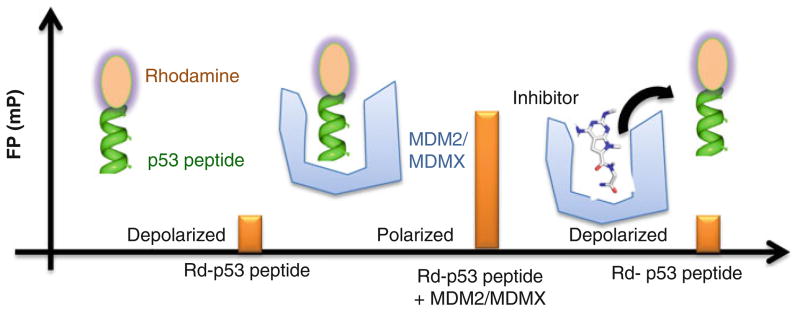
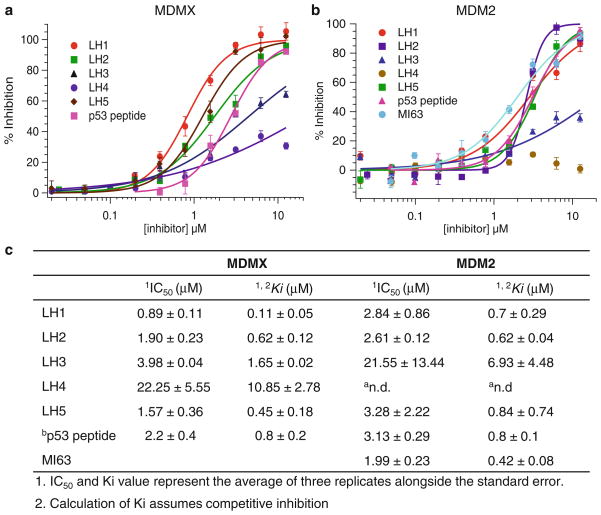
Here, we describe a step-by-step fluorescence polarization (FP) protocol to identify MDM2/MDMX dual inhibitors based on our own experience. This protocol is divided into two parts: (1) preparation of MDM2 or MDMX proteins and (2) compound identification including screening and hit validation by fluorescence polarization (FP) and data analysis (see Fig. 1). The first part includes the expression of MDM2 or MDMX proteins in bacteria, protein purification, and quantification. The second part deals with the screening of a library consisting of 900 highly soluble α-helix mimetic small molecules (7). The FP assay is based on the high affinity binding of the N-terminal domain of MDM2 or MDMX to a specific 15-amino acid sequence derived from p53 (see Fig. 2). After absorbing polarized light, unbound Rhodamine-labeled p53 peptides of relatively small molecular weight emit light in all directions due to the fast tumbling rate, resulting in low polarization. Upon binding to the target protein MDM2 or MDMX, the labeled peptides rotate slower due to the larger combined molecular size of the complex. As a consequence, they emit radiation in the same direction as that of the incident light, exhibiting higher polarization. If compounds displace the Rhodamine-labeled p53 peptides from MDM2 or MDMX, the disruption of the binding between the peptides and the protein can be identified by decreased polarization. The specificity of this FP assay is confirmed by the competitive displacement of unlabeled p53 peptides and the specific MDM2 inhibitor MI-63 (4). The primary screen of the 900-compound library at 40 μM yielded seven putative hits that inhibited the p53-MDM2/MDMX interaction by at least 50%. By subsequent dose-dependent validation experiments with these compounds, we verified the top three hits, denoted as LH1, 2, and 5, which acted as dual inhibitors of MDMX- and MDM2-p53 interactions at Ki values lower than 3 μM (see Fig. 3). Two of them were evaluated for their ability to trigger apoptosis through a p53-dependent pathway by binding to MDMX and MDM2 and inhibiting their function toward p53 (7). Thus, this FP assay can be used for identification of small molecule inhibitors that disrupt the MDM2-p53 or MDMX-p53 interactions in vitro.
Fig. 1.
Experimental workflow chart. The protocol is divided into two parts: (1) protein preparation and (2) identifi cation of p53-MDM2/MDMX inhibitors by fl uorescence polarization.
Fig. 2.
A schematic representation of FP assays used to monitor the interactions between Rd-p53 peptide (SQETFSDLWKLLPEN-NH-Rhodamine) and MDMX or MDM2 protein and displacement of the peptide by small molecules.
Fig. 3.
Validation of hits obtained from the primary screen for the competition of Rd-p53 binding to human MDMX (amino acids 1–137) (a ) and human MDM2 (amino acids 1–118) (b) by fluorescence polarization. (c) IC50 and Ki values of inhibitors. aNot determined. bUnlabeled 15-mer p53 peptide (SQETFSDLWKLLPEN).
2. Materials
2.1. Reagents
1 M Dithiothreitol (DTT): Dissolve 1.54 g in 10 ml water.
Protease inhibitor cocktail: leupeptin 1.42 mg, pepstain A 6.85 mg, Benzamidine 1.65 g, and PMSF 0.85 g. Dissolve in 50 ml 100% EtOH and stored in −20°C.
1 M Isopropyl-β-D-thiogalactoside, dioxin-free (IPTG): dissolve 2.38 g in 10 ml water.
BSA (Bovine serum albumin, EMD Chemicals, cat. no. 2930).
PreScission protease (GE Healthcare, cat. no. 27-0843-01).
LB medium: dissolve 25 g of LB broth Miller in ~800 ml distilled water (dH2O). Add dH2O to a final volume of 1 L. Autoclave using liquid cycle. Tighten lid and store at room temperature.
LB agar plates: add 15 g of LB agar Miller and 25 g of LB broth Miller to 1 L of dH2O. Cover flasks tightly with foil. Autoclave them using the liquid cycle, then allow to cool to 50°C. Add 1 ml of a 100 mg/ml ampicillin stock to obtain a final concentration of 100 μg/ml. Pour a thin layer of LB agar into each petri dish (10-cm diameter) and cover with lid immediately. Let plates cool for a few hours or overnight. Store the plates in a plastic bag at 4°C.
PBS: dissolve 8 g NaCl, 0.2 g KCl, 1.44 g Na2PO4·2H2O, and 0.24 g KH2PO4 in 1 L of deionized H2O, adjust pH 7.4, and then store at 4°C.
Glutathione agarose beads (Thermo Scientific Pierce, cat. no. 15160).
Millipore-Amicon ultra-15 device.
Poly-Prep Chromatography Columns (Bio-Rad Laboratories, cat. no. 731-1550).
5× FP Assay Buffer: 5× PBS, 0.025% Tween-20, pH 7.5, 0.5% BSA.
384-well black plates (cat. no. 262260, Nalge Nunc International).
pGEX- 6P-1 plasmid coding p53-binding domain of human MDMX (a.a. 1–137) or human MDM2 (a.a. 1–118) was developed in the Lu laboratory (Indiana University School of Medicine, IN).
p53 peptides (SQETFSDLWKLLPEN-NH2) and N-terminally labeled Rhodamine p53 peptides (SQETFSDLWKLLPEN-NH-Rhodamine) were synthesized by Antagene Inc.
2.2. Equipment
Sonicator (e.g., Fisher Scientific Model 100).
Mini-PROTEAN Tetra Cell (Bio-Rad, cat. no. 165–8000).
Incubator shaker (e.g., Excella E25, New Brunswick Scientific).
End-over-end rotation apparatus (e.g., Rotospin test tube rotator, Tarsons).
Nanodrop 2000c spectrophotometer (or other standard protein assay kit).
Benchtop centrifuge for 96-well plates (e.g., ALC PK120 plate centrifuge, DJB Labcare).
Plate reader capable of FP measurements (e.g., SpectraMax M5e (Molecular Devices)).
3. Methods
3.1. Protein Preparations
3.1.1. Expression and Purification of MDMX (a.a. 1–137) and MDM2 (a.a. 1–118) Proteins
Transform pGEX-6P1 plasmid coding p53-binding domain of human MDMX (a.a. 1–137) or human MDM2 (a.a. 1–118) into competent E. coli BL21 (DE3) cells by a standard heat-shock method (8).
Prepare LB agar plates containing 100 μg/ml ampicillin.
Plate the cells on the agar plates using a sterile loop and incubate overnight at 37°C.
Prepare liquid LB medium with 100 μg/ml ampicillin.
Using a sterile pipette tip, touch a single colony of bacteria from your agar plate. Inoculate the liquid LB by swirling the tip in it.
Incubate the culture in an orbital shaker at 250 rpm overnight (~12 h) at 37°C.
Prepare 1 L LB medium with 100 μg/ml ampicillin.
Inoculate the 1 L LB medium with 5 ml of the overnight culture.
Grow the cultures in an orbital shaker, at 200 rpm and at 37°C reaches about 0.6–0.8 (after ~4 h) (see Note 1). until the OD600
Add 1 ml of 0.5 M IPTG (final concentration, 0.5 mM) to induce the cells.
Incubate induced cultures at 28°C with orbital shaking at 200 rpm (see Note 1).
At 4–5 h after induction, centrifuge the cells at 6,000 × g for 5 min at 4°C (see Note 2).
Discard the supernatants, wash the pellets with 10 ml cold PBS by gently pipetting the cells, and then spin down at 6,000 × g for 5 min.
Re-suspend the pellets in 50 ml PBS lysis buffer (freshly add 50 μl protease inhibitor cocktail solution and 200 μl of 1 M DTT (final concentration, ~4 mM) to 50 ml of ice-cold PBS, pH 7.5, 10% glycerol) (see Note 3). Vortex until the pellets are fully re-suspended.
Incubate the suspension with lysozyme (50 μL of a solution of 100 mg/ml; final concentration, 100 μg/ml) on ice for 30 min.
Sonicate lysates on ice for six-ten 20s bursts at 300W with a 20s cooling period between each burst and centrifuge at 10,000×g for 30 min at 4°C.
Collect the supernatants. Take 10–100 μl of the supernatants to quantify protein expression by electrophoresis and brilliant coomassie blue staining.
Transfer 4 ml 50% slurry of glutathione agarose beads to a 50-ml tube. Sediment the slurry by centrifugation at 400 × g for 5 min. Aspirate the supernatants carefully and discard them.
Wash glutathione agarose beads by adding 20 ml of cold PBS and separate the beads by centrifugation at 400 × g for 5 min. Aspirate the supernatants carefully and discard. Repeat three times.
Add 50 ml of the cleared lysates to the beads and mix by gentle inversion.
Incubate the mixture for 2–3 h at 4°C with gentle end-over-end rotation.
Pour the mixture into an empty Poly-Prep Chromatography column. Tap the column and allow the beads to settle.
Open the column outlet and collect the flow-through until the column completely drains. Take an aliquot (~20 μl) of the flow-through for analysis of nonbound proteins by electrophoresis and coomassie staining.
Close the column outlet and add 10 ml of cold PBS lysis buffer to the column. Incubate for 10 min with gentle end-over-end rotation (see Note 4). Open the column outlet and allow the column to drain. Repeat at least five times (see Note 5). Take some beads (~20 μl) for analysis by electrophoresis and coo-massie staining (see Fig. 4).
Prepare the PreScission protease mix by adding 200 μl (400 U) of the PreScission protease to 5 ml of cold PBS lysis buffer.
Load the PreScission protease mixture onto the column and incubate with gentle end-over-end rotation for ~12 h at 4°C (see Note 6).
Open the column outlet and collect eluates, which contain non-GST-tagged of purified MDM2 or MDMX proteins. The PreScission enzyme contains a GST tag, so it remains bound to the column.
Add 4 ml PBS lysis buffer to the column and rotate for 10 min at 4°C. Collect the eluates, which also contain purified MDM2 or MDMX proteins. Repeat five times. Save aliquots (~10 μl) of each elute for analysis by the Bradford assay, with subsequent electrophoresis analysis with coomassie staining (see Fig. 4).
Collect the elution and transfer it to a pre-cooled 50 ml ultrafiltration tube (Millipore-Amicon ultra), centrifuge at 2,000×g until the protein concentration goes to 2 mg/ml (see Note 7). Save a small aliquot (~10 μl) for protein quantification by the Bradford assay, electrophoresis, and coomassie staining using BSA as a standard.
Aliquot purified proteins into small volumes (~100 μl) and freeze them in liquid nitrogen or store them in a −80°C freezer. The purified proteins are stable at −80°C for several months.
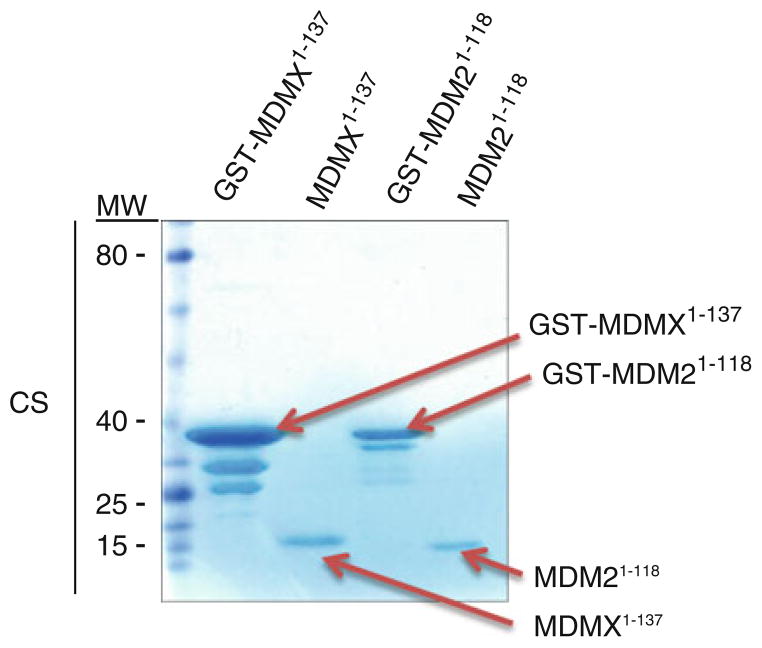
Fig. 4.
Coomassie-stained gel showing the purified recombinant MDM21–118 and MDMX1–137 with or without GST tag produced in E. coli BL21-(DE3).
3.1.2. Quantification of the Concentration of MDM2 and MDMX Proteins
Determine the total protein concentration using Nanodrop 2000c spectrophotometer (or other standard protein assays), according to the manufacturer’s instructions.
Load 1–10 μg per lane (at least 2 lanes per protein) of purified proteins, and 1, 2, 4, 10, 20 μg per lane of BSA and molecular weight markers onto a 15% SDS-PAGE gel. Run the gels with the Mini-PROTEAN Tetra Cell, following the manufacturer’s instructions. Perform EZ-Run Protein Gel Staining according to the manufacturer’s instructions.
Quantify the intensity of all bands in each lane for each protein corresponding to BSA (~67 kDa), MDM2 (~13 kDa), or MDMX (~15 kDa). Use ImageJ (freely available from: http://rsbweb.nih.gov/ij/download.html) or custom software provided by the manufacturer of the gel quantification software.
Establish the linear relationship between the amounts of BSA loaded and quantification of the detected band intensity.
Using the established BSA amount-band intensity, calculate the percentage of total MDM2 or MDMX proteins in each preparation.
3.2. Fluorescence Polarization Assay
3.2.1. Choosing the Working Probe and Protein Concentration
Dilute 10 μl 1 mM DMSO stock of Rhodamine-labeled p53 peptides (Rd-p53 peptide) 1:100 by adding 990 μl FP assay buffer (final concentration: 10 μM) (see Notes 8 and 9).
Prepare 12 dilutions at twofold dilution of the Rd-p53 peptides in a 384-well plate: dispense 60 μl FP assay buffer to wells A2–A12. Pipette 60 μl of 10 μM Rd-p53 to A1 and A2. After mixing A2, transfer 60 μl from A2 to A3, and continue this twofold dilution all the way to well A12. Discard the excess 60 μl from A12. In this way, there are 12 dilutions 1:2 serial dilution of the peptides at the highest concentration of 10 μM (A1).
Centrifuge the plate for 2 min at 200 × g (see Note 10).
Place the plate into a SpectraMax M5e plate reader (Molecular Devices). Open the Softmax Pro software and select the FP option. Set the excitation at 531 nm and emission at 595 nm. Read fluorescence polarization at room temperature (RT, 19–25°C). Select the fluorescence option and read the total fluorescence.
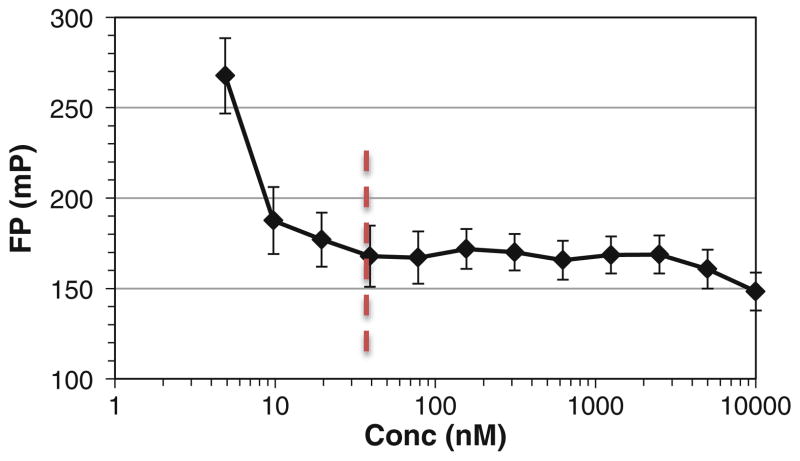
Transfer the Softmax Pro data to Microsoft Excel. Plot the data points (fluorescence polarization as a function of probe concentration) and identify the optimal concentration of the probe (Rd-p53 peptide) which starts to show stable FP signal (see Fig. 5) (see Note 11).
Prepare 12 dilutions at twofold dilution of MDM2/MDMX proteins in a 384-well plate. The final volume of diluted proteins in each well is 20 μl.
Add 40 μl of 75 nM Rd-p53 peptide in each well for a final concentration of 50 nM Rd-p53 peptide per well.
Spin down the plate for 2 min at 200 × g then cover the plate, incubate for 30 min and then measure the fluorescence polarization and total fluorescence in the SpectraMax plate reader (see Note 12).
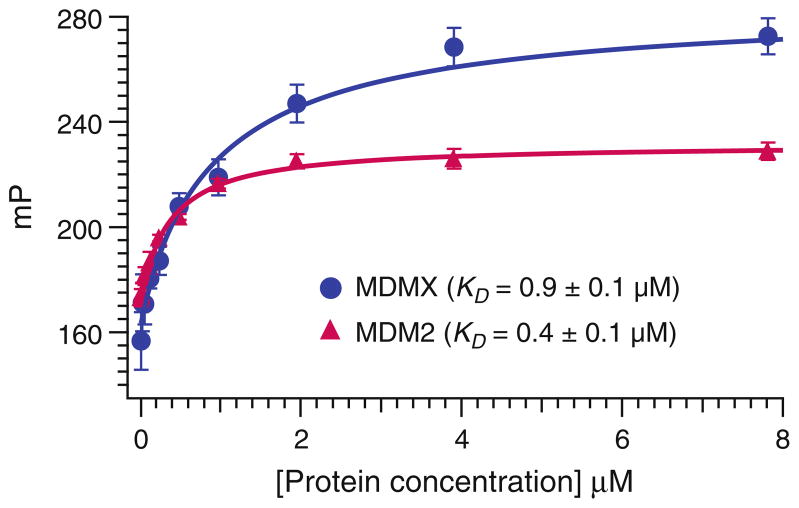
Transfer the Softmax Pro data to Microsoft Excel. Using any curve fitting analysis software (e.g., Igor Pro), plot the mP values versus the concentrations of the proteins. Calculate the KD values using the Hill equation (see Fig. 6).
Fig. 5.
The optimal concentration of the free probe for FP assay is determined by varying the concentration of the free probe and identify the lowest concentration that starts to give a stable polarization signal.
Fig. 6.
The saturation curve of Rd-p53 peptide to recombinant MDMX1–137 and MDM21–118 proteins.
3.2.2. Specificity of FP Assay
Prepare 12 dilutions at twofold dilutions of non-labeled p53 peptides in 20 μl FP assay buffer in the 384-well plate. The final volume of diluted peptides in each well is 20 μl.
Dispense 40 μl assay solution containing 1.5 μM of MDM2 or MDMX and 75 nM of the Rd-p53 peptide. The final protein concentration is 1 μM and the probe concentration is 50 nM in a final volume of 60 μl per well.
Spin down the plates for 2 min at 200 × g following incubation at room temperature for 10 min.
Measure the fluorescence polarization signal with excitation at 531 nm and emission at 595 nm using a SpectraMax plate reader.
Analyze the data according to Protocol 3.2.7.
3.2.3. Effect of DMSO Concentration on p53-MDM2/MDMX Binding
Prepare 12 dilutions at twofold dilutions of DMSO in the 384-well plate in 20 μl assay buffer.
Add 40 μl FP assay buffer containing 75 nM Rd-p53 peptide and 1.5 μM MDM2/MDMX proteins. The final highest concentration of DMSO is 33.3% in a final volume of 60 μl per well.
Spin down the plates for 2 min at 200 × g following incubation at RT for 30 min.
Determine the fluorescence polarization in the SpectraMax plate reader.
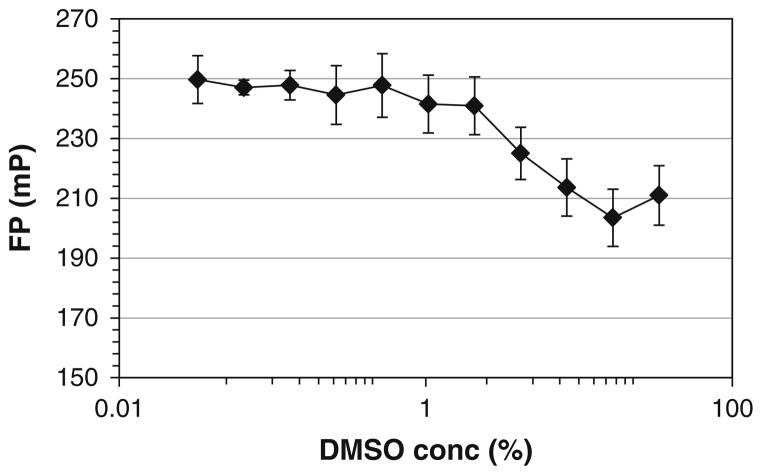
Transfer the Softmax Pro data to Microsoft Excel. Plot fluorescence polarization signal as a function of the % DMSO to find the minimum DMSO concentration which does not interfere with the binding (see Fig. 7).
Fig. 7.
The effect of DMSO concentration on the stability of FP binding experiments. The measurements were carried out by titration of DMSO into the mixture of Rd-p53 (50 nM) and MDMX proteins (1 μM). A stable FP was observed at lower than 4% DMSO, suggesting that the assay is safe for screening compounds within 4% DMSO.
3.2.4. Determining Z′-Factor
Prepare 1,200 μl of the probe solution containing 50 nM Rd-p53 peptides in FP assay buffer.
Prepare 1,200 μl of the protein solution containing 1 μM of the MDM2 or MDMX proteins and 50 nM Rd-p53 peptides in FP assay buffer.
Dispense 60 μl/well of the probe solution (no protein) to wells A24–P24 (totally 16 wells). These are positive controls (100% inhibition).
Dispense 60 μl/well of the protein solution to wells A23–P23 (totally 16 wells). These are negative controls (0% inhibition).
Centrifuge the plate for 2 min at 200 × g then cover the plate.
Incubate for 30 min and then determine the fluorescence polarization using the SpectraMax plate reader.
Calculate Z′-factor according to Protocol 3.2.7.
3.2.5. Screening
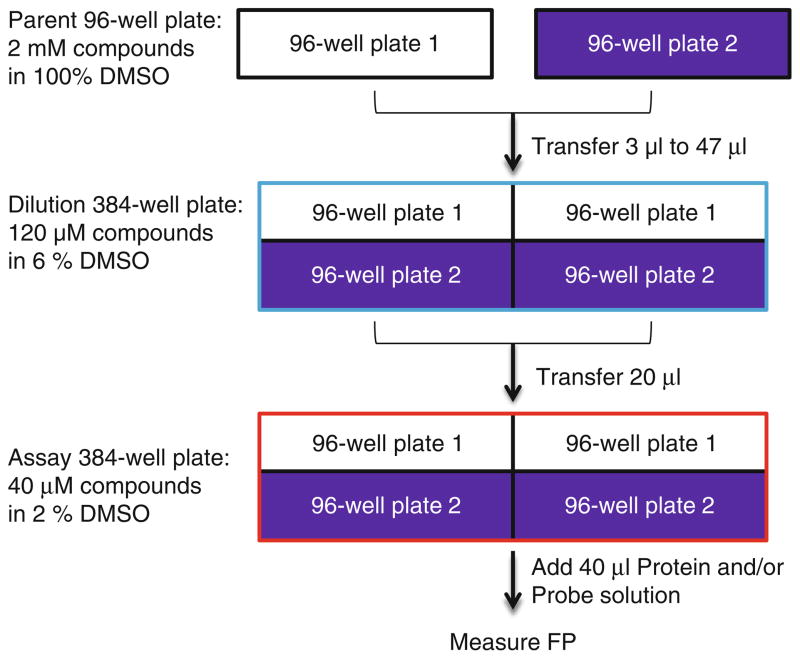
Prepare compounds in 100% DMSO in 96-well plates at 2 mM concentration. Each plate should have non-labeled p53 peptides and MI63 as controls. Add 100% DMSO into the wells of the last column (column 12) for the negative controls. Thus, each plate contains 88 compounds. This is the parent plate (see Fig. 8) (see Note 13).
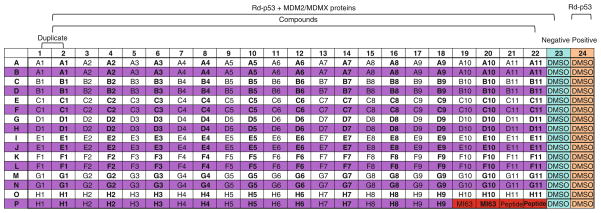
Transfer the compounds from the parent plates, in duplicate, to 384-well plates. Pipette 3 μl of each compound from the 96-well parent plates into 47 μl of FP assay buffer in the 384-well plates according to the plate map in Fig. 9. For example, the compound is transferred from the well A1 in the 96-well plates to the wells A1 and A2 in the 384-well plates. Thus, each 384-well plate contains the compounds from two 96-well parent plates. The last two columns (Columns 23 and 24) correspond to 6% DMSO without compounds. This is the dilution plate (see Notes 14–16).
Pipette 20 μl of 6% DMSO compound stocks to a 384-well plate, this is the assay plate.
Thaw a sufficient amount of MDM2 or MDMX proteins on ice.
Prepare solution 1 containing 75 nM Rd-p53 peptides and 1.5 μM MDM2 or MDMX proteins (1.5× solution) and solution 2 containing only 75 nM Rd-p53 peptides (1.5× solution), which are sufficient for the whole plate reactions.
Dispense 40 μl protein/probe solution 1 to all wells except the last column to the assay plate.
Add 40 μl of probe/buffer solution 2 to the last column: positive control (no proteins) wells.
Spin down the plate for 2 min at 200 × g.
Incubate for 30 min at room temperature. Keep plates covered and in the dark.
Measure the fluorescence polarization using a SpectraMax plate reader (see Note 17).
Analyze data according to Protocol 3.2.7.
Fig. 8.
Workflow chart: preparation of plates for the screening by FP assay. A single well of the parent 96-well plate is repeated in duplicate in the 384-well plate.
Fig. 9.
384-well plate layout for the screening of MDM2/MDMX inhibitors by FP. All wells in columns 1–24 contain Rd-p53 (50 nM). Columns 1–23 include the proteins (1 μM) and compounds (40 μM) or DMSO (column 23).
3.2.6. FP Dose-Response Validation Assay
To each hit compound to be tested, prepare 11 dilutions at twofold serial dilution in 100% DMSO at 2 mM concentration in a 384-well plate. Add 100% DMSO into the wells of the last two columns of the 384-well plate (columns 23 and 24) for the controls. This is the parent plate.
Add 3 μl of each compound from the parent plates to 47 μl of FP assay buffer in a 384-well plate. This is the dilution plate and these intermediate stocks are at 6% DMSO.
Pipette 20 μl diluted compounds from the dilution plate to a new 384-well microplate, this is the assay plate. The final DMSO concentration is 2%.
Thaw a sufficient amount of MDM2 or MDMX proteins on ice.
Prepare solution 1 containing 75 nM Rd-p53 peptide and 1.5 μM MDM2 or MDMX proteins (1.5× solution) and solution 2 containing only 75 nM Rd-p53 peptides (1.5× solution), which are sufficient for the whole plate reactions.
Dispense 40 μl protein/probe solutions to all wells of the assay plates except the last column.
Add 40 μl of probe/buffer to the last column: positive control (no proteins) wells.
Spin down the plate for 2 min at 200 × g.
Cover the plate with a new plate seal. Incubate for 30 min at room temperature. Keep plates covered and in the dark.
Measure the fluorescence polarization using a SpectraMax plate reader.
Analyze the data according to Protocol 3.2.7.
3.2.7. Data Analysis
Transfer the Softmax Pro data to Microsoft Excel.
Calculate the average and the standard deviations of the negative control samples (column 23).
Calculate the average and the standard deviations of the positive control samples (column 24).
-
Calculate the Z′ factor for each plate:
where μ+ and μ− represent the means of the positive and negative control signals, respectively, and SD+ and SD- are standard deviations of the mean values for the positive and negative controls, respectively (see Note 18).
-
Calculate the percent inhibition of each sample as follows:
Inhibitory activity is calculated as the mean FP value of negative controls minus the sample FP value divided by the mean FP value of negative controls minus the mean FP value of positive controls, multiplied by 100.
For each compound, percentage inhibitions were plotted against the compound concentration (see Fig. 3). Compounds greater than a certain cutoff are considered hits. For example, compounds with greater than 50% inhibition of MDM2/ MDMX-p53 binding at 40 μM are defined as active hits of the primary screening. The primary screening active hits proceed to the dose-response confirmation stage.
For the dose-response confirmation, using suitable nonlinear regression analysis software such as Igor Pro, plot the calculated percent inhibition values versus the log of the concentrations of the test compound. Calculate the IC50 values using Hill equation.
Ki values were calculated by a web-based computer program developed for FP-based binding assays (http://sw16.im.med.umich.edu/software/calc_ki/) (9).
Footnotes
Expression of GST-MDM2 or GST-MDMX at higher cell densities (A600 > 0.5) and reduced temperature (28°C) results in greater yields of intact forms of the soluble proteins.
All procedures hereafter should be performed at 4°C to minimize protein degradation.
Add glycerol and DTT (1–10 mM) into the lysis buffer. Glycerol and DTT prevent degradation of proteins and increase the binding of proteins to glutathione agarose beads.
Each washing of the glutathione agarose beads after protein binding at slow speed or longer incubation time (10–30 min) is important to ensure the purity of GST fusion proteins.
After the final wash, drain the column completely to avoid dilution of the eluates.
The conditions for cleavage need to be optimized (e.g., amount of protein, time, and temperature).
Concentrate proteins to a concentration below 2 mg/ml because they may precipitate at higher concentrations.
Keep in mind that fluorophores are light-sensitive and pH-sensitive. Prepare the stock of Rhodamine-labeled p53 peptides in 100% DMSO, aliquot, and keep them from light.
High concentration of peptide stock (>10 mM) may lead to poor solubility when dissolved in the buffer.
Make sure to centrifuge the plate to remove bubbles and keep the reaction solution on the bottom.
Choose the lowest concentration (to keep it below its KD) that gives minimal variations of FP signal. We use 50 nM Rd-p53 peptides for the FP assay (protocols 3.2.5 and 3.2.6).
Determine the total fluorescence to assess whether the fluorescence of Rd-p53 changes when it binds to the protein. If binding affects the fluorescent properties of the fluorophore, the latter should be conjugated through another position, or the use of another fluorescent ligand and/or protein fragment should be explored.
For each compound to be screened, to make sure that the compounds do not interfere with the polarization assay, determine their fluorescence in the working fluorescence wavelength range and eliminate those that show fluorescence.
For all solutions in the reaction plates, mix the reaction solution well using the pipette, a pipetting system (e.g., Precission from BioTek Instruments, Inc.), an orbital shaker at 500–700 rpm, or shaking in the plate reader to ensure homogeneity.
Change the pipette tips or thoroughly rinse the tips if you are using a pipetting robot with permanent tips.
This preparation of plates for the FP assay involves systems that employ pipette tips. For systems that use the pintool device, the protocol described here needs to be adjusted accordingly.
It takes about 10–15 min to measure the fluorescent polarization of the entire plate depending on the plate readers. Consider intervals and arrange the time if you have more than one plate to measure.
The Z′ factor, indicating the quality of a FP assay, is expected to be higher than 0.7, based on negative (containing Rd-p53 peptides with MDMX or MDM2 proteins) and positive (containing Rd-p53 peptides only) controls (16 data points per positive and negative controls). If the Z′-factor is below 0.5, the plate has to be rescreened in order to increase the assay quality. The concentration of the probe and protein need to be optimized to improve the Z′-factor.
References
- 1.Czarna A, Popowicz GM, Pecak A, Wolf S, Dubin G, Holak TA. High affinity interaction of the p53 peptide-analogue with human Mdm2 and Mdmx. Cell Cycle. 2009;8:1176–1184. doi: 10.4161/cc.8.8.8185. [DOI] [PubMed] [Google Scholar]
- 2.Pazgier M, Liu M, Zou G, Yuan W, Li C, Li J, Monbo J, Zella D, Tarasov SG, Lu W. Structural basis for high-affinity peptide inhibition of p53 interactions with MDM2 and MDMX. Proc Natl Acad Sci USA. 2009;106:4665–4670. doi: 10.1073/pnas.0900947106. [DOI] [PMC free article] [PubMed] [Google Scholar]
- 3.Phan J, Li Z, Kasprzak A, Li B, Sebti S, Guida W, Schonbrunn E, Chen J. Structure-based design of high affinity peptides inhibiting the interaction of p53 with MDM2 and MDMX. J Biol Chem. 2010;285:2174–2183. doi: 10.1074/jbc.M109.073056. [DOI] [PMC free article] [PubMed] [Google Scholar]
- 4.Ding K, Lu Y, Nikolovska-Coleska Z, Qiu S, Ding Y, Gao W, Stuckey J, Krajewski K, Roller PP, Tomita Y, Parrish DA, Deschamps JR, Wang S. Structure-based design of potent non-peptide MDM2 inhibitors. J Am Chem Soc. 2005;127:10130–10131. doi: 10.1021/ja051147z. [DOI] [PubMed] [Google Scholar]
- 5.Shangary S, Qin D, McEachern D, Liu M, Miller RS, Qiu S, Nikolovska-Coleska Z, Ding K, Wang G, Chen J, Bernard D, Zhang J, Lu Y, Gu Q, Shah RB, Pienta KJ, Ling X, Kang S, Guo M, Sun Y, Yang D, Wang S. Temporal activation of p53 by a specific MDM2 inhibitor is selectively toxic to tumors and leads to complete tumor growth inhibition. Proc Natl Acad Sci USA. 2008;105:3933–3938. doi: 10.1073/pnas.0708917105. [DOI] [PMC free article] [PubMed] [Google Scholar]
- 6.Reed D, Shen Y, Shelat AA, Arnold LA, Ferreira AM, Zhu F, Mills N, Smithson DC, Regni CA, Bashford D, Cicero SA, Schulman BA, Jochemsen AG, Guy RK, Dyer MA. Identification and characterization of the first small molecule inhibitor of MDMX. J Biol Chem. 2010;285:10786–10796. doi: 10.1074/jbc.M109.056747. [DOI] [PMC free article] [PubMed] [Google Scholar]
- 7.Lee JH, Zhang Q, Jo S, Chai SC, Oh M, Im W, Lu H, Lim HS. Novel pyrrolopyrimi-dine-based alpha-helix mimetics: cell-permeable inhibitors of protein-protein interactions. J Am Chem Soc. 2011;133:676–679. doi: 10.1021/ja108230s. [DOI] [PMC free article] [PubMed] [Google Scholar]
- 8.Inoue H, Nojima H, Okayama H. High efficiency transformation of Escherichia coli with plasmids. Gene. 1990;96:23–28. doi: 10.1016/0378-1119(90)90336-p. [DOI] [PubMed] [Google Scholar]
- 9.Ding K, Lu Y, Nikolovska-Coleska Z, Wang G, Qiu S, Shangary S, Gao W, Qin D, Stuckey J, Krajewski K, Roller PP, Wang S. Structure-based design of spiro-oxindoles as potent, specific small-molecule inhibitors of the MDM2-p53 interaction. J Med Chem. 2006;49:3432–3435. doi: 10.1021/jm051122a. [DOI] [PubMed] [Google Scholar]


