Abstract
Initial steps in the development of a suite of triple-resonance 1H/13C/15N solid-state NMR experiments applicable to aligned samples of 13C and 15N labeled proteins are described. The experiments take advantage of the opportunities for 13C detection without the need for homonuclear 13C/13C decoupling presented by samples with two different patterns of isotopic labeling. In one type of sample, the proteins are ~20% randomly labeled with 13C in all backbone and side chain carbon sites and ~100% uniformly 15N labeled in all nitrogen sites; in the second type of sample, the peptides and proteins are 13C labeled at only the α-carbon and 15N labeled at the amide nitrogen of a few residues. The requirement for homonuclear 13C/13C decoupling while detecting 13C signals is avoided in the first case because of the low probability of any two 13C nuclei being bonded to each other; in the second case, the labeled 13Cα sites are separated by at least three bonds in the polypeptide chain. The experiments enable the measurement of the 13C chemical shift and 1H–13C and 15N–13C heteronuclear dipolar coupling frequencies associated with the 13Cα and 13C′ backbone sites, which provide orientation constraints complementary to those derived from the 15N labeled amide backbone sites. 13C/13C spin-exchange experiments identify proximate carbon sites. The ability to measure 13C–15N dipolar coupling frequencies and correlate 13C and 15N resonances provides a mechanism for making backbone resonance assignments. Three-dimensional combinations of these experiments ensure that the resolution, assignment, and measurement of orientationally dependent frequencies can be extended to larger proteins. Moreover, measurements of the 13C chemical shift and 1H–13C heteronuclear dipolar coupling frequencies for nearly all side chain sites enable the complete three-dimensional structures of proteins to be determined with this approach.
Keywords: PISEMA, HETCOR, Isotopic labeling, Dipolar coupling, Oriented proteins
1. Introduction
The vast majority of applications of aligned-sample solid-state NMR spectroscopy to proteins have utilized 1H/15N double resonance experiments [1–3]. This reflects the relative ease of 15N labeling of proteins by expression in bacteria, the strategic locations of the amide nitrogens within the planes of the polypeptide backbone, and the favorable spectroscopic properties of the directly bonded pair of 1H and 15N nuclei in each amide site [4]. Even when all nitrogen sites in a protein are labeled with 15N, these nuclei behave as if they are “dilute” because of the combination of their low gyromagnetic ratio and spatial isolation. Three bonds separate the backbone amide nitrogens, and there are no directly bonded pairs of nitrogen atoms in polypeptides. Consequently, it is unnecessary to incorporate homonuclear 15N/15N decoupling at any stage of the SLF (separated local field) [5] and HETCOR (heteronuclear correlation) experiments that yield well resolved two- and three-dimensional spectra of proteins, and are used to measure the orientationally dependent 1H chemical shift, 1H–15N heteronuclear dipolar coupling, and 15N chemical shift frequencies that are input for the structure calculations. However, it is desirable to measure frequencies from additional spin interactions, especially those associated with carbon atoms, in order to include the side chains in the structure determinations, and to improve the precision and accuracy of the structure calculations.
1H/13C/15N triple-resonance experiments are widely employed in both solution-state NMR [6] and MAS (magic angle spinning) solid-state NMR of proteins [7,8]. Initial steps in the development of a suite of triple-resonance solid-state NMR experiments applicable to aligned samples of 13C and 15N labeled proteins are described in this article. These experiments enable the measurement of the 13C chemical shift and 1H–13C and 15N–13C heteronuclear dipolar coupling frequencies associated with the 13Cα and 13C′ backbone sites. These frequencies provide orientation constraints complementary to those derived from the 15N labeled amide backbone sites, and will improve the quality of structure determinations. In particular, with a sufficient number of heteronuclear dipolar couplings measurements, there is the possibility of improving the precision of the calculated protein structure calculations by avoiding the use of the chemical shift frequencies that are the largest source of uncertainty due to residue-to-residue variations of the chemical shift tensors. Moreover, measurements of the 13C chemical shift and 1H–13C heteronuclear dipolar coupling frequencies for nearly all side chain sites will enable the complete three-dimensional structures of proteins to be determined with this approach.
Despite these well-established benefits, only a few triple-resonance experimental results relevant to aligned-sample solid-state NMR have been reported. This is largely because of the difficulty in implementing C detection on uniformly 13C labeled molecules with their dense network of homonuclear 13C/13C couplings among the directly bonded carbons. The triple-resonance solid-state NMR experiments described in this article take advantage of the opportunities for 13C detection without the need for homonuclear 13C/13C decoupling presented by samples with two different patterns of isotopic labeling. In one type of sample, the proteins are ~20% randomly labeled with 13C in all backbone and side chain carbon sites and ~100% uniformly 15N labeled in all nitrogen sites. Similar labeling schemes have been used in solution NMR studies of biomolecules [9,10]. In the second type of sample, the peptides and proteins are 13C labeled at only the α-car-bon and 15N labeled at the amide nitrogen of a few residues. The corresponding experiments for the complementary labeling scheme at only the C′ sites can be readily envisaged. The requirement for homonuclear 13C/13C decoupling while detecting 13C signals is avoided in the first case because of the low probability (~4%) of any two 13C nuclei being bonded to each other. In the second case, the labeled 13Cα sites are separated by at least three bonds in the polypeptide chain, so in the “worst case”, where two adjacent residues in an α-helix are labeled, the Cα sites are separated by 3.8 Å, which results in a maximum 13C/13C homonuclear dipolar coupling of 135 Hz when the inter-nuclear vector is parallel to the direction of the magnetic field. This corresponds to about 0.5 ppm in a 21T magnet, and will generally not contribute to the linewidths of the observed resonances; in magnetically aligned bilayer samples (perpendicular bicelles), the corresponding values are 54 Hz and 0.2 ppm, substantially less than the typical 1–2 ppm linewidths of the protein resonances [11]. Complementary approaches that result in alternate sites labeled with 13C have been used in MAS solid-state NMR experiments [7,12], and may also prove useful in aligned sample solid-state NMR with experiments similar to those described here.
We have previously described applications of both 15N- and 13C-detected versions of triple-resonance experiments to single-crystal samples of model peptides, and aligned samples of filamentous bacteriophage particles and membrane proteins in phospholipid bilayers [11,13–17]. Recently, we have reviewed [18] these results and extended them somewhat by constructing a new generation of triple-resonance probes and implementing SPINAL-16 decoupling [19] for greater bandwidth [20]. However, these experiments are fundamentally limited in scope: in order to observe 13C chemical shift frequencies in the spectra, it is necessary to apply homonuclear 13C/13C decoupling in an indirect dimension, and utilize 15N detection in the presence of heteronuclear 1H and 13C decoupling at the cost of the sensitivity advantage of 13C detection. An interesting approach to 13C detection of uniformly 13C and 15N labeled samples using band-selective homonuclear decoupling has been described by Ishii and Tycko [21]; however, this does not allow the entire 13C NMR spectrum to be observed in a single experiment. Thus, there is a need for the development of additional triple-resonances experiments applicable to aligned sample solid-state NMR of 13C and 15N labeled proteins [22], especially those that utilize 13C detection for higher sensitivity.
2. Results
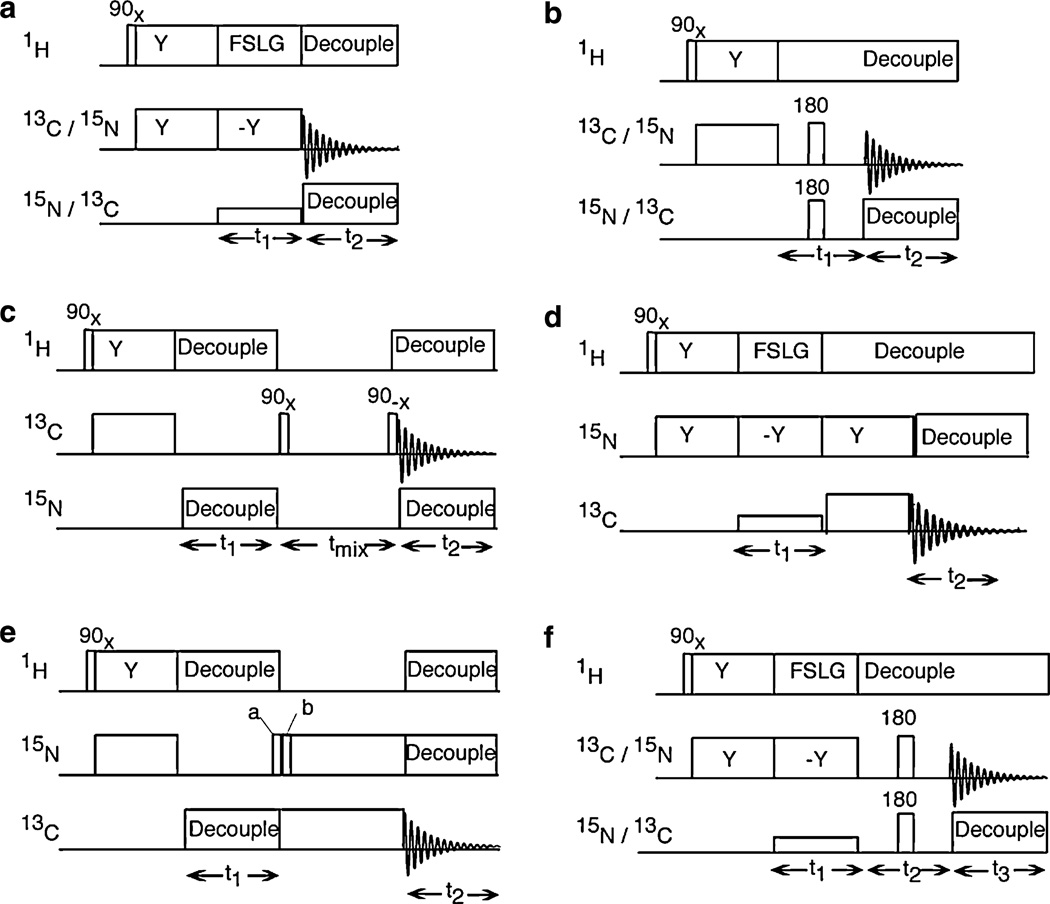
Timing diagrams for several two- and three-dimensional 1H/13C/15N triple-resonance solid-state NMR experiments are shown in Fig. 1. Experimental spectra demonstrating applications of these pulse sequences to 13C and 15N labeled peptides and proteins are presented in Figs. 2–13. Four different samples are used for the demonstrations of pulse sequences:
Fig. 1.
Timing diagrams for triple-resonance solid-state NMR experiments. (a) Two-dimensional 1H–13C or 1H–15N PISEMA. The pulse sequence for the triple resonance version of the PISEMA is same as its double resonance version except that low power irradiation (mismatched to the irradiations in the other two channels) is applied during t1 period at the resonance frequency of the undetected nucleus. (b) Two-dimensional 13C–15N dipolar coupling measurement. The phase of the 180° pulse is same as for the cross-polarization irradiation. The receiver phase is cycled as (x, —x) and the 90° pulse on the 1H channel is phase cycled as (x, −x). (c) Twoα-dimensional 13C/13C spin exchange. The 90° pulse after the t1 period is phase incremented by 90° for quadrature detection. (d) Two-dimensional 1H–15N PISEMA with 13C detection. (e) Two-dimensional 13C/15N HETCOR. (f) Three-dimensional 1H–13C dipolar coupling/13C–15N dipolar coupling/13C chemical shift or 1H–15N coupling/13C–15N dipolar coupling/15N chemical shift correlation.
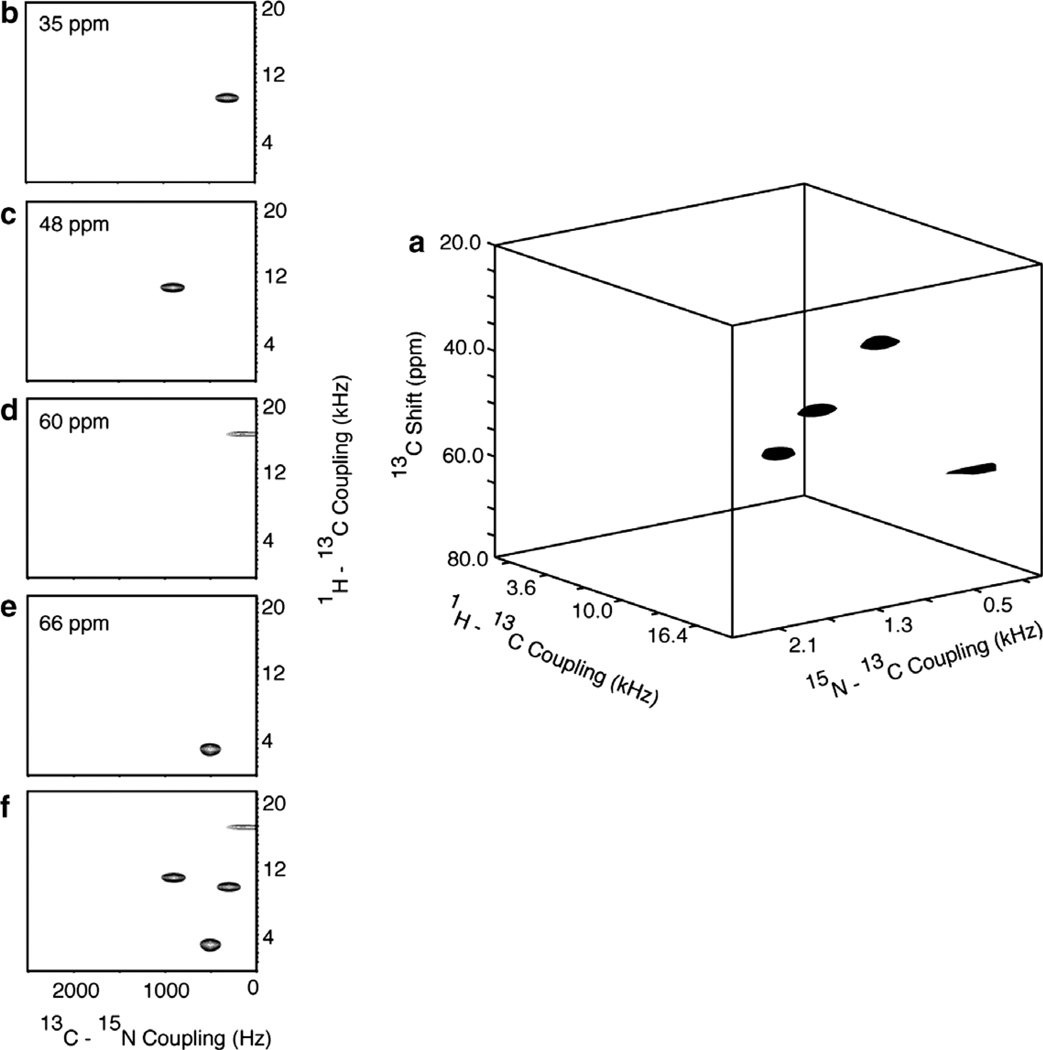
Fig. 2.
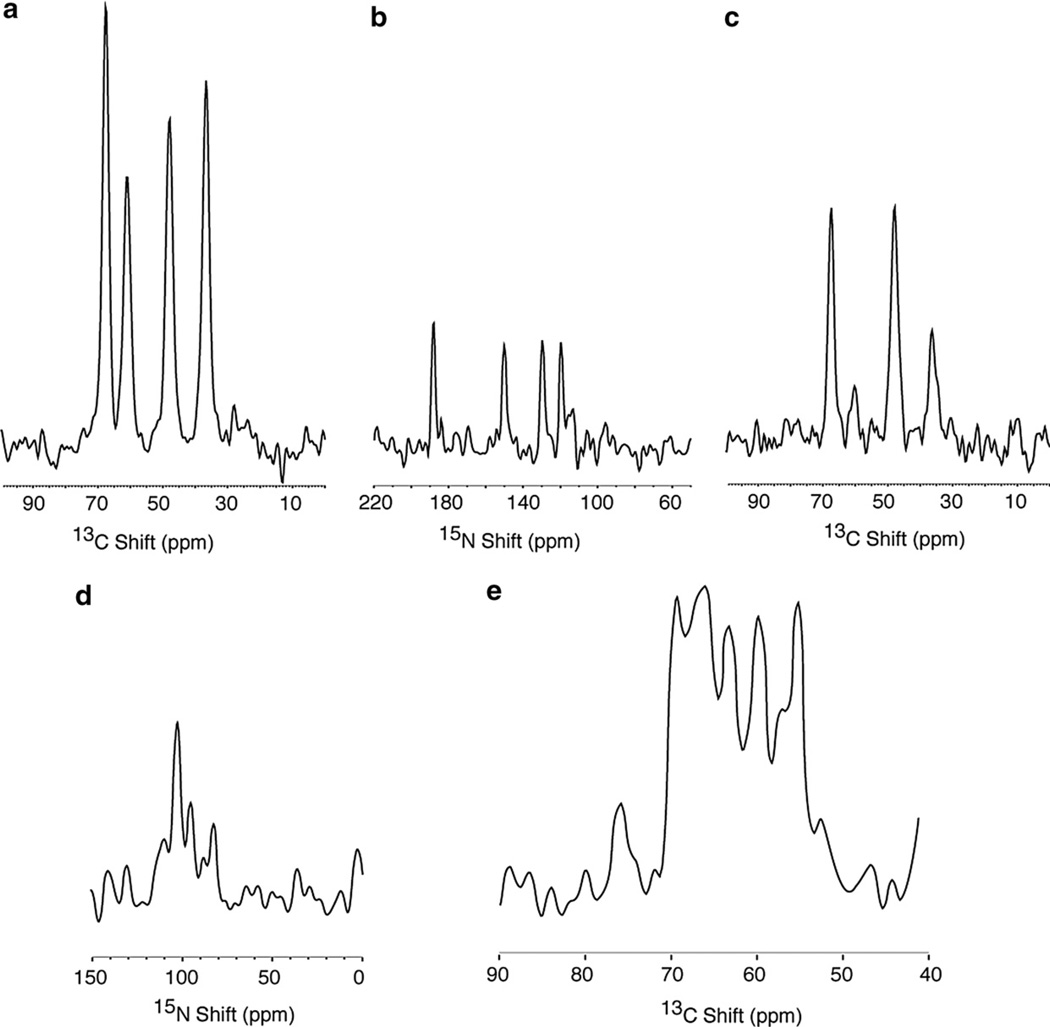
Comparison of 13C and 15N detected one-dimensional NMR spectra. (a–c) are from the 13Cα, 15N labeled single crystal of N-acetyl leucine (13Cα, 15N NAL), and resulted from signal averaging 8 scans. The four resonances in the spectrum correspond to the four molecules in the unit cell of the crystal. (d) and (e) are from the Pf1 coat protein in magnetically aligned phospholipid bilayers where the protein is labeled with 13Cα and 15N at all valine, leucine and isoleucine residues (13Cα, 15N VLI Pf1), and resulted from signal averaging 256 scans. The 1H and 15N (or 13C) decoupling fields applied during data acquisition were 50 kHz. All of the cross-polarization mix times were 1 msec and the recycle delays 6 s. (a) 13C detection following cross-polarization. (b) 15N detection following cross-polarization. (c) 13C detection following double-cross-polarization. (d) 15N detection following cross-polarization. (e) 13C detection following cross-polarization.
Fig. 13.
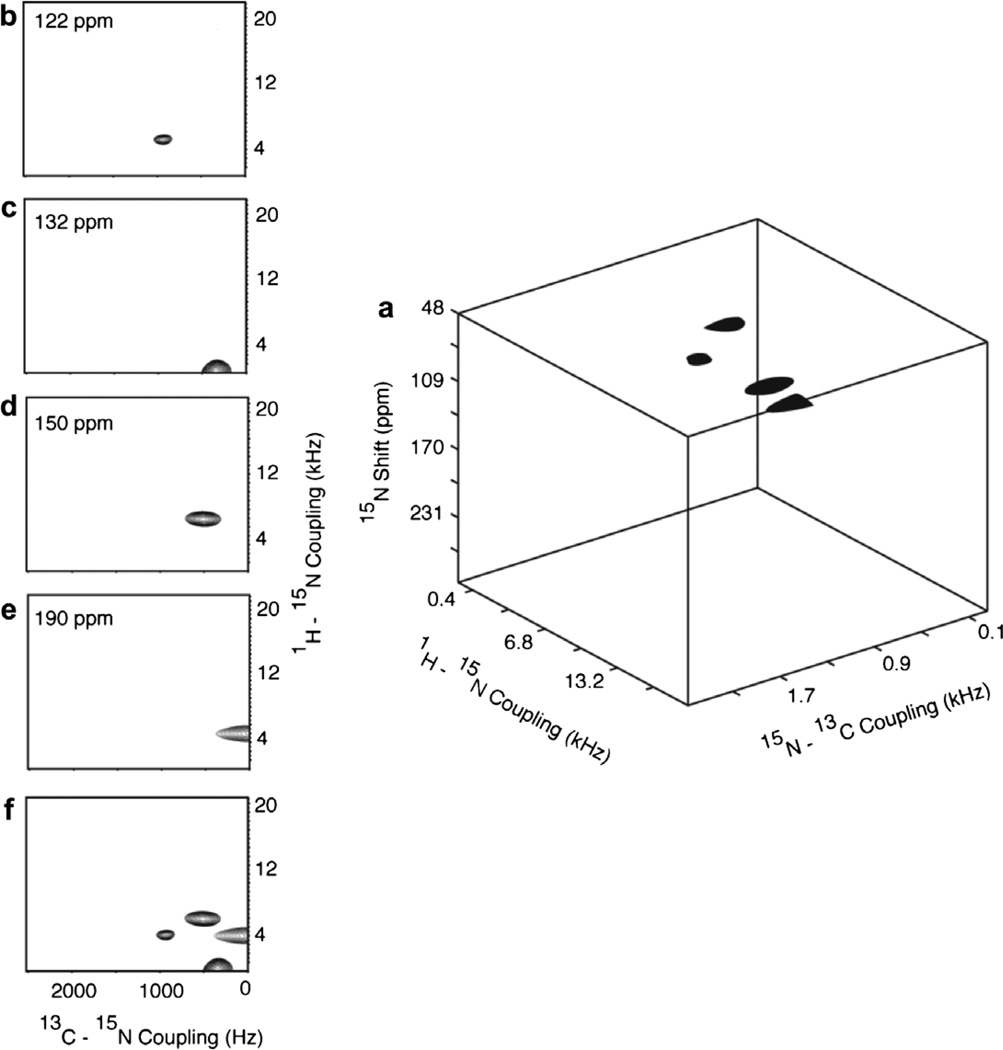
Results from the three-dimensional experiment diagrammed in Fig. 1f that correlates 15N chemical shift/1H–15N dipolar coupling/13C–15N dipolar coupling frequencies performed on the 13Cα, 15N labeled single crystal of N-acetyl leucine (13Cα, 15N NAL). (a) Three-dimensional cube displaying all four resonances. (b)–(e) Two-dimensional planes at 15N chemical shift frequencies containing resonance intensity. (f) Two-dimensional projection. 32 points in the 1H–15N dimensions (spectral width = 40 kHz) and 21 points in the 13C–15N dimensions (spectral width = 5.0 kHz) were acquired with 4 scans.
13Cα, 15N labeled single crystal of N-acetyl leucine (13Cα, 15N NAL);
15N labeled single crystal of N-acetyl valine (NAV);
Pf1 coat protein in magnetically aligned phospholipid bilayers where the protein is labeled with 13Cα and 15N at all valine, leucine and isoleucine residues (13Cα, 15N VLI Pf1);
Pf1 coat protein in magnetically aligned bacteriophage particles where the protein is labeled ~20% randomly with 13C and ~100% uniformly with 15N Pf1 (13C, 15N Pf1).
The one-dimensional spectra in Fig. 2 demonstrate the improvement (approximately fourfold) in signal to noise ratio that results from 13C detection compared to 15N detection with as many other factors as possible kept constant. The spectra in Fig. 2a – c were obtained from the single crystal sample of 13Cα and 15N labeled N-acetyl-leucine (13Cα, 15N NAL). The four lines in the spectra reflect the four unique molecular orientations in the unit cell of the crystal. The fully decoupled one-dimensional 13C Fig. 2a) and 15N (Fig. 2b) NMR spectra were obtained by conventional single-contact spin-lock cross-polarization [23]. The 13C NMR spectrum in Fig. 2c was obtained by double-cross-polarization [24] with transfers of magnetization from 1H to 15N to 13C in successive steps. The double-cross-polarization procedure is not as effective as direct cross-polarization in generating 13C magnetization, nonetheless, the signal to noise ratio of the spectrum in Fig. 2c is substantially higher than that observed with simple 15N cross-polarization and detection (Fig. 2b). The 13C resonance at 62 ppm in the double-cross-polarization spectrum in Fig. 2c has noticeably lower intensity than the other resonances because its very small 13C–15N dipolar coupling (as observed with other experiments, e.g. Fig. 8a) reduces the relative efficiency of the 15N to 13C transfer step. To a lesser extent, this is the case for the 13C resonance at 35 ppm, since it too has reduced intensity in experiments with transfers that rely on 13C–15N dipolar couplings. The extent of magnetization transfer between 15N and 13C depends mainly upon the magnitude of the 13C–15N dipolar coupling and the length of the mix time for cross-polarization. The experiments were individually optimized for maximum signal intensity by varying the mix time for the transfer; for relatively weak 13C–15N couplings (<200 Hz), maximum transfer occurs with a 5.0 ms mix time; in contrast, for larger C- N couplings (~1 kHz) a mix time of 1.0 ms yields the largest signals. The comparison of the N- (Fig. 2d) and 13C- (Fig. 2e) detected cross-polarization spectra demonstrates similar improvements for a double-labeled membrane protein in magnetically aligned bilayers. In this example, the 46-residue coat protein of the filamentous bacteriophage Pf1 is selectively labeled in the valine, leucine, and isoleucine residues with 13Cα and 15N (13Cα, 15N VLI Pf1). Although a portion of the signal intensity in Fig. 2e comes from the natural abundance 13C background from the lipids and the protein, most of the increase in the amplitude relative to that in Fig. 2d is due to signals from the labeled residues.
Fig. 8.
Two-dimensional 13C–15N SLF spectra obtained using the pulse sequence in various mix times in the pulse sequenceFig. 1b. (a) and (b) are from the 13Cα, 15N labeled single crystal of N-acetyl leucine (13Cα, 15N NAL). (c) Is from the 15N labeled single crystal of N-acetyl valine (NAV). (a) and (c) 13C detected. (b) 15N detected. For spectra a and b, four scans were collected for 48 points in the indirect dimension with 100 µs dwell time and 16 scans were collected for spectrum c.
2.1. PISEMA
The pulse sequence for two-dimensional PISEMA (polarization inversion spin exchange at the magic angle) applicable to 13C and 15N labeled samples shown in Fig. 1a is compatible with either 13C or 15N detection. This triple-resonance version of PISEMA differs from the standard double-resonance experiment [25] in that low power irradiation is applied to the unobserved nucleus during the heteronuclear spin-exchange interval (t1), and high power irradiation is applied to both 1H and the unobserved nucleus during data acquisition (t2). It is intended for situations where homonuclear decoupling of the observed nuclei is unnecessary because of the isotopic or spatial isolation of the labeled sites. In the experiments diagrammed in Fig. 1, the irradiations responsible for heteronuclear decoupling are modulated by SPINAL-16 [19] to increase their bandwidth for high field applications [20] with the exception of the low level continuous wave irradiations applied to the unobserved nuclei in PISEMA-based pulse sequences.
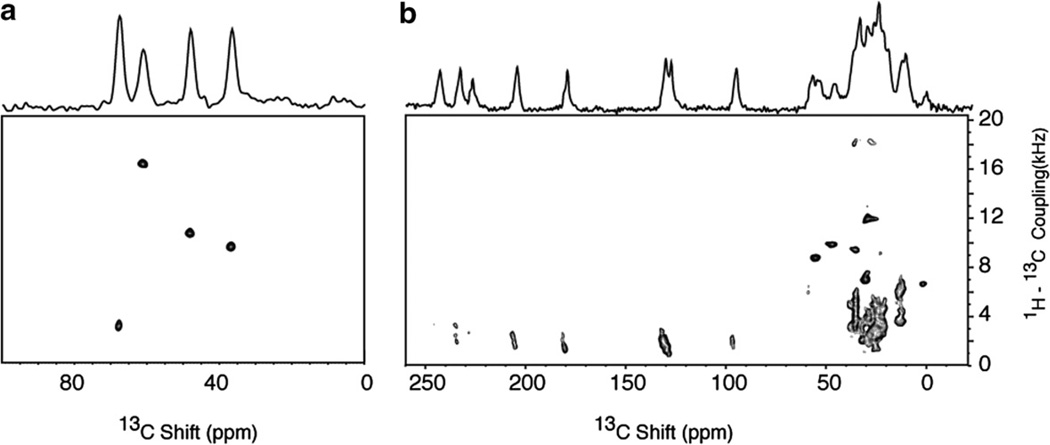
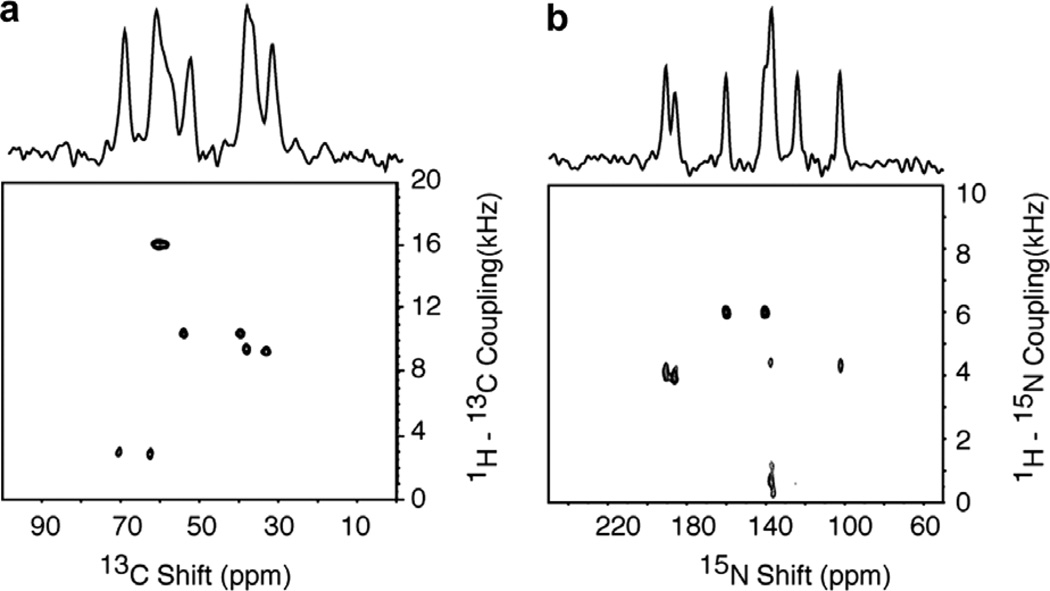
The two-dimensional 1H–13C PISEMA spectra in Fig. 3 demonstrate that all 13C sites in peptides, including those without directly bonded hydrogens, e.g. carbonyl and carboxyl carbons, have measurable 1H–13C heteronuclear dipolar couplings. The two-dimensional spectrum in Fig. 3a was obtained on the single crystal sample of 13Cα, 15N NAL and each of the 13Cα resonances has a different 1H–13C dipolar coupling frequency between about 3 and 17 kHz. All of the dipolar coupling frequencies are reported as half the total splitting, since one half of the spectrum is displayed, which is symmetric about the zero frequency. For comparison, the spectrum in Fig. 3b was obtained on a single crystal sample of 15N labeled N-acetylvaline (NAV) with all of the carbon sites in natural isotopic abundance. There are eight distinct resonances from the carbonyl and carboxyl carbons (one each in each of four unique molecules in the unit cell) between 95 and 240 ppm in the spectrum in Fig. 3b, and each of them has discernable 1H–13C heteronuclear dipolar couplings varying between 2 and 4 kHz. The 13Cα resonances are recognizable as single peaks between 30 and 55 ppm. Other aliphatic carbons contribute more complex patterns [26] to the spectrum between 10 and 40 ppm. The 13C chemical shift and 1H–13C dipolar coupling frequencies and spectral patterns demonstrate the potential for using long-range heteronuclear dipolar couplings as distance and angular constraints for the carbonyl and carboxyl carbons as well as for obtaining angular constraints on the aliphatic side chains.
Fig. 3.
Two-dimensional 1H–13C PISEMA spectra obtained using the pulse sequence in Fig. 1a. (a) Spectrum from the 13Cα, 15N labeled single crystal of N-acetyl leucine (13Cα, 15N NAL) obtained with 4 scans for each of 128 t1 points. (b) Spectrum from the 15N labeled single crystal of N-acetyl valine (NAV) obtained with 8 scans for each of 128 t1 points. During the heteronuclear spin exchange period (t1), the radiofrequency field strength of 55 kHz power level on the 1H channel enabled the maximum 1H–13C dipolar couplings to be observed without aliasing. The recycle delay was 6 s. The two-dimensional data sets were zero filled to 1K data points and multiplied by a sine bell window function in both dimensions before double Fourier transformation.
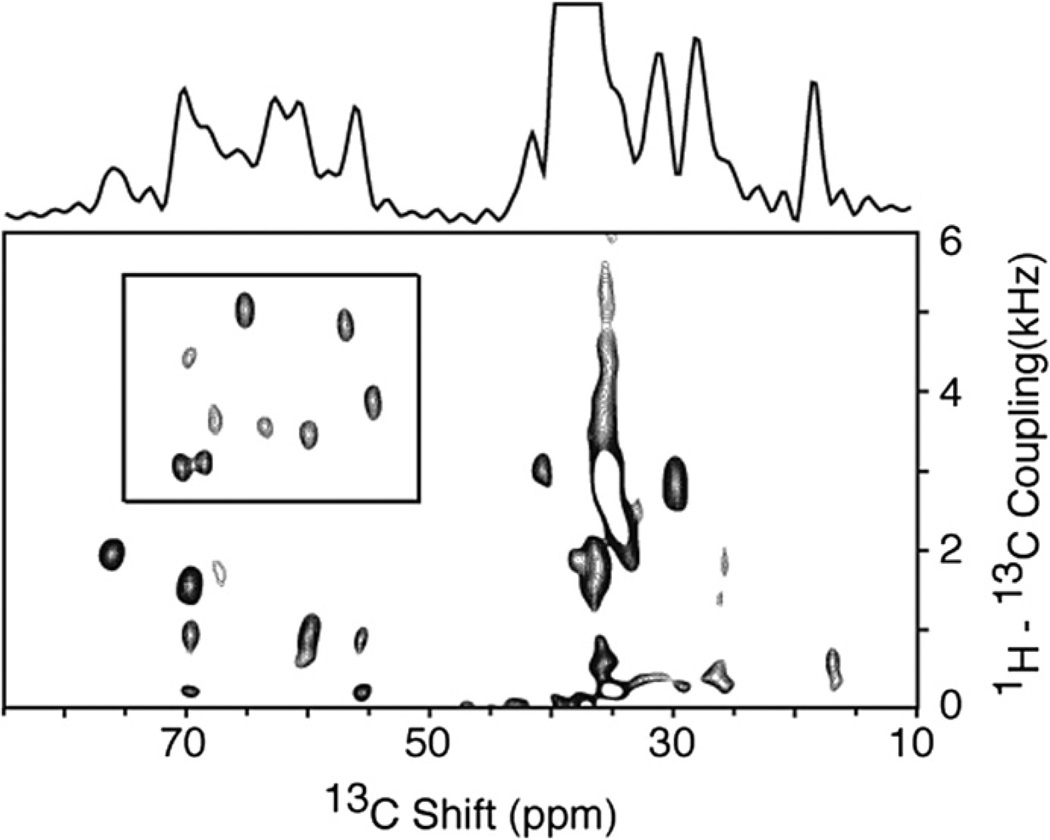
The two-dimensional 1H–13C PISEMA spectrum of a selectively 13Cα, 15N labeled membrane protein in magnetically aligned bilayers is shown in Fig. 4. Pf1 coat protein has a total of fifteen valine, leucine, and isoleucine residues, nine of which are in the transmembrane helix and contribute resonances (within the box) to the spectrum in Fig. 4; their 1H–13C dipolar couplings range between 2.7 and 5.8 kHz with 13C chemical shift frequencies between 54 and 70 ppm. Nearly all of the other signals in the spectrum are from the natural abundance background of the lipids, as verified by comparison with a spectrum of a similar sample without 13C labels in the protein. These data provide access to two orientationally dependent frequencies at the α carbon sites, which are valuable complements to the previously available frequencies associated with the amide nitrogen sites.
Fig. 4.
Two-dimensional 1H–13 C PISEMA spectrum of the membrane-bound form of the 46-residue Pf1 coat protein in magnetically aligned phospholipid bilayers where the protein is labeled with 13Cα and N at all valine, leucine and isoleucine residues (13Cα, N VLI Pf1). The spectrum was obtained using the pulse sequence in Fig. 1a. All of the signals in the box are from 1H–13Cα dipolar couplings. Nearly all of the other intensity observed in the spectrum in from the natural abundance signals from the phospholipids in the sample. Ninety six scans were acquired for each of 128 points in the indirect dimension. The recycle delay was 5 s and the temperature 40 °C. The two-dimensional data set was zero filled to 1K data points and multiplied by a sine bell window function in both dimensions before double Fourier transformation.
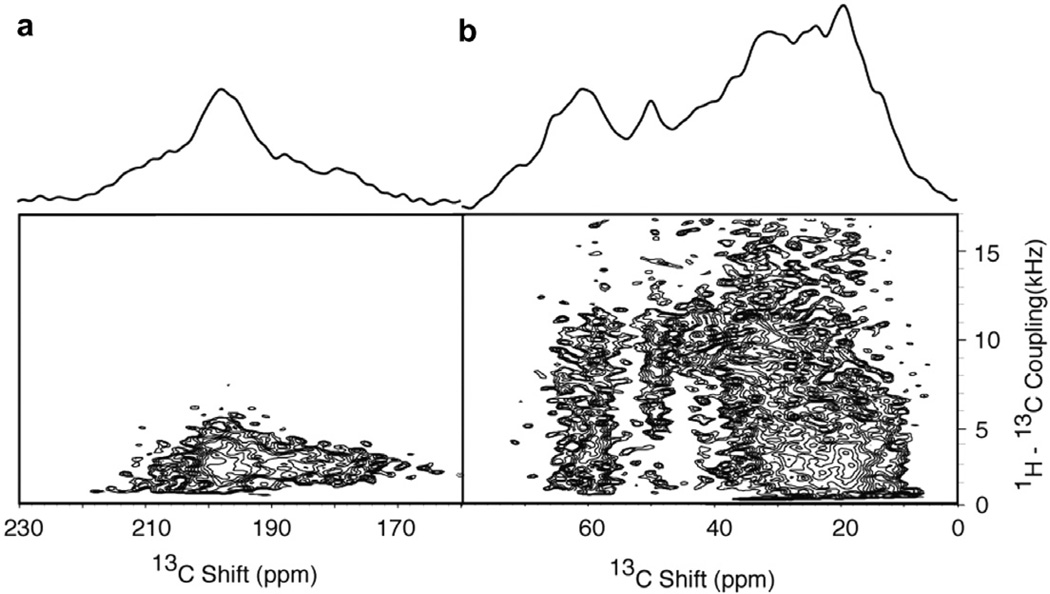
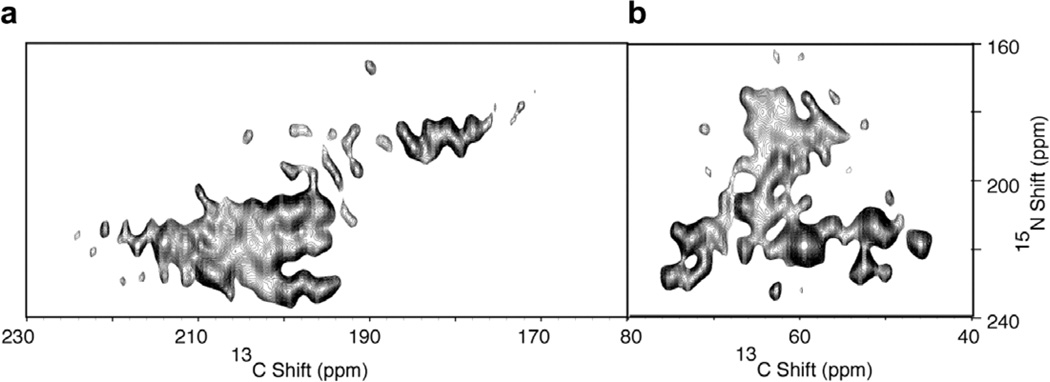
The two-dimensional NMR spectrum in Fig. 5 was obtained from the structural form of the Pf1 coat protein in magnetically aligned bacteriophage particles [27]. In this sample, the protein is randomly labeled with ~20% 13C and ~100% uniformly labeled with N. For economy of presentation, the portion of the C NMR spectrum between 80 and 160 ppm that does not contain signal intensity is not shown. The two-dimensional NMR spectrum in Fig. 5 shows that resonances from carbonyl and carboxyl carbons (160–220 ppm), Cα (55–75 ppm) and aliphatic side chain carbons (5–55 ppm) have substantial heteronuclear 1H- C dipolar couplings. The several hundred discernable resonances in this spectrum indicate the potential for analyzing essentially all carbon sites in a protein with this approach.
Fig. 5.
Two-dimensional 1H–13 C PISEMA spectrum of the structural form of the 46-residue Pf1 coat protein in magnetically aligned virus particles where the protein is labeled ~20% randomly with 3C and ~100% uniformly with 15N Pf1 (13C and 15N Pf1). (a) Carbonyl and carboxyl carbon resonances. (b) Aliphatic carbon resonances. Thirty two scans were acquired for each of 128 points in the indirect dimension. The recycle delay was 6 s, and the temperature 0 °C. The central 1H carrier frequency during t1 was +2 ppm relative to the water resonance during the PISEMA portion of the pulse sequence. The two-dimensional data set was zero filled to 1K data points and multiplied by a sine bell window function in both dimensions before double Fourier transformation.
Two-dimensional 1H–15N PISEMA experiments can be performed with 13C detection using the pulse sequence shown in Fig. 1d. After the t1 period, during which the spin exchange between 1H and 15N nuclei takes place, the 15N magnetization is transferred to 13C by cross-polarization. The 13C signals modulated by the 1H–15N heteronuclear dipolar couplings are detected during t2 in the presence of both 1H and 15N heteronuclear decoupling. A short (1.5 ms) 15N to 13C cross-polarization mix time ensures selective one bond polarization transfers. The resulting two-dimensional spectrum correlates 1H–15N dipolar coupling and 13C chemical shift frequencies.
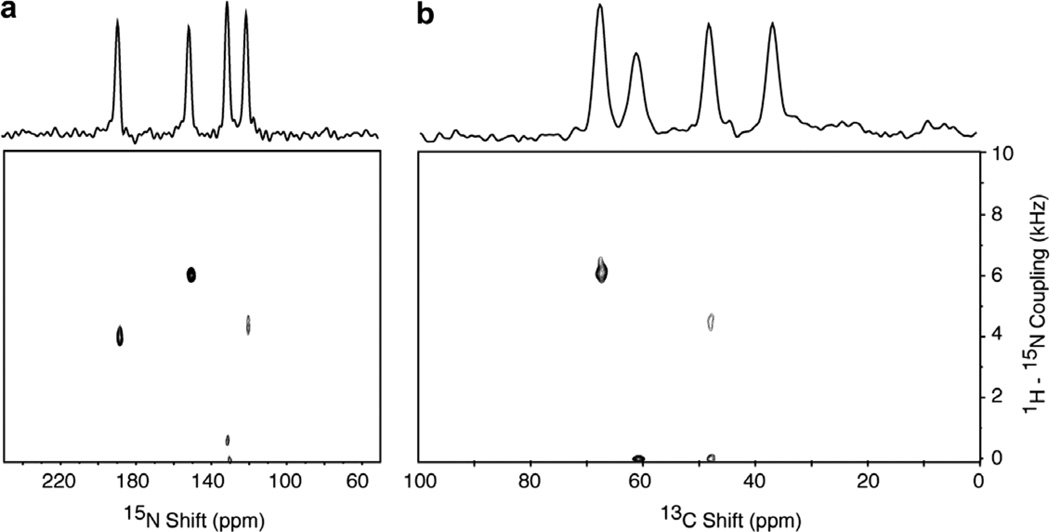
Fig. 6 contains 1H–15N PISEMA spectra of the single crystal sample of 13Cα, 15N NAL. The spectrum in Fig. 6a was obtained using the pulse sequence in Fig. 1a with 15N detection. The four resonances have 1H–15N dipolar couplings ranging from 300 Hz to 6.0 kHz at this orientation of the crystal. Fig. 6b is a 13C-detected 1H–15N PISEMA spectrum acquired using the pulse sequence shown in Fig. 1d. The double-cross-polarization mix time for the transfer of the magnetization from 15N to 13C was tuned for one bond correlation (1.0 ms). However, the signal at 62 ppm does not yield a dipolar coupling frequency due to the effects of its very small 13C–15N dipolar coupling on cross-polarization efficiency. The signal associated with the 13C resonance at 35 ppm is observable at lower contour levels, consistent with its relatively weak intensity.
Fig. 6.
Two-dimensional 1H–15N PISEMA spectra of the 13Cα, 15N labeled single crystal of N-acetyl leucine (13Cα, 15N NAL). (a) 15N detected. (b) 13C detected. Sixteen scans were acquired for each of 128 points in the indirect dimension for spectrum a and 32 scans for spectrum b. The contact time was 1.0 ms during the double cross-polarization from 15N to 13C, and the recycle delay was 5 s.
2.2. 13C/13C homonuclear spin-exchange
A pulse sequence for two-dimensional 13C/13C homonuclear spin-exchange [28] spectroscopy is diagrammed in Fig. 1c. Following cross-polarization, the 13C magnetization undergoes chemical shift evolution during t1 in the presence of both 15N and 1H heteronuclear decoupling; it is then positioned along the z-axis through application of a π/2 pulse with the appropriate phase. After the fixed-length mixing period tmix during which the z component of 13C magnetization evolves in the presence of homonuclear 13C/13C dipolar couplings, the 13C magnetization is returned to the transverse plane where it is detected in the presence of H and N hetero-nuclear decoupling.
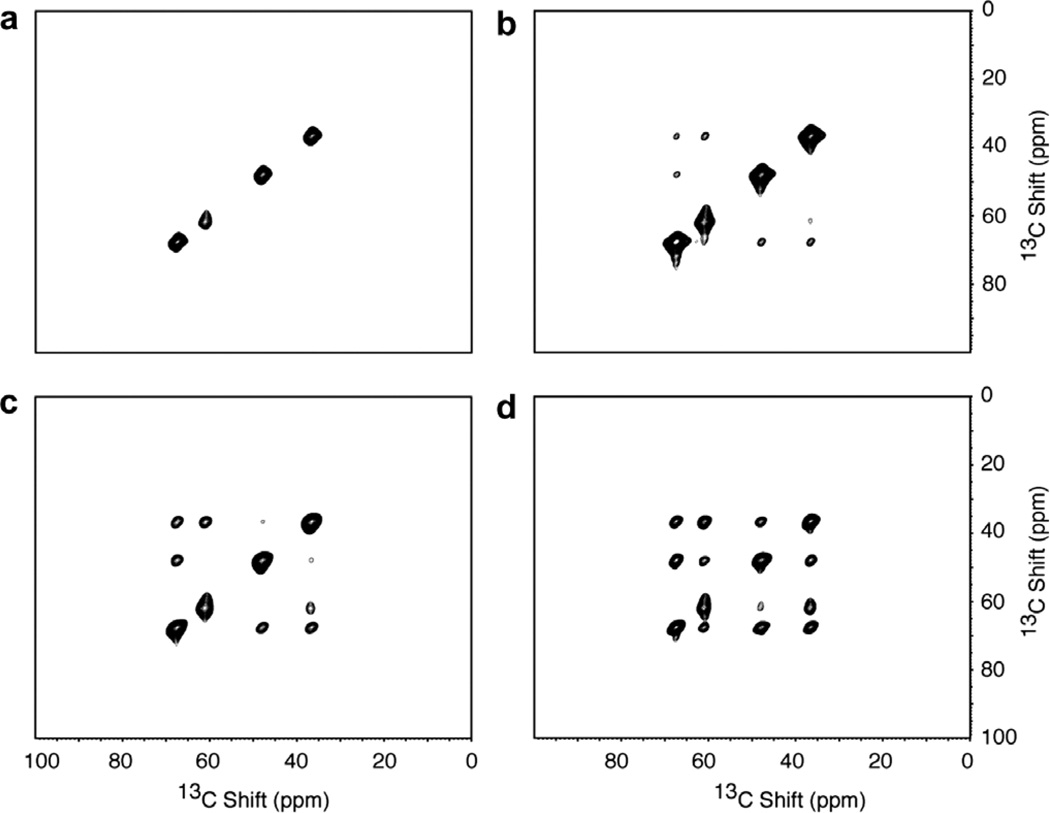
Fig. 7 contains two-dimensional 13C/ 13C homo-nuclear spin-exchange spectra of the single crystal sample of 13Cα, 15N NAL. These spectra were obtained at four different mix times (tmix) using the pulse sequence diagrammed in Fig. 1c. The four peaks along the diagonal correspond to the 13Cα resonances from the four molecules in the unit cell of the crystal. The off-diagonal cross-peaks result from homonuclear 13C/13C spin exchange between α carbons located on different molecules in the crystal. The internu-clear distances between 13Cα sites on different molecules in the crystal vary from 5.7 Å (~40 Hz) to 8.4 A (~13 Hz), and the corresponding splittings are too small to be observed directly in the experimental spectra. For the shorter mix times (1.0–2.0 s) only a limited amount of correlation intensity is observed in the spectra. For the longest mix time (4.5 s), complete correlation among all four molecules in the unit cell can be observed. Since the cross-peaks in these spectra arise from through-space interactions, the experiment strongly discriminates towards proximate pairs of nuclei, and thus provides information about distances between alpha carbons useful for making resonance assignments and as input for structure calculations.
Fig. 7.
Two-dimensional homonuclear 13C/13C spin-exchange spectra obtained from the 13Cα, 15N labeled single crystal of N-acetyl leucine (13Cα, 15N NAL) at various mix times in the pulse sequence in Fig. 1c. (a) 0.5 s. (b) 1.0 s. (c) 2.0 s. (d) 4.5 s. Eight scans for 90 t1 points were acquired with a 50 µs dwell for each spectrum. The 1H and 15N decoupling fields applied during the experiment were 50 kHz.
2.3. 13C–15 N heteronuclear dipolar couplings
The pulse sequence in Fig. 1b can be used to measure 13C–15N hetero–nuclear dipolar couplings. The 13C (or 15N) magnetization generated by cross-polarization from 1H evolves during t1 in the presence of 1H decoupling. The chemical shift evolution that occurs during the t1 period is refocused and the 13C–15N dipolar coupling preserved by the simultaneous application of πpulses in the middle of the period at both the 13C and 15N resonance frequencies. During t2, the 13C (or 15N) magnetization modulated by the 13C–15N coupling is observed in the presence of 1H and 15N (or 13C) heteronuclear decoupling. The resulting two-dimensional spectra have the chemical shift frequencies of the detected (13C or 15N) nuclei along the frequency axis associated with the direct dimension, and the 13C–15N heteronuclear dipolar coupling frequencies symmetric about the zero frequency of the indirect dimension. A version of this experiment with multiple π pulse during t1 on the unobserved nuclei with XY-16 [29] phase cycling is more tolerant of imperfections in the π pulses.
The spectra in Fig. 8 demonstrate the measurement of resolved 13C–15N couplings using the pulse sequence in Fig. 1b. The 13C-detected (Fig. 8a) and 15N-detected (Fig. 8b) spectra were obtained on the single crystal sample of 13Cα, 15N NAL. In both spectra the same 13C–15N coupling frequencies are observed, ranging from very small, with no detectable splitting, to 900 Hz. Comparison to the 15N-detected spectrum in Fig. 8b provides a method for cross-assigning 13C and 15N resonances associated with the same residue in a protein.
The data in Fig. 8c were obtained from the single crystal sample of 15N labeled N-acetyl-valine (NAV). The one-dimensional 13C NMR spectrum obtained by cross-polarization is aligned along the 13C chemical shift frequency axis. Four of the carbonyl peaks have vanishingly small 13C–15N splitting, as expected for carboxyl carbons, and four have measureable 13C–15N splittings between 200 Hz and 1 kHz, as expected for the groups in the peptide linkages. The a carbon signals appear in the range between 40 and 70 ppm, and the other aliphatic carbons give overlapping resonance patterns, as expected, between about 0 and 40 ppm.
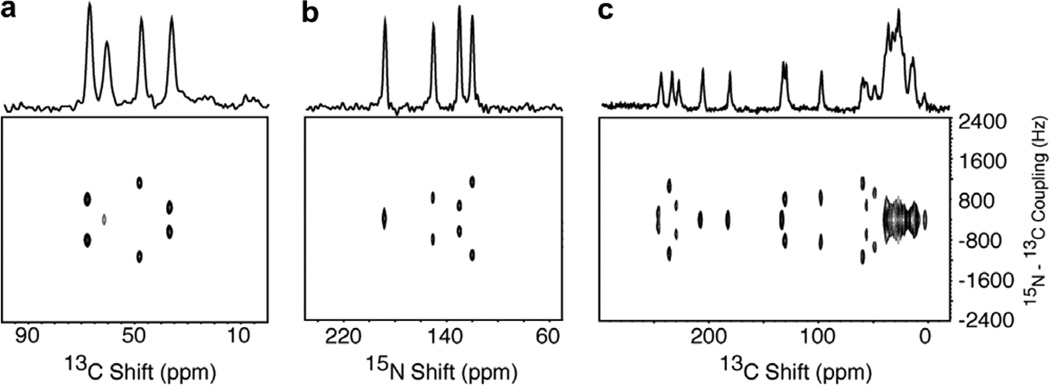
As illustrated with the spectra in Fig. 9, it is also possible to observe the 13C–15N dipolar couplings in two-dimensional PISEMA spectra through the simple expedient of acquiring the data in the absence of heteronuclear decoupling of the unobserved nucleus. The same four splittings, one of which is very small, along the 13C chemical shift axis (Fig. 9a) and the 15N chemical shift axis (Fig. 9b) are the same. The spectra are more crowded than those in Fig. 8, but clearly provide complementary opportunities for measuring 13C–15N dipolar couplings and compiling data that will be useful for making resonance assignments.
Fig. 9.
Two-dimensional PISEMA spectra of the 13Cα, 15N labeled single crystal of N-acetyl leucine (13Cα, 15N NAL). (a) 1H–13C PISEMA spectrum obtained without 15N decoupling during acquisition (t2). (b) 1H–15N PISEMA spectrum obtained without 13C decoupling during acquisition (t2). For the 2D spectrums, 4 scans were added for each t1 points (128). During spin exchange period, 55 kHz power level on the 1H channel were used. The two-dimensional data sets were zero filled to 1K data points and multiplied by sine bell window function before double Fourier transformation. The one-dimensional 13C (a) and 15N (b) NMR spectra obtained without decoupling of the unobserved nucleus are aligned along the corresponding two-dimensional spectra.
2.4. 13C/15N HETCOR
The pulse sequence in Fig. 1e correlates the chemical shift frequencies of directly bonded 15N and 13C nuclei, and yields two-dimensional 13C/15N HETCOR spectra with 13C and 15N chemical shift frequencies along separate axes. The 15N magnetization generated by cross-polarization from 1H undergoes chemical shift evolution during the incremented t1 interval in the presence of 1H and 13C heteronuclear decoupling. The 15N magnetization is then transferred to 13C by selective cross-polarization, and the 13C signals are detected in the presence of 1H and 15N heteronuclear decoupling. The phases of the 90° pulses labeled “a” and “b” are chosen to provide phase sensitive quadrature detection in the indirect dimension using the method of States et al. [30].
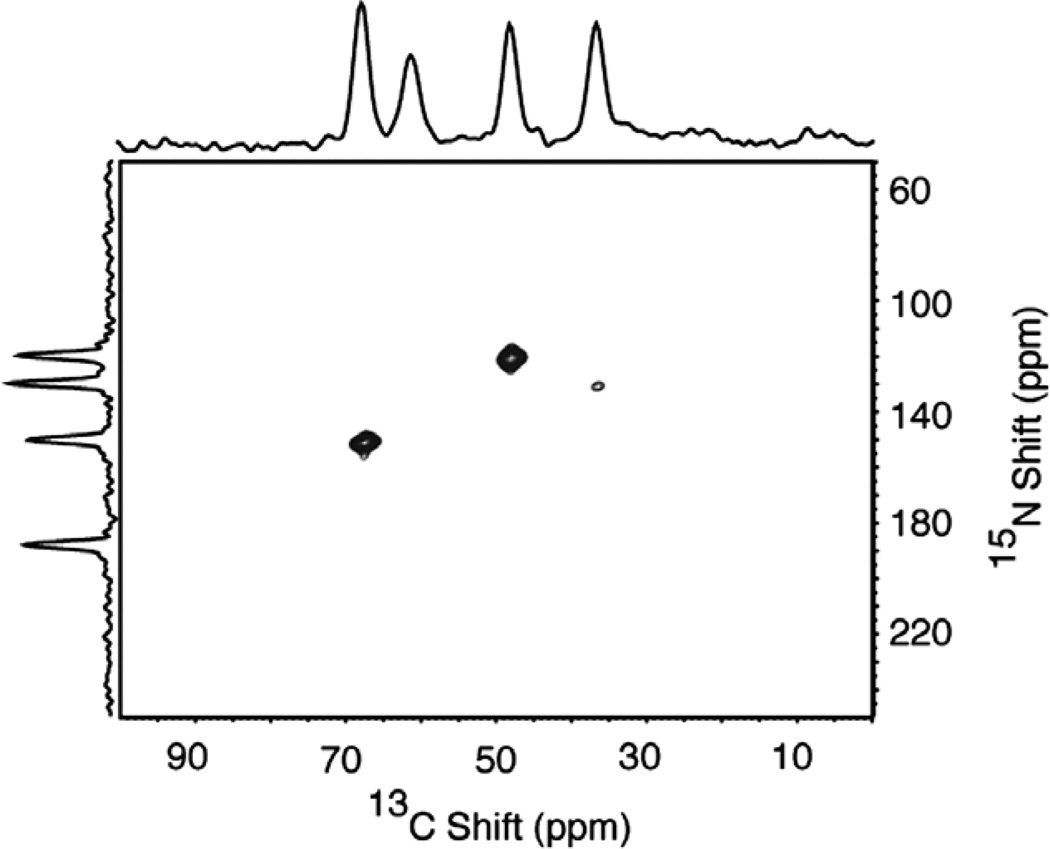
The presence of both 13C and 15N in the labeled molecules provides opportunities for 13C/15N HETCOR experiments. Fig. 10 contains a two-dimensional 13C/15N HETCOR spectrum of the single crystal sample of Cα, N NAL. As indicated by the one-dimensional spectra aligned along the 13C chemical shift and 15N chemical shift frequency axes, four resonances are expected. Only three resonances are observed due to the very small 13C–15N dipolar coupling at the site with a C chemical shift frequency of 62 ppm. Fig. 11 contains a two-dimensional 13C15N HETCOR spectrum of the same ~20% 13C, and ~100% 15N labeled protein sample used to obtain the data in Fig. 5. The 13C/15N heteronuclear correlation resonances in Fig. 11a for the carbonyl carbons and in Fig. 11b for the a carbons reflect the proximity of these sites to the 15N labeled amide sites in the peptide linkages in the backbone of the protein. Notably, there are no 13C/15N correlation resonances associated with the side chain carbons with 13C chemical shifts between 0 and 40 ppm. This demonstrates the selectivity of the experiments for sites where 13C and 15N are directly bonded.
Fig. 10.
Two-dimensional 15N/13C HETCOR spectrum of the 13Cα, 15N labeled single crystal of N-acetyl leucine (13Cα, 15N NAL) obtained using the pulse sequence in Fig. 1e. Four scans for each of 90 t1 points were acquired in the indirect dimension with a dwell of 50 µs. The 1H decoupling field during the t1 and t2 intervals was 50 kHz. The recycle delay used for the experiment was 6 s.
Fig. 11.
Two-dimensional 15N/ 13C HETCOR spectrum of the magnetically aligned sample of Pf1 bacteriophage with the coat protein labeled with both 13C and 15 N. The spectrum was acquired at 0 °C. Thirty two scans of 80 complex points were acquired in the indirect dimension with a spectral width of 30 kHz. The recycle delay was 6 s. The data were zero filled to 1K points and multiplied by a sine bell window function in both dimensions prior to double Fourier transformation. The carrier frequency for 13C irradiation was in the center of the spectrum, between the aliphatic and carbonyl resonance regions, and the double cross-polarization was optimized for both types of resonances.
2.5. Three-dimensional correlation
Three-dimensional experiments will be needed to take full advantage of the possibilities provided by the triple-resonance experiments on proteins with many 13C and 15N labeled sites. The increase in sensitivity that accompanies the use of 13C detection will contribute to the feasibility of routinely applying three-dimensional experiments to aligned protein samples. A three-dimensional triple-resonance correlation experiment is diagrammed in Fig. 1f. The t1 period of this pulse sequence is the same as that of the PISEMA experiment, and results in the measurement of the 1H–13C (or 1H–15N) dipolar couplings. During the t2 period, the transverse 13C (or 15N) magnetization evolves under the influence of the heteronuclear 13C–15N dipolar coupling, as in the pulse sequence shown in Fig. 1b. Finally, during t3, 13C (or 15N) magnetization is detected in the presence of two-channel heteronuclear decoupling. The resulting three-dimensional spectra have the 13C chemical shift correlated with 1H–13C and 13C–15N dipolar couplings. The complementary 15N detected version of the experiment yields three-dimensional spectra where the 15N chemical shifts are correlated with 1H–15N and 13C–15N dipolar couplings.
Three-dimensional spectra of the single crystal of 13Cα, 15N NAL are shown in Figs. 12 and 13. The data are presented as three-dimensional cubes, two-dimensional projections, and two-dimensional planes at frequencies corresponding to the four resonances resolved in the chemical shift dimension. Fig. 12 contains results from the 13C detected version of the three-dimensional experiment, and Fig. 13 the 15N-detected version. The cross-sections along the chemical shift planes have 1H–13C (or 1H–15N) and 13C–15N dipolar coupling frequency axes. The peaks are labeled in the figures to indicate the cross-assignments between the two experiments. It can be seen that the cross-section of the three-dimensional spectrum correlates two dipolar couplings, 1H–13C/13C–15N dipolar coupling in 13C detected versions and 1H–15N/13C–15N dipolar couplings in 15N detected versions. Since the cross-sections from the two versions of the three-dimensional experiments have a common axis of 13C–15N dipolar couplings, this experiment can also complement the chemical shift correlation between 13C and 15N resonance.
Fig. 12.
Results from the three-dimensional experiment diagrammed in Fig. 1f that correlates 13C chemical shift/1H–13C dipolar coupling/13C–15N dipolar coupling frequencies performed on the 13Cα, 15N labeled single crystal of N-acetyl leucine (13Cα, 15N NAL). (a) Three-dimensional cube displaying all four resonances. (b)–(e) Two-dimensional planes at 13C chemical shift frequencies containing resonance intensity. (f) Two-dimensional projection. 32 points in the 1H–13C dimensions (spectral width = 40 kHz) and 21 points in the 13C–15N dimensions (spectral width = 5.0 kHz) were acquired with 4 scans.
3. Discussion
In aligned sample solid-state NMR, the structure and topology of a protein are mapped onto the spectra by the orientation-dependent frequencies resulting from the anisotropic chemical shift and dipole–dipole interactions. Using 1H/15N double resonance experiments it has been possible to determine the structures of a number of proteins in virus particles and phospholipid bilayers. However, much more structural information can be gained from the use of 13C and 15N labeled proteins.
The principal advantage of using samples labeled with 13C is the increase in sensitivity associated with the detection of 13C signals. In the peptide and protein examples in Fig. 2, approximately a factor of four increase in signal to noise ratio is observed for 13C detection compared to 15N detection. This can significantly decrease the amount of time required for signal averaging.
The triple-resonance experiments feasible with 13C and 15N labeled samples also provide access to additional orientationally dependent frequencies from the 13C chemical shift and the 1H–13C and 13C–15N heteronuclear dipolar couplings. By themselves, these three frequencies are sufficient to determine the orientation of a peptide plane with respect to the direction of the magnetic field and bilayer normal. Moreover, combinations of 1H–15N, 1H–13C, and 13C–15N dipolar couplings are sufficient to calculate protein structures, and eliminating chemical shift frequencies from the structure calculations has the potential to improve the quality of the resulting structures by eliminating the uncertainties associated with the residue-to-residue variations of the chemical shift tensors.
These experiments provide opportunities for making resonance assignments. 13C/13C spin-exchange experiments identify nearby carbon sites by allowing for the broad classification of carbon resonances based on homonuclear 13C/13C dipolar coupling strengths. The ability to measure 13C–15N dipolar coupling frequencies and correlate 13C and 15N resonances provides a mechanism for making backbone resonance assignments. Three-dimensional combinations of these experiments ensure that the resolution, assignment, and the measurement of orientationally dependent frequencies can be extended to larger proteins.
These and other opportunities for improvements in resolution, sensitivity, and spectroscopic analysis arising from applications of 13C-detected triple-resonance spectroscopy to aligned protein samples have been reviewed by Vosegaard and Nielsen [22]. Our earlier implementations of triple-resonance spectroscopy were compatible with 13C detection only in a few favorable situations [13–18]. Ishii and Tycko [21] successfully implemented an approach that is generally compatible with uniformly 13C labeled proteins, although it is limited in the range of multi-dimensional experiments it can be applied to by its band-selective characteristics. By combining isotopic labeling schemes with the pulse sequences, we demonstrate the feasibility of triple-resonance spectroscopic experiments capable of simultaneous interrogation of all sites in a protein.
In summary, triple-resonance solid-state NMR experiments provide improved sensitivity through 13C detection, enhance resolution through additional frequency dimensions, enable measurements of orientation-dependent frequencies for all backbone and side chains sites, and provide mechanisms for making resonance assignments.
4. Experimental
4.1. Samples
The samples used to demonstrate the two- and three-dimensional triple-resonance experiments are single crystals of 13Cα, 15N labeled single crystal of N-acetyl leucine (13Cα,15N NAL) and 15N labeled N-acetyl valine (NAV); Pf1 coat protein in magnetically aligned phospholipid bilayers where the protein is labeled with α and 15N at all valine, leucine and isoleucine residues (13Cα, 15N VLI Pf1); and Pf1 coat protein in magnetically aligned bacteriophage particles where the protein is labeled ~20% randomly with 3C and ~100% uniformly with 15N Pf1 (13C, 15N Pf1). The single crystal of 13Cα, 15N NAL was prepared by slow evaporation of aqueous solution after acetylating 13Cα and 15N labeled leucine (Cambridge Isotope Laboratories, Andover, MA). Bacteriophage Pf1 was prepared as described previously [27]. Uniformly ~20% C and ~100% 15N labeled bacteriophage was prepared using growth media obtained from Cambridge Isotope Laboratories, Inc. and selectively (Val, Leu, and Ile) 13Cα and 15N labeled Pf1 was prepared using SLS media to avoid isotopic scrambling [31].
The sample of Pf1 coat protein in magnetically aligned bilayers was prepared as described previously [32,33]. The phospholipids were 1,2-dimyristoyl-sn-glycero-3-phospho-choline (DMPC) and 1,2-di-O-hexyl-sn-glycero-3-phospho-choline (6-O-PC) from Avanti Polar Lipids, Inc. (Alabaster, AL). Five milligrams of the lyophilized protein was dissolved in 200 µl of 100 mM 6-O-PC solution. The protein/6-O-PC solution was transferred to 43.4 mg of lyophilized DMPC. The resulting solution was vortexed and freeze-heated several times until it becomes a clear, nonviscous solution on ice. The molar ratio between long-chain lipids and short-chain lipids (q) was 3.2 and a lipid concentration was 26% (w/v). The pH of the sample was adjusted to 6.8 on ice. A flat-bottom NMR tube with a 5-mm outer diameter (New Era Enterprises, Vineland, NJ) was filled with 160 µl of the solution.
4.2. NMR instrumentation
The experimental spectra were obtained on a Varian Ino-va spectrometer with a Magnex 500/89 AS magnet using a homebuilt probe with a single 5 mm ID coil triple tuned to the 1H, 13C and 15N resonance frequencies of 500.09, 125.76 and 50.68 MHz [18]. The 13C and 15N channels were isolated from each other using band-stop (parallel resonance) filters, which provide ~35 dB of isolation. This design is robust enough to withstand 25 ms of continuous irradiation on all three RF channels at power levels of 500, 200 and 100 W on the 15N, 13C and 1H channels, respectively. For all the experiments, B1 field strengths of 50 kHz were used unless otherwise indicated. 13C chemical shifts are referenced by defining the high field peak of external adamantane to be 38.4 ppm and 15N chemical shifts by defining the resonance of external ammonium sulphate to be 26.8 ppm [34].
Acknowledgments
We thank David Black for help with the preparation of the protein samples. This research was supported by grants RO1EB01966, RO1GM064676, and RO1GM066978 and utilized the Biomedical Technology Resource for NMR Molecular Imaging of Proteins, which is supported by P41EB002031.
References
- 1.Opella SJ, Marassi FM. Structure determination of membrane proteins by NMR spectroscopy. Chem. Rev. 2004;104:3587–3606. doi: 10.1021/cr0304121. [DOI] [PMC free article] [PubMed] [Google Scholar]
- 2.Tien C, Gao PF, Pinto LH, Lamb RA, Cross TA. Initial structural and dynamic characterization of the M2 protein transmembrane and amphipathic helices in lipid bilayers. Protein Sci. 2003;12:2597–2605. doi: 10.1110/ps.03168503. [DOI] [PMC free article] [PubMed] [Google Scholar]
- 3.Kamihira M, Vosegaard T, Mason AJ, Straus SK, Nielsen NC, Watts A. Structural and orientational constraints of bacteriorho-dopsin in purple membranes determined by oriented sample solid-state NMR. J. Struct. Biol. 2005;149:7–16. doi: 10.1016/j.jsb.2004.10.002. [DOI] [PubMed] [Google Scholar]
- 4.Cross TA, DiVerdi JA, Opella SJ. Strategy for nitrogen NMR analysis of biopolymers. J. Am. Chem. Soc. 1982;104(6):1759–1761. [Google Scholar]
- 5.Waugh JS. Uncoupling of local field spectra in nuclear magnetic resonance-determination of atomic positions in solids. Proc. Natl. Acad. Sci. USA. 1976;73:1394–1397. doi: 10.1073/pnas.73.5.1394. [DOI] [PMC free article] [PubMed] [Google Scholar]
- 6.Cavanagh J, Fairbrother WJ, Palmer AG, Rance M, Skelton NJ. Protein NMR Spectroscopy: Principles & Practice. second ed. San Diego: Academic Press; 2006. [Google Scholar]
- 7.Castellani F, van Rossum B, Diehl A, Schubert M, Rehbein K, Oschkinat H. Structure of a protein determined by solid-state magic-angle-spinning NMR spectroscopy. Nature. 2002;402:98–102. doi: 10.1038/nature01070. [DOI] [PubMed] [Google Scholar]
- 8.Heise H, Seidel K, Etzkorn M, Becker S, Baldus M. 3D NMR spectroscopy for resonance assignment and structure elucidation of proteins under MAS: Novel pulse schemes and sensitivity considerations. J. Magn. Reson. 2005;173:64–74. doi: 10.1016/j.jmr.2004.11.020. [DOI] [PubMed] [Google Scholar]
- 9.Wand AJ, Bieber RJ, Urbauer JL, McEvog, Gan Z. Carbon relaxation in randomly fractionally 13C-enriched proteins. J. Magn. Reson. B. 1995;108:173–175. doi: 10.1006/jmrb.1995.1119. [DOI] [PubMed] [Google Scholar]
- 10.Kishore AI, Mayer MR, Prestegard JH. Partial 13C isotope enrichment of nucleoside nomophosphatos: useful reporters for NMR structural studies. Nucl. Acid. Res. 2005;33:e164. doi: 10.1093/nar/gni165. [DOI] [PMC free article] [PubMed] [Google Scholar]
- 11.De Angelis AA, Howell SC, Nevzorov A, Opella SJ. Structure determination of a membrane protein with two trans-membrane helices in aligned phospholipid bicelles by solid-state NMR spectros-copy. J. Am. Chem. Soc. 2006;128:12256–12267. doi: 10.1021/ja063640w. [DOI] [PMC free article] [PubMed] [Google Scholar]
- 12.Hong M. Selective and extensive 13C labeling of a membrane protein for solid-state NMR investigation. J. Biomol. NMR. 1999;14:71–74. doi: 10.1023/a:1008334930603. [DOI] [PubMed] [Google Scholar]
- 13.Schneider DM, Tycko R, Opella SJ. High-resolution solid-state triple nuclear magnetic resonance measurement of carbon-13-nitro-gen-15 dipole–dipole couplings. J. Magn. Reson. 1987;73(3):568–573. [Google Scholar]
- 14.Ramanathan KV, Opella SJ. High-resolution solid-state carbon-13-nitrogen-14 and carbon-13-nitrogen-15 heteronuclear correlation spectroscopy. J. Magn. Reson. 1990;86:227–235. [Google Scholar]
- 15.Gu ZT, Opella SJ. Two- and three-dimensional 1H/13C PISEMA experiments and their application to backbone and side chain sites of amino acids and peptides. J. Magn. Reson. 1999;140:340–346. doi: 10.1006/jmre.1999.1825. [DOI] [PubMed] [Google Scholar]
- 16.Gu Z, Opella SJ. Three-dimensional 13C shift/1H-15N coupling/ 15N shift solid-state NMR correlation spectroscopy. J. Magn. Reson. 1999;138:193–198. doi: 10.1006/jmre.1999.1709. [DOI] [PubMed] [Google Scholar]
- 17.Tan WM, Gu Z, Zeri AC, Opella SJ. Solid-state NMR triple-resonance backbone assignments in a protein. J. Biomol. NMR. 1999;13:337–342. doi: 10.1023/a:1008379105545. [DOI] [PubMed] [Google Scholar]
- 18.Sinha N, V Grant C, Rotondi KS, Feduik-Rotondi L, Gierasch LM, Opella SJ. Peptides and the development of double- and triple-resonance solid-state NMR of aligned samples. J. Pept. Res. 2005;65:605–620. doi: 10.1111/j.1399-3011.2005.00262.x. [DOI] [PubMed] [Google Scholar]
- 19.Fung BM, Khitriu AK, Ermolaev K. An improved broadband decoupling sequence for liquid crystals and solids. J. Magn. Res. 2000;142:97–101. doi: 10.1006/jmre.1999.1896. [DOI] [PubMed] [Google Scholar]
- 20.Neeraj Sinha, Grant CV, De Angelis AA, Howell SC, Opella SJ. SPINAL modulated decoupling in high field double- and triple-resonance solid-state NMR experiments on stationary samples. J. Magn. Res. 2005;177:197–202. doi: 10.1016/j.jmr.2005.07.008. [DOI] [PubMed] [Google Scholar]
- 21.Ishii Y, Tycko R. Multidimensional heteronuclear correlation spectroscopy of a uniformly 15N- and 13C-labeled peptide crystal: Toward spectral resolution assignment and structure determination of oriented molecules in solid-state NMR. J. Am. Chem. Soc. 2000;122:1443–1455. [Google Scholar]
- 22.Vosegaard T, Nielsen NC. Towards high-resolution solid-state NMR on large uniformly 15N- and [13C,15N]-labeled membrane proteins in oriented lipid bilayers. J. Biomol. NMR. 2002;22:225–247. doi: 10.1023/a:1014987227285. [DOI] [PubMed] [Google Scholar]
- 23.Pines A, Gibby MG, Waugh JS. Proton-enhanced nuclear induction spectroscopy. A method for high resolution NMR of dilute spins in solids. J. Chem. Phys. 1972;56:1776–1777. [Google Scholar]
- 24.Schaefer J, McKay RA, Stejskal EO. Double-cross-polarization NMR of solids. J. Magn. Res. 1979;34:443–447. doi: 10.1016/0006-291x(79)91726-1. [DOI] [PubMed] [Google Scholar]
- 25.Wu CH, Ramamoorthy A, Opella SJ. High resolution heteronu-clear dipolar solid-state NMR spectroscopy. J. Magn. Reson. A. 1994;109:270–272. [Google Scholar]
- 26.Gan Z. Spin dynamics of polarization spin exchange at the magic angle in multiple spin systems. J. Magn. Reson. 2000;143:136–143. doi: 10.1006/jmre.1999.1971. [DOI] [PubMed] [Google Scholar]
- 27.Thiriot DS, Nevzorov AA, Zagyanskiy L, Wu CH, Opella SJ. Structure of the coat protein in Pf1 bacteriophage determined by solid-state NMR spectroscopy. J. Mol. Biol. 2004;341:869–879. doi: 10.1016/j.jmb.2004.06.038. [DOI] [PubMed] [Google Scholar]
- 28.Cross TA, Frey MH, Opella SJ. Nitrogen-15 spin exchange in a protein. J. Am. Chem. Soc. 1983;105:7471–7473. [Google Scholar]
- 29.Gullion T, Baker DB, Conradi MS. New compensated Carr- Purcell sequence. J. Magn. Reson. 1990;89:479–484. [Google Scholar]
- 30.States DJ, Haberkorn RA, Rubin DJ. A two-dimensional nuclear overhauser experiment with pure absorption in four quadrants. J. Magn. Res. 1982;48:286–292. [Google Scholar]
- 31.Park SH, De Angelis AA, Nevzorov A, Wu CH, Opella SJ. Three-dimensional structure of the transmembrane domain of Vpu from HIV-1 in aligned phospholipid bicelles. Biophys. J. 2006;91:3032–3042. doi: 10.1529/biophysj.106.087106. [DOI] [PMC free article] [PubMed] [Google Scholar]
- 32.Giesen AW, Bae LC, Barrett CL, Chyba JA, Chaykovsky MM, Cheng MC, Murray JH, Oliver EJ, Sullivan SM, Dahlquist FW, Homans SW, Brown JM. Measurement of one-bond 1Hα– 13Cα couplings in backbone-labelled proteins. J. Biomed. NMR. 2001;19:255–260. doi: 10.1023/a:1011298531256. [DOI] [PubMed] [Google Scholar]
- 33.De Angelis AA, Nevzorov AA, Park SH, Howell SC, Mrse AA, Opella SJ. High-resolution NMR spectroscopy of membrane proteins in aligned bicelles. J. Am. Chem. Soc. 2004;127:15340–15341. doi: 10.1021/ja045631y. [DOI] [PubMed] [Google Scholar]
- 34.Morcombe CR, Zilm KW. Chemical shift referencing in MAS solid state NMR. J. Magn. Res. 2003;162:479–486. doi: 10.1016/s1090-7807(03)00082-x. [DOI] [PubMed] [Google Scholar]


