Abstract
Background and Aims
Adenine is a uric acid pathway metabolite of no known function, and has recently been identified as a ligand for a rat G protein-coupled receptor. Due to the known role of other uric acid pathway metabolites in HSC biology, we tested the ability of adenine to induce HSC differentiation.
Methods
RT-PCR was performed for adenine receptor expression in T-6 and primary rat HSC. T-6 and primary rats HSC were cultured with and without adenine, and stellation examined. Next, we examined inhibition of calcium signaling using caged IP3. To test if adenine inhibits HSC chemotaxis T-6 cells and rat HSCs were cultured with or without adenine for 24 h in a transwell assay with PDGF as the chemoattractant. cDNA was prepared from T-6 and primary HSC for quantification of collagen 1 mRNA using real-time PCR.
Results
We found that mRNA for the adenine receptor is expressed in T-6 cells and primary rat HSC. Also, adenine induces HSC stellation and adenine inhibits IP3 mediated increase in cytosolic [Ca2+]i and inhibits chemotaxis in T-6 cells and primary rat HSC. Adenine was also shown to up-regulate α-SMA and collagen 1, and this effect is lost by using specific si-RNA for the adenine receptor. Finally, adenine inhibits endothelin-1-induced gel contraction.
Conclusions
The adenine receptor is present in T-6 cells and primary rats HSC. Adenine, via the adenine receptor, induces morphological change, and cytosolic calcium signaling, inhibits chemotaxis, and up-regulates collagen 1 mRNA in HSCs.
Keywords: Adenine, Stellate cells, Chemotaxis, Differentiation
Introduction
The uric acid pathway is a nucleic acid degradative pathway with increased flux after cell injury and death [1]. The pathway consists of sequential degradation of adenosine mono-phosphate to adenosine, adenine, hypoxanthine, xanthine and finally uric acid. This pathway is of particular interest as adenosine and uric acid are known to have a significant role in adaptation to tissue injury, including regulation of inflammation and fibrosis [1]. Adenine is immediately downstream of adenosine and was not recognized as having any signaling capacity, but a receptor for adenine was recently identified in rat neuronal tissue, and its 3D structure has been predicted [2, 3]. The adenine receptor is a member of the MAS-value gene (Mrg) receptor family, and although the highest expression is in dorsal root ganglia, expression was also found in a wide range of tissues [2]. Due to the important role of adenosine on hepatic stellate cell differentiation, and the recent identification of an adenine receptor, we hypothesized that adenine has the ability to induce HSC differentiation.
HSC have the capacity to undergo a wide range of functional changes in response to paracrine and matrix signals [4]. In this study we show that mRNA for the adenine receptor is expressed in T-6 cells and primary rats HSCs. Adenine induces actin reorganization, and inhibits IP3 mediated increase in cytosolic [Ca2+]i. Furthermore adenine inhibits chemotaxis in T-6 cells and primary rat HSC, and up-regulates α-SMA and collagen 1. This is the first study to report that HSC express the adenine receptor and undergo functional changes in response to adenine. Collectively these data suggest that adenine, along with adenosine, is an important late differentiation signal for HSC.
Methods
Cell Culture and Reagents
T-6 rat HSC cells were cultured in Waymouth MB 752/1 medium supplemented with 10 % FBS and penicillin–streptomycin (100 IU/ml and 100 mg/ml media, respectively) and used after three to six passages [5]. Primary HSCs were cultured in M199, 10 % FBS, penicillin–streptomycin (100 IU/ml and 100 mg/ml media, respectively), 2 % gentamycin, and fungizone in a 1:1,000 density, with a media change 24 h after isolation and then every 3 days. Histodenz, DNase, Pronase, Collagenase, TRIZOL reagent, Fungizone, Trypsin–EDTA, M199, Waymouth MB 752/1, DMEM, HBSS, and F-12 (HAM) were purchased from GIBCO/ Invitrogen (Grand Island, NY, USA). All reagents were of the highest quality grade commercially available.
Animals and HSC Isolation
HSC were isolated from retired breeder rats (500–700 g) by in situ pronase/collagenase perfusion followed by density gradient centrifugation, 9–11 % Nycodenz (Sigma-Aldrich, St. Louis, MO, USA). Primary cells were >95 % pure and were used at days 5–7 after isolation. Male Sprague–Dawley rats (Charles River Breeding Laboratories, Inc., Wilmington, MA, USA) weighing 200–250 g were used throughout this study. All experiments and animal handling were performed according to the Yale University Institutional Animal Care & Use Committee guidelines.
RT-PCR for Expression of Adenine Receptor
Complementary DNA was prepared on day 7 with primary rat HSC and amplified with primers of adenine (5′-CACC ATGGGGGAAAGCTTCACCGGTACAG-3′) (5′-CGGC TC CACCTTGCTGCTTGACATC-3′), and β-actin (5-G TGGGGCGCCCCA GGCACCA-3′) (5′-CTCCTTAATGT CACGCAC GATTTC-3′). The polymerase chain reaction (PCR) was performed with 1 μl of the complementary DNA, 1× buffer, 1 mM MgCl2, 200 μM of each eoxyribonucleotide triphosphate, 2.5 U Taq polymerase, and 0.2 μM of each adenine and β-actin specific primers.
Real-Time PCR for mRNA Expression
T-6 cells and primary rat HSCs were cultured in the presence of adenine (500 μM). Twenty-four hours after culture, complementary DNA was prepared, and quantitative real-time PCR was performed for collagen 1 using commercial primer-probe sets (Applied Biosystems, Framingham, MA, USA) and the Applied Biosystem 7500 real-time PCR system. Expression of glyceraldehyde 3-phosphate dehydrogenase was used to standardize the samples, and the results were expressed as a ratio compared with untreated HSCs.
Chemotaxis Assay
The migration of HSC-T6 cells primary HSCs from rat was studied using transwell inserts equipped with 8-μm pore polycarbonate-free filters as described previously [6]. For the primary HSC, two rats were used per isolation and 2 × 10⁴ HSCs were plated per well. Cells were treated with adenine (500 μM). PDGF or CXCL4 (Sigma Alderich St. Louis, MO, USA) was added to the lower chamber 2 h afterwards. After 24 h, the lower surface of the membrane was stained using hematoxylineosin, photographed, and analyzed. All experiments were repeated in triplicate. For each experimental group, a total of 40 high-power field images were taken. Cells per high-power field were counted, with results expressed as the average number of cells per high-power field. All experiments were performed at least in triplicate. Statistical analysis was performed using the Student t test; a P value less than 0.05 was considered significant.
Western Blotting for α-Smooth Muscle Actin
T-6 cells were cultured with and without adenine. Twenty-four hours later, the protein was extracted from each sample and Western blotting was performed for α-smooth muscle actin (α-SMA; 1: 1,000; Santa Cruz Biotechnology, Santa Cruz, CA, USA) and β-actin (1:1,000; Santa Cruz Biotechnology) using standard techniques. Radiographs were scanned and analyzed using TL100 software from the Total Lab range (Nonlinear Dynamics, Newcastle upon Tyne, UK). Total Lab TL100 can analyze 8/16 bit TIFF format images from HDD files. Statistical analysis was performed using the Student t test; a P value less than 0.05 was considered significant.
Analysis of Intracellular Sensitivity to IP3 via Measurement of Changes in Cytosolic Ca2+ Concentration
T-6 cells were cultured with or without adenine on glass coverslips for 20 min and then incubated with a solution containing 3 M caged IP3 (Alexis Biochemicals), 5 M Fluo-4 (Molecular Probes), 19.7 mM 4-(2-hydroxyethyl)-1-piperazine ethanesulfonic acid, 130 mM NaCl, 5 mM KCl, 1 mM MgSO4, and 1.25 mM CaCl2 for 30 min. These cells were placed in a perfusion chamber on the stage of a Zeiss S10NLO microscope; IP3 was then photoreleased using a custom-built system that couples a mercury lamp to a 1-mm quartz fiber optic cable through a high-speed shutter and filter wheel, while cells were observed using time lapse confocal microscopy.
SiRNA Transfection
Two pre-designed chemically synthesized siRNA molecules against the rat adenine receptor (Ambion, Austin, TX, USA) were tested—Silencer Select siRNA ID # s141233 and s141231, proprietary sequences. Knock-down efficiency following siRNA transfection was assessed by real-time PCR quantification of adenine receptor transcript levels, normalized to GAPDH expression, using TaqMan Gene Expression assays (Ambion, Austin, TX, USA), and controlled with scrambled siRNA (Ambion, Austin, TX, USA). When transfections were performed on cells at 70 % confluence in a 24-well plate format with 2 μL of Lipofectamine 2000 reagent (Invitrogen, Carlsbad, CA, USA) and 7.5 pmol siRNA according to manufacturer’s instructions, s141231 achieved a higher knockdown efficiency (89 ± 5 %) and was therefore used in subsequent experiments. Following transfection, 1.5 % FBS-containing media was added to cells for 48 h to slow growth prior to starving cells until experiments at the 96 h time point.
Statistics
For the chemotaxis experiments, 40 high-power fields were counted, and for each experimental group the average number of cells per high-power field was calculated. The Student t test was performed, with P < 0.05 considered significant. For quantitative real-time PCR, data samples were run in groups of 12 samples each, generating a ratio compared with the control sample.
Results
Adenine Induces Stellation of HSC
Adenine receptor messenger RNA (mRNA) is present in the T-6 HSC line and primary rat HSCs (Fig. 1a). Activation of HSCs is associated with changes in cell shape into a more stellate morphology [4]. HSC usually have a flat, polygonal morphology as shown in primary rat HSC and T-6 HSC cell line by phase contrast (Fig. 1b, d). Twenty-four hours after exposure to adenine, morphological change is seen in both primary rat and T-6 HSC (Fig. 1c, e). Inhibition of the adenine receptor in the T-6 HSC line by siRNA abolishes the ability of adenine to induce stellation of T-6 HSC. There was 89 % knockdown efficiency (±5 %) in two independent experiments, each performed in triplicate. Scrambled control siRNA did not produce statistically significant reductions in AR expression.
Fig. 1.
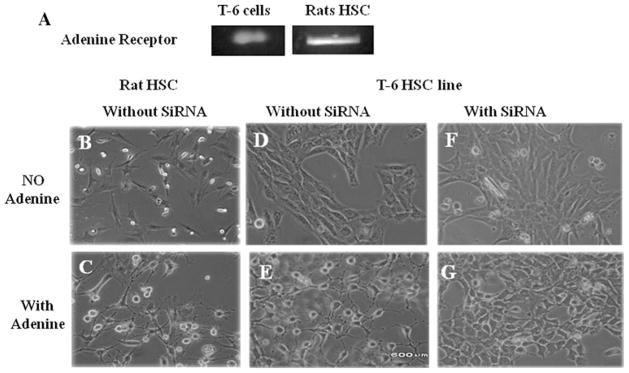
Adenine induces stellation of T-6 cells and primary rat HSCs. a mRNA for the adenine receptor is expressed in the T-6 cell line and in primary rat HSC by RT-PCR. b and d Phase-contrast images of primary rat HSC and T-6 cells in culture showing a flat cuboidal shape. c and e Phase-contrast images of primary rat HSC and T-6 cells after 24 h of exposure to adenine (500 μM) showing stellation. f and g Use of SiRNA specific for the adenine receptor abolishes the ability of adenine to induce HSC stellation. All experiments were repeated at least five times
Adenosine-induced changes on HSC and mesenchymal stem cells are known to require a PKA and Rac pathway [7, 8]. We tested the role of these molecules by using a very specific PKA inhibitor (ST-HT31 at 25 μM) and a Rac-1 inhibitor (NSC23766 at 150 μM). Inhibition of PKA and Rac-1 resulted in the inability of adenine to induce HSC stellation (Fig. 2). To ensure that the stellation was not due to trace contamination of adenine with adenosine we attempted to inhibit it by using the adenosine 2a receptor antagonist (ZM 241385 at a concentration of 10 μM). As can be seen in Fig. 2 this did not result in a decrease in adenine-induced HSC stellation, further confirming the data using adenine receptor specific siRNA.
Fig. 2.
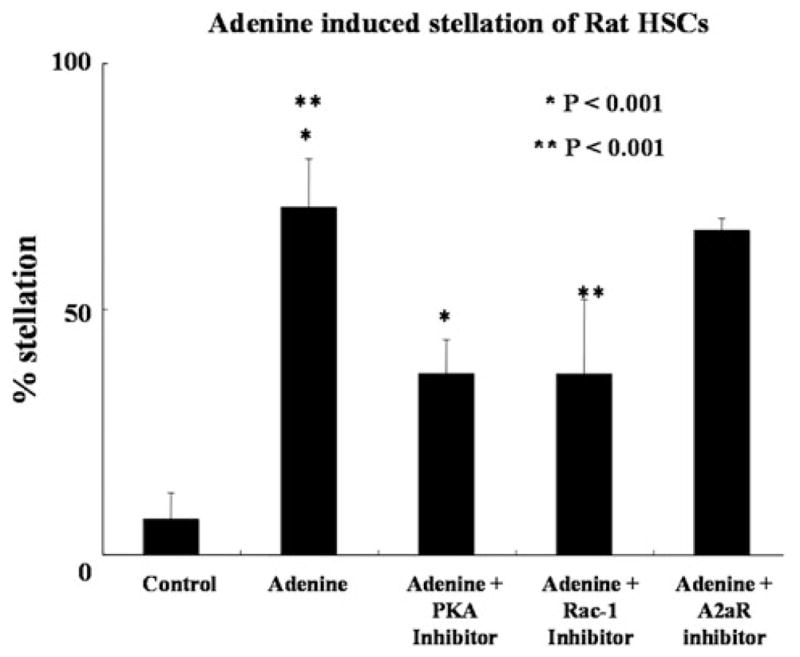
Adenine-induced stellation is dependent on PKA and Rac-1 and is not dependent on the adenosine A2a receptor. The degree of adenine-induced stellation was significantly reduced in the presence of PKA (ST-HT31) and rac-1 (NSC23766) inhibitors. The exposure to a adenosine A2a receptor inhibitor (ZM 241385) did not reduce the ability of adenine to induce stellation. All experiments were repeated at least four times
Adenine Inhibits IP3-Mediated Ca2+ Signaling in HSC
To test the ability of adenine to reduce IP3 mediated Ca++ fluxes, T-6 cells were loaded with the Ca2+ flurophore Fluo-4 and cell-permeant caged IP3 ester (C-iso IP3, Alexis Corp.). They were imaged during uncaging of IP3. In control cells, IP3 uncaging results in a rapid increase in [Ca2+]i, which persists for approximately 30 s (Fig. 3a). In T-6 HSC pretreated with adenine, there was a reduction in [Ca2+]i elevation in response to uncaging IP3. The summarized data show the significant differences between control group and adenine treated group (*P < 0.05; Fig. 3b).
Fig. 3.
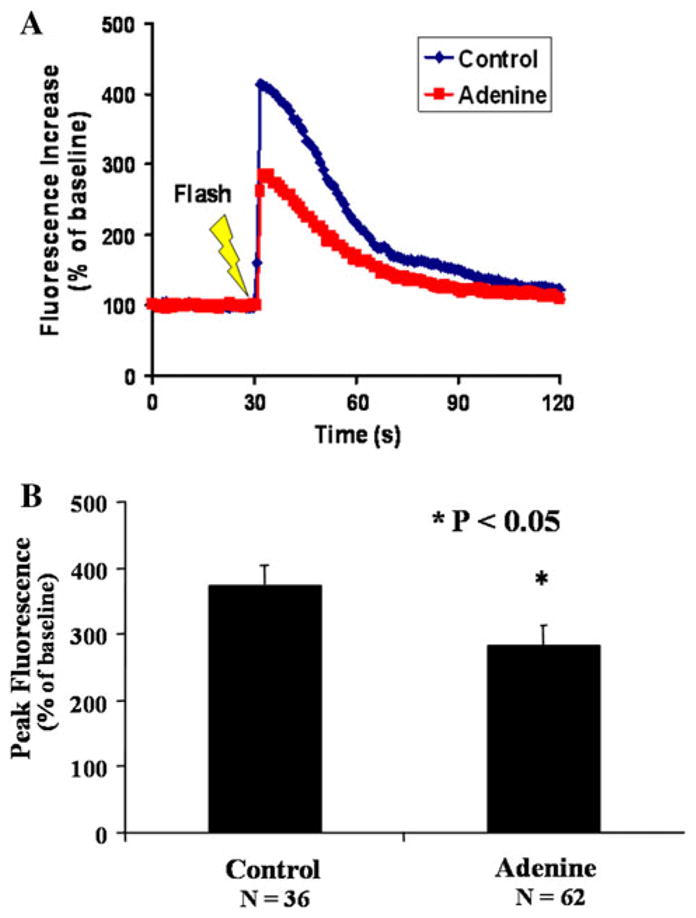
Adenine inhibits IP3-mediated increase in cytosolic [Ca2+]i. a Analysis of the flurophore emission in response to uncaging IP3 shows a rapid increase in cytosolic [Ca2+]i over approximately 5 ms, with a gradual decline over the next 40 ms, as seen in the darker line from a control T-6 cell. Pretreatment of T-6 cells with adenine inhibits the increase in cytosolic [Ca2+]i in response to uncaging IP3 as seen in the lighter line. b Summation of data from control and adenine-treated T-6 cells shows an inhibition of the increase in cytosolic Ca2+ in response to uncaging IP3 (* P < 0.05). Experiment repeated four times
Adenine Inhibits PDGF-Mediated HSC Chemotaxis
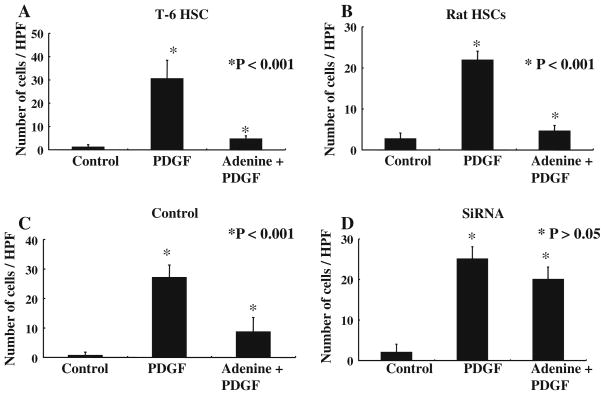
We have shown that adenosine and mammalian DNA, which are produced in areas of cellular apoptosis, inhibit HSC chemotaxis induced by PDGF [9, 10]. We tested if adenine can also inhibit PDGF or CXCL4 mediated chemotaxis using a standard transwell system. Figure 4a shows transwell chemotaxis data for T-6 HSC. PDGF induces chemotaxis of T-6 HSC, and this is significantly inhibited by pretreatment with adenine (*P < 0.001). In an analogous manner CXCL4 induces chemotaxis of T-6 HSC which is also inhibited by adenine (supplementary Fig 1). Primary rat HSC have a very similar response, with adenine inhibiting PDGF-mediated chemotaxis (*P < 0.001; Fig. 4b). To determine the specificity of this response for the adenine receptor, specific siRNA was used. As can be seen in Fig. 4d treatment with specific siRNA almost entirely abolished the ability of adenine to inhibit PDGF-induced chemotaxis.
Fig. 4.
Adenine inhibits PDGF mediated chemotaxis of T-6 cells and primary rat HSC. a Adenine inhibits PDGF mediated chemotaxis of T-6 cells across a transwell (* P < 0.001). b Adenine inhibits PDGF mediated chemotaxis of primary rat HSC (* P < 0.001). c and d The ability of adenine to inhibit chemotaxis is abolished by an adenine receptor specific SiRNA. The control was scrambled siRNA. All experiments were repeated at least five times
Adenine Up-regulates α-SMA Collagen 1 in HSC
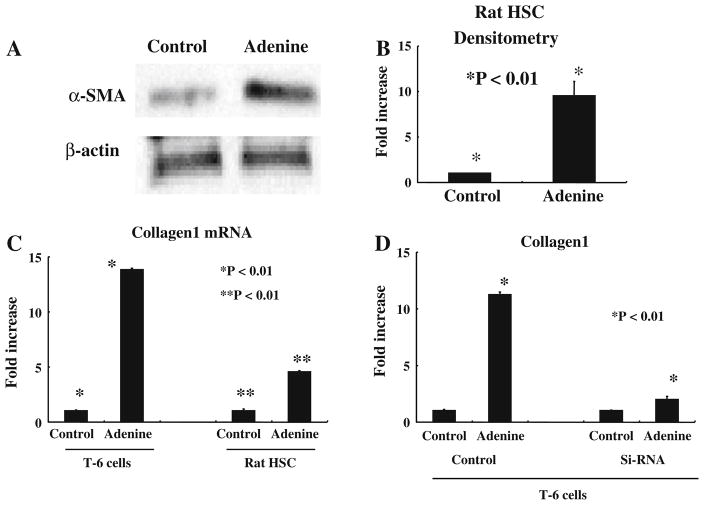
We tested if adenine enhances α-SMA protein levels in primary rat HSC by western blotting. As shown in Fig. 5a and b, adenine significantly up-regulates α-SMA levels compared with the control group (rat HSC α-SMA increased 9.48 times, SD 1.89, *P < 0.05).
Fig. 5.
Adenine up-regulates α-SMA and collagen 1. a and b Adenine up-regulates α-SMA in primary rat HSC. c Adenine increases production of collagen 1 mRNA by T-6 cells and rat HSC (* P < 0.01, ** P < 0.01). d The ability of adenine to up-regulate collagen 1 mRNA is abolished by adenine receptor specific SiRNA (* P < 0.01). All experiments were repeated at least three times
After localization to a site of injury one of the primary functions of HSC is the deposition of matrix components. We tested up-regulation of mRNA for collagen 1 as an indicator of an increase in extracellular matrix deposition. Twenty-four hours after exposure to adenine, the levels of collagen 1 in T-6 and primary HSC were significantly greater than those of controls (T-6 cells increased 14.8 times, SD 0.23; rat HSC increased 4.6 times, SD 0.12; P < 0.01 for both cell types). To further test the specificity of this effect for the adenine receptor specific siRNA was used on T-6 HSC. This demonstrated that in the presence of specific siRNA adenine was unable to up-regulate collagen 1 mRNA (T-6 cells increased 11.4 times, SD 0.17; T-6 cells treated with siRNA increased 2.1 times, SD 0.11 P < 0.01).
Adenine Inhibits Endothelin-1 Mediated HSC Contraction
The ability of adenine to inhibit Ca++ fluxes made us consider that one functional consequence may be loss of the ability to induce contraction. To measure the effect of adenine on the contraction induced by endothelin-1 we used the established assay of hydrated collagen gels [11]. In Fig. 6a, a representative experiment of collagen lattice contraction after 3-h incubation was shown. Figure 6a control shows a gel exposed to control buffer only, resulting in a minimal decrease of the collagen surface area from rim of the well. Adenine caused no significant decrease in surface area of gel compared with control. Endothelin-1 (10 nM) stimulated a decrease in collagen gel surface area within 1 h. Addition of adenine to the collagen gel for 60 min followed by endothelin-1 (10 nM) resulted in significant loss of the gel contraction induced by endo-thelin-1.
Fig. 6.
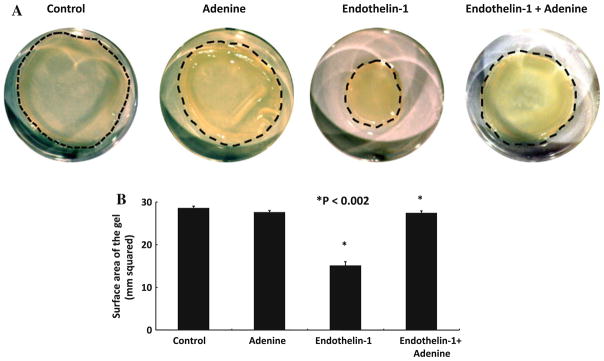
Adenine inhibits endothelin-1-induced gel contraction by HSC. a and b Endothelin-1 induces gel contraction as previously shown. Adenine inhibits the ability of endothelin-1 to induce HSC-induced gel contraction (** P < 0.002). Experiment repeated four times
Discussion
Adenine is one of the metabolites of nucleic acid degradation via the uric acid pathway and is generated from adenosine by purine nucleotide phosphorylase [2]. There is increased flux through this pathway, and an increase in concentration of these metabolites during tissue injury [1]. The association between tissue injury and increase in uric acid pathway metabolite concentrations makes them excellent candidates for co-coordinating adaptive responses to tissue injury. This has been very well characterized for adenosine which signals via four G protein coupled receptors, and induces a wide range of tissue adaptive responses [12]. Recently, adenine has been identified as binding with high affinity and activating a widely expressed orphan rat G protein-coupled receptor belonging to the MAS-value gene (Mrg) receptor family [2]. We have previously shown that adenosine plays an important role in hepatic stellate cells (HSCs) differentiation and inhibition of HSC chemotaxis [9]. We therefore tested if the adenine receptor is expressed on HSC, and is involved in HSC differentiation.
We initially demonstrated expression of adenine in the human T-6 HSC line, and in primary rat HSC (Fig. 1a), which is consistent with the broad expression of this receptor [2]. One characteristic feature of HSC is their response to differentiation stimuli by a change in morphology from a flat fibroblast-like shape to a more angular, or stellate shape [13]. Such a change in morphology is seen with HSC activation by a variety of stimuli including in vitro activation on plastic, and in vivo activation with liver injury. We demonstrate that adenine induces a change in morphology from a flat fibroblast-like shape to an angular stellate shape. This is visible by phase contrast microscopy (Fig. 1b–e). SiRNA to knock down was performed to confirm that this effect was specific for the adenine receptor. The use of siRNA resulted in a loss of the ability of adenine to induce a stellate morphology (Fig. 1g). These changes were quantified, and further confirmation that they were not due to contamination of samples with adenosine was obtained by using an inhibitor of the A2a adenosine receptor (Fig. 2). A very specific PKA inhibitor and a Rac-1 inhibitor were used to confirm the role of cAMP mediated PKA Rac-1 pathway downstream of the adenine receptor. These data are the first demonstration of a functional role for the adenine receptor expressed by HSC.
The increase in cytosolic [Ca2+]i in response to PDGF, endolthelin-1 and a variety of other messengers is mediated by cytoslic IP3 [14]. This results in activation of IP3 receptors on the endoplasmic reticulum (ER) and release of ER Ca++ into the cytosol. We have previously shown that adenosine signaling via the A2a receptor results in inhibition of the secondary messenger IP3 mediated increase in cytosolic [Ca2+]i [9]. We chose to directly increase cytosolic IP3 and test the effect of adenine on the [Ca2+]i response. Directly increasing cytosolic IP3 has advantages over using PDGF or endothelin-1 as it removes the possibility of changes in receptor function as being interpreted as changes in Ca++ signaling machinery. The results from our experiments using photo-release of caged IP3 demonstrate the ability of adenine to inhibit IP3-mediated increase in cytosolic Ca++ (Fig. 3a–b). This finding suggests that adenine receptor activation results in a decrease in IP3R function, as has been previously reported in response to a number of membrane receptors, including cholecystokinin and angiotensin II [15, 16]. IP3 receptors have several phosphorylation sites that can alter the response of IP3 receptors to IP3, and phosphorylation of the IP3 receptor is the most likely mechanism [17].
Activated HSCs are not present randomly within the liver parenchyma in fibrosis, but are typically found in regions of fibrosis [4]. The cellular basis of this localisation is thought to be the ability of HSC to undergo chemotaxis to a range of stimuli including platelet derived growth factor (PDGF) and endothelin-1 [18–20]. We have recently shown that adenosine and apoptotic DNA associated with cellular apoptosis can inhibit PDGF-induced chemotaxis through the A2a and TLR9 receptors, respectively [9, 10]. The ability of signals from cellular apoptosis to inhibit HSC chemotaxis is proposed to provide a stop signal to HSC at sites of cellular apoptosis, allowing HSC to localize. The ability of adenine to inhibit IP3 mediated increase in cytosolic [Ca2+]i made us speculate that it may also inhibit chemotaxis. Figure 4a and b show that adenine did inhibit PDGF-induced chemotaxis, and this was dependent on the adenine receptor as demonstrated by the ability of specific siRNA to disrupt it.
HSC have been demonstrated to acquire a wide range of functions in response to a range of stimuli. These functions include proliferation, chemotaxis, contraction, matrix remodeling and immune regulation [4]. We propose that these are not sequentially acquired as HSC undergo activation, but rather there is also selective loss of function. For example, it is not feasible for a cell to be simultaneously undergoing cell cycle, chemotaxis and contraction. From the above data we propose that HSC, on reaching the site of tissue injury, encounter high levels of adenine molecules which provide a stop signal. One prediction of this is that upon stopping and localizing HSC will up-regulate matrix deposition. This is exactly what we found by examining α-SMA levels by western blot and collagen mRNA levels by quantitative PCR. These data are entirely consistent with data on liver slices which demonstrate the ability of the related molecule adenosine to up-regulate collagen production [21].
Finally we tested the ability of adenine to functionally impair HSC contraction using the established gel contraction system. Adenine-induced inhibition of cytosolic [Ca2+]i predicts that HSC contraction will be impaired. As can be seen from Fig. 6 endothelin-1 is able to induce a significant contraction. Adenine by itself has no effect but significantly inhibits the ability of endothelin-1 to induce contraction.
We have demonstrated the presence of the newly identified adenine receptor on HSC and further demonstrated a range of functional consequences for HSC of receptor activation. Collectively these functional changes point toward the adenine receptor having a role relatively late in HSC differentiation, at a stage after initial activation, proliferation and chemotaxis. After engagement the adenine receptor inhibits Ca++ fluxes and chemotaxis, producing a stationary, stellate and collagen producing HSC phenotype.
Supplementary Material
Acknowledgments
This work was supported by NIH R01DK076674-01A2 and VA Merit Award (WZM).
Abbreviations
- HSC
Hepatic stellate cells
- RT-PCR
Reverse transcriptase polymerase chain reaction
- TGF-β
Transforming growth factor beta
- PDGF
Platelet derived growth factor
- α-SMA
Alpha-smooth muscle actin
- MSU
Monosodium urate
- c-AMP
Cyclic adenosine monophosphate
Footnotes
Electronic supplementary material
The online version of this article (doi:10.1007/s10620-012-2183-7) contains supplementary material, which is available to authorized users.
Conflict of interest
None of the authors have a conflict of interest.
Contributor Information
Azuma Watanabe, Email: azuma.watanabe@hotmail.com, Section of Digestive Diseases, Yale University, 1080 LMP, PO Box. 208019, New Haven, CT 06520-8019, USA.
Muhammad Adnan Sohail, Email: adnanke@gmail.com, Section of Digestive Diseases, Yale University, 1080 LMP, PO Box. 208019, New Haven, CT 06520-8019, USA.
Samir Gautam, Email: samir.gautam@yale.edu, Section of Digestive Diseases, Yale University, 1080 LMP, PO Box. 208019, New Haven, CT 06520-8019, USA.
Dawidson Assis Gomes, Email: dawidson@icb.ufmg.br, Department of Biochemistry and Immunology, Federal University of Minas Gerais, Belo Horizonte, Brazil.
Wajahat Zafar Mehal, Email: wajahat.mehal@yale.edu, West Haven VA Medical Center, West Haven, CT, USA. Section of Digestive Diseases, Yale University, 1080 LMP, PO Box. 208019, New Haven, CT 06520-8019, USA.
References
- 1.Martinon F. Update on biology: uric acid and the activation of immune and inflammatory cells. Curr Rheumatol Rep. 2010;12:135–141. doi: 10.1007/s11926-010-0092-3. [DOI] [PubMed] [Google Scholar]
- 2.Bender E, Buist A, Jurzak M, et al. Characterization of an orphan G protein-coupled receptor localized in the dorsal root ganglia reveals adenine as a signaling molecule. Proc Natl Acad Sci USA. 2002;99:8573–8578. doi: 10.1073/pnas.122016499. [DOI] [PMC free article] [PubMed] [Google Scholar]
- 3.Heo J, Vaidehi N, Wendel J, Goddard WA., III Prediction of the 3-D structure of rat MrgA G protein-coupled receptor and identification of its binding site. J Mol Graph Model. 2007;26:800–812. doi: 10.1016/j.jmgm.2007.07.003. [DOI] [PMC free article] [PubMed] [Google Scholar]
- 4.Friedman SL. Mechanisms of hepatic fibrogenesis. Gastroenterology. 2008;134:1655–1669. doi: 10.1053/j.gastro.2008.03.003. [DOI] [PMC free article] [PubMed] [Google Scholar]
- 5.Vogel S, Piantedosi R, Frank J, et al. An immortalized rat liver stellate cell line (HSC-T6): a new cell model for the study of retinoid metabolism in vitro. J Lipid Res. 2000;41:882–893. [PubMed] [Google Scholar]
- 6.Gentilini A, Marra F, Gentilini P, Pinzani M. Phosphatidylinositol-3 kinase and extracellular signal-regulated kinase mediate the chemotactic and mitogenic effects of insulin-like growth factor-I in human hepatic stellate cells. J Hepatol. 2000;32:227–234. doi: 10.1016/s0168-8278(00)80067-7. [DOI] [PubMed] [Google Scholar]
- 7.Sohail MA, Hashmi AZ, Hakim W, et al. Adenosine induces loss of actin stress fibers and inhibits contraction in hepatic stellate cells via rho inhibition. Hepatology. 2009;49:185–194. doi: 10.1002/hep.22589. [DOI] [PMC free article] [PubMed] [Google Scholar]
- 8.Mohamadnejad M, Sohail MA, Watanabe A, Krause DS, Swenson ES, Mehal WZ. Adenosine inhibits chemotaxis and induces hepatocyte-specific genes in bone marrow mesenchymal stem cells. Hepatology. 2010;51:963–973. doi: 10.1002/hep.23389. [DOI] [PMC free article] [PubMed] [Google Scholar]
- 9.Hashmi AZ, Hakim W, Kruglov EA, et al. Adenosine inhibits cytosolic calcium signals and chemotaxis in hepatic stellate cells. Am J Physiol Gastrointest Liver Physiol. 2007;292:G395–G401. doi: 10.1152/ajpgi.00208.2006. [DOI] [PMC free article] [PubMed] [Google Scholar]
- 10.Watanabe A, Hashmi A, Gomes DA, et al. Apoptotic hepatocyte DNA inhibits hepatic stellate cell chemotaxis via toll-like receptor 9. Hepatology. 2007;46:1509–1518. doi: 10.1002/hep.21867. [DOI] [PubMed] [Google Scholar]
- 11.Racine-Samson L, Rockey DC, Bissell DM. The role of alpha1beta1 integrin in wound contraction. A quantitative analysis of liver myofibroblasts in vivo and in primary culture. J Biol Chem. 1997;272:30911–30917. doi: 10.1074/jbc.272.49.30911. [DOI] [PubMed] [Google Scholar]
- 12.Trincavelli ML, Daniele S, Martini C. Adenosine receptors: what we know and what we are learning. Curr Top Med Chem. 2010;10:860–877. doi: 10.2174/156802610791268756. [DOI] [PubMed] [Google Scholar]
- 13.Reeves HL, Friedman SL. Activation of hepatic stellate cells—a key issue in liver fibrosis. Front Biosci. 2002;7:d808–d826. doi: 10.2741/reeves. [DOI] [PubMed] [Google Scholar]
- 14.Dawson AP. Calcium signalling: how do IP3 receptors work? Curr Biol. 1997;7:R544–R547. doi: 10.1016/s0960-9822(06)00277-6. [DOI] [PubMed] [Google Scholar]
- 15.Bokkala S, Joseph SK. Angiotensin II-induced down-regulation of inositol trisphosphate receptors in WB rat liver epithelial cells. Evidence for involvement of the proteasome pathway. J Biol Chem. 1997;272:12454–12461. doi: 10.1074/jbc.272.19.12454. [DOI] [PubMed] [Google Scholar]
- 16.Wojcikiewicz RJ, Ernst SA, Yule DI. Secretagogues cause ubiquitination and down-regulation of inositol 1, 4,5-trisphosphate receptors in rat pancreatic acinar cells. Gastroenterology. 1999;116:1194–1201. doi: 10.1016/s0016-5085(99)70023-5. [DOI] [PubMed] [Google Scholar]
- 17.Malathi K, Kohyama S, Ho M, et al. Inositol 1,4,5-trisphosphate receptor (type 1) phosphorylation and modulation by Cdc2. J Cell Biochem. 2003;90:1186–1196. doi: 10.1002/jcb.10720. [DOI] [PubMed] [Google Scholar]
- 18.Kinnman N, Hultcrantz R, Barbu V, et al. PDGF-mediated chemoattraction of hepatic stellate cells by bile duct segments in cholestatic liver injury. Lab Invest. 2000;80:697–707. doi: 10.1038/labinvest.3780073. [DOI] [PubMed] [Google Scholar]
- 19.Pinzani M. PDGF and signal transduction in hepatic stellate cells. Front Biosci. 2002;7:d1720–d1726. doi: 10.2741/A875. [DOI] [PubMed] [Google Scholar]
- 20.Marra F, Romanelli RG, Giannini C, et al. Monocyte chemotactic protein-1 as a chemoattractant for human hepatic stellate cells. Hepatology. 1999;29:140–148. doi: 10.1002/hep.510290107. [DOI] [PubMed] [Google Scholar]
- 21.Chan ES, Montesinos MC, Fernandez P, et al. Adenosine A(2A) receptors play a role in the pathogenesis of hepatic cirrhosis. Br J Pharmacol. 2006;148:1144–1155. doi: 10.1038/sj.bjp.0706812. [DOI] [PMC free article] [PubMed] [Google Scholar]
Associated Data
This section collects any data citations, data availability statements, or supplementary materials included in this article.


