Abstract
Chemical Exchange Saturation Transfer (CEST) and Magnetization Transfer (MT) techniques provide unique and potentially quantitative contrast mechanisms in multiple MRI applications. However, the in vivo implementation of these techniques has been limited by the relatively slow MRI acquisition techniques, especially on high field MRI scanners. A new, rapid CEST-FISP (CEST - Fast Imaging with Steady-state free Precession) technique was developed to provide sensitive CEST contrast in approximately 20 seconds. In this study at 7T with in vitro bovine glycogen samples and initial in vivo results in a rat liver, the CEST-FISP technique was shown to provide equivalent CEST sensitivity in comparison to a conventional CEST spin echo acquisition with a 50-fold reduction in acquisition time. The sensitivity of the CEST-FISP technique was also shown to be dependent on k-space encoding with centric k-space encoding providing a 30–40% increase in CEST sensitivity relative to linear encoding for 256 or more k-space lines. Overall, the CEST-FISP acquisition technique provides a rapid and sensitive imaging platform with the potential to provide quantitative CEST and MT imaging data.
INTRODUCTION
Saturation transfer techniques have been utilized for NMR Spectroscopy for many decades (1,2). Recently, Chemical Exchange Saturation Transfer (CEST) techniques have emerged in the MRI field to provide unique contrast mechanisms such as Amide Proton Transfer (APT) (3,4), GlycoCEST (5), and GAG-CEST (6), to quantitatively assess physiologic parameters. In addition, exogenous Paramagnetic CEST (ParaCEST) agents have also been developed to provide highly selective MRI signals (7,8). Typical (Para)CEST MRI acquisition techniques are very similar to conventional Magnetization Transfer MRI (MT-MRI) techniques that combine off-resonance radiofrequency saturation pulses with a conventional MRI acquisition (5,9).
One major limitation for the utility of CEST and MT techniques for in vivo imaging applications is their overall susceptibility to artifacts and inaccuracies caused by both B0 and B1 inhomogeneities. These problems are exacerbated on high field MRI scanners (≥3T) where many quantitative CEST / MT studies are conducted (10). Both empirical and theoretical models have been proposed to overcome these limitations (11,12). However, the majority of these models require multiple image acquisitions with varying B1 and off-resonance saturation frequency resulting in excessive acquisition times of 1–3 hours using conventional MRI pulse sequences (11,12). To reduce the overall acquisition time needed for effective quantification, rapid MRI acquisition techniques such as RARE (number of echoes ≥ 16) (9) and Echo-Planar Imaging (EPI) have been combined with CEST/ MT pulse schema (13). Unfortunately, RARE acquisitions suffer from increased SAR (Specific Absorption Rate) and unintended saturation (14) while EPI acquisitions exhibit significant image artifacts associated with eddy current and off-resonance spins (15).
Here, we describe a new, rapid CEST / MT acquisition technique, CEST-FISP, which combines a flexible CEST preparation period followed by a single-shot FISP (Fast Imaging with Steady-state free Precession) acquisition (16,17). In this initial description, we describe the implementation of this technique to quantitatively assess the CEST effect of in vitro bovine glycogen samples. We also include preliminary in vivo CEST-FISP results from a Sprague-Dawley rat liver. This new acquisition has the potential to reduce the acquisition time of quantitative CEST / MT experiments by a factor of 10–100 with substantially reduced artifacts in comparison to EPI.
MATERIALS AND METHODS
CEST-FISP Pulse Sequence Design
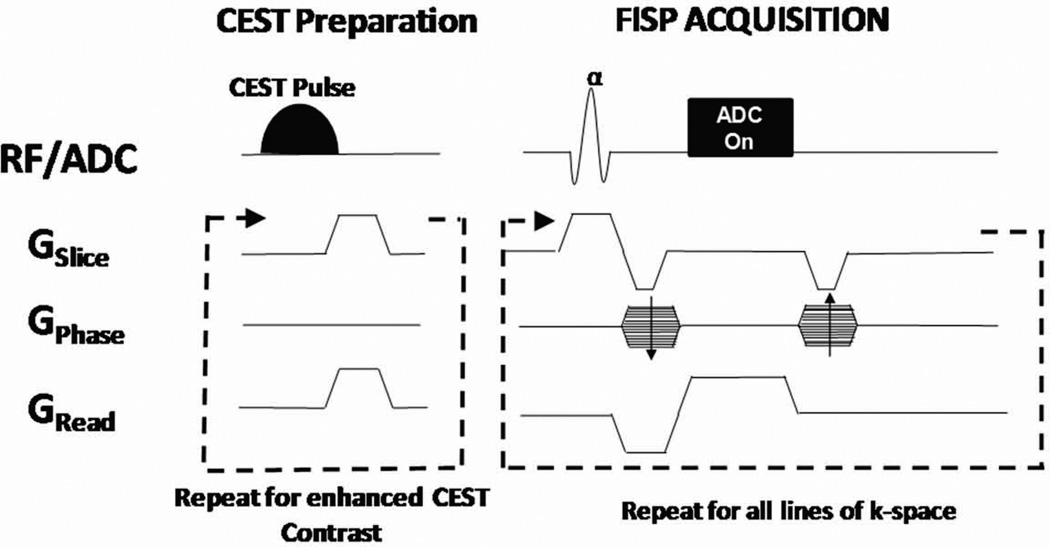
A CEST-FISP pulse sequence was developed on a Bruker Biospec 7.0T MRI scanner (Bruker Biospin, Billerica, MA) by combining a train of spectrally-selective CEST excitation pulses with a FISP acquisition scheme (Figure 1). The CEST preparation was developed with a train of 120 spectrally-selective Gaussian saturation pulses (BWRF = 75 Hz, TauRF = 36 ms). Gradient spoilers were applied following each CEST pulse to avoid unintended buildup of transverse magnetization. These conditions resulted in a total CEST preparation period of approximately 5 seconds immediately prior to the imaging readout (18). This CEST pulse train was developed to provide a flexible CEST preparation sensitive to glycogen exchange in order to evaluate the fundamental characteristics of the CEST-FISP technique. As such, this CEST preparation was not optimized for this specific application.
Figure 1.
Schematic of CEST-FISP sequence. The CEST-FISP acquisition combines a single, independently configurable CEST preparation consisting of a series of spectrally-selective CEST pulses with a rapid FISP readout. The FISP readout is typically implemented with centric phase encoding to maximize CEST sensitivity.
The CEST preparation above was coupled with a conventional FISP acquisition to acquire all lines of k-space following a single CEST preparation. A FISP acquisition was used instead of a True FISP acquisition to avoid well-known banding artifacts resulting from B0 inhomogeneities at 7.0T (16,17). For all in vitro experiments, the imaging parameters were FISP Repetition Time = 2ms, echo time = 1 ms, matrix = 128×92, FOV = 6×4 cm, slice thickness = 2 mm (single-slice), flip angle = 60°, and readout bandwidth = 600 kHz. Ten dummy scans were utilized to limit artifacts from the approach to steady-state. The total duration of the dummy scans was < 30ms and centric encoding was implemented for the FISP acquisition to minimize the loss of CEST sensitivity following the CEST preparation.
Acquisition and Analysis of CEST-FISP Z-Spectra
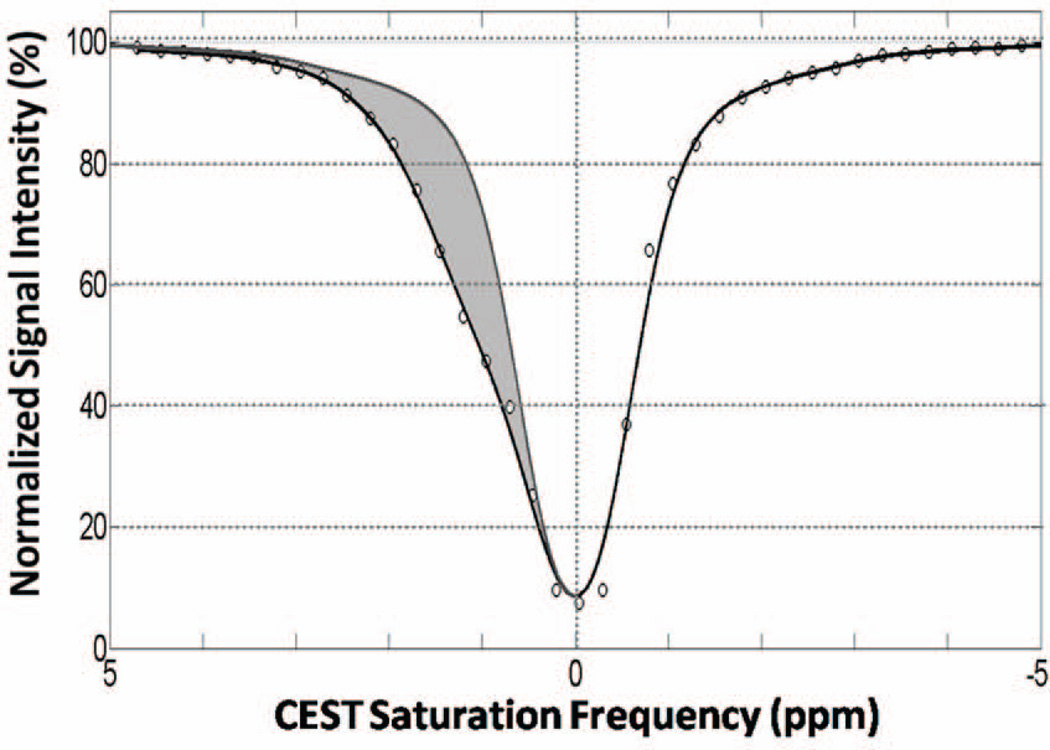
For each in vitro experiment below, the CEST-FISP acquisition was used to acquire a series of 41 transverse images by varying the center-frequency of the CEST pulse train from −5 to 5ppm in 0.25 ppm increments. An additional delay of 15 seconds between scans was required in this implementation for the Bruker Biospec scanner software (Paravision 4.0, Bruker Biospin, Billerica, MA) to run consecutive scans. This delay also ensured complete longitudinal relaxation prior to subsequent CEST preparations. CEST z-spectra were obtained for each glycogen solution by first drawing a circular ROI in each of the solutions for each CEST-FISP image. The data were then normalized to 0–100% by dividing each CEST-FISP image by the −5ppm CEST-FISP image (no CEST effect) as typical. This methodology is illustrated in Figure 2. A smoothed-splines algorithm previously described was then used to model z-spectra (Fig. 2, solid line). (19,20) The smoothed-splines fit results were then used to correct for B0 inhomogeneities by assigning the z-spectra minimum to 0 ppm (water resonance). The detected CEST effect at each saturation frequency was then calculated from Equation 1 below.
| [1] |
The cumulative CEST effect for each glycogen sample was then calculated by numerically integrating CEST Effect (ω) from 0–3 ppm (Fig. 2, shaded region). As shown by our group and later by others, this integration technique allows for a more comprehensive evaluation of CEST effect than single-point CEST effects evaluations. (20,21) Herein, the cumulative CEST effect is described as CEST Asymmetric Area.
Figure 2.
Representative CEST z-spectra and analysis. Normalized signal intensity data from a selected region of interest is shown in the open circles along with the smoothing spline fit (solid line). The net CEST effect is determined by comparing the asymmetry in the modeled z-spectra (shaded region) and is integrated as the CEST Asymmetry Area.
In Vitro Evaluation of CEST-FISP Acquisition with Glycogen CEST (GlycoCEST)
To evaluate the sensitivity of the CEST-FISP acquisition, we performed a series of experiments with in vitro samples of bovine glycogen, whose CEST properties have been previously established (5). Bovine glycogen powder (Sigma Aldrich) was dissolved in Phosphate Buffered Saline solution (PBS, pH=7.4) to provide samples with a range of glycogen concentrations: 0 (water), 25, 50, 75, 100, and 150 mM glucosyl units (5). Each solution was placed in a 15-ml centrifuge tube for scanning along with a PBS sample as a control (T1 for PBS ~1 second, data not shown). These glycogen samples were then bundled together and aligned axially at isocenter in a 7T MRI scanner. A 72 mm diameter volume coil was used for excitation and signal detection to limit the effects of B1 variation on these in vitro experiments. CEST-FISP images were then acquired and z-spectra generated for all of the glycogen samples with incremental changes in CEST saturation power (B1 = 1, 2, 5, 10, and 20 µT). These scans were repeated 5 times to assess the overall variability in the technique.
CEST-FISP Sensitivity: Centric vs Linear Encoding
We repeated the CEST-FISP in vitro glycogen experiments at B1 = 2 µT and a single glycogen sample (100 mM). In this experiment, both linearly and centrically encoded CEST-FISP images were obtained with increasing number of k-space lines (64, 128, 256, 512). All other parameters including readout bandwidth and resolution were kept constant. CEST Asymmetric Areas were obtained for each CEST z-spectra as described above.
CEST-FISP Sensitivity: Comparison with Spin Echo CEST
A CEST-Spin Echo acquisition (CEST-SE, TR/TE=12000/8ms) was also developed to benchmark the sensitivity of the CEST-FISP acquisition technique. In theory, this CEST-SE acquisition in acquiring a single line of k-space following each identical CEST preparation provides the highest possible CEST sensitivity for a given CEST preparation. Therefore, the CEST-SE provided a “gold-standard” for CEST sensitivity comparison, albeit with a greatly expanded acquisition time (85×128 matrix, 17 min/image). Z-spectra were obtained for centric CEST-FISP and conventional CEST-SE acquisitions (B1 = 5 µT). The experiments were repeated 3 times for statistical comparison. Mean CEST Asymmetric Areas were obtained for each glycogen sample as described above. The signal-to-noise ratio was also measured in the PBS sample (SNR = µPBS / σbackground) for the CEST-FISP and CEST-SE images at 5 ppm to determine the relative SNR / time of each acquisition.
Initial In Vivo CEST-FISP Results: Sprague-Dawley Rat Liver
We also obtained in vivo CEST-FISP imaging data from a liver in a 10-week old male Sprague-Dawley rat. The animal was anesthetized with 2–3% isoflurane and positioned at isocenter in the 7T MRI scanner. A 72-mm diameter volume coil was used for both excitation and signal detection. The animal’s respiration rate (50 ± 10 breaths / minute) and core body temperature (35 ± 2 °C) were maintained within typical imaging ranges.
Following localizer scans for accurate positioning, the CEST-FISP acquisition was used to acquire data for the z-spectra. Similar to the in vitro experiments, the CEST preparation was designed with a ~5-second CEST pulse train (300 Gaussian pulses, BWRF = 300Hz (1ppm), peak B1 amplitude = 5 µT). The FISP acquisition was designed to acquire a single coronal slice ((FISP Repetition Time = 3 ms, echo time = 1.5 ms, FOV = 12 cm×6 cm, matrix=128×128, TH=2 mm, α=60°). We acquired 13 coronal images from the single slice by varying the center frequency of the CEST pulse train (10, 5, 4, 3, 2, 1, 0, −1, −2, −3, −4, −5, −10 ppm). An additional CEST-FISP image was acquired at 90ppm as a reference (no discernable CEST saturation). The frequency sweep was repeated five times and retrospectively gated to generate a single data set with no discernable respiration motion artifacts. An in vivo CEST z-spectra was obtained from an ROI analysis of the animal’s liver using the same method as in the in vitro experiments.
RESULTS
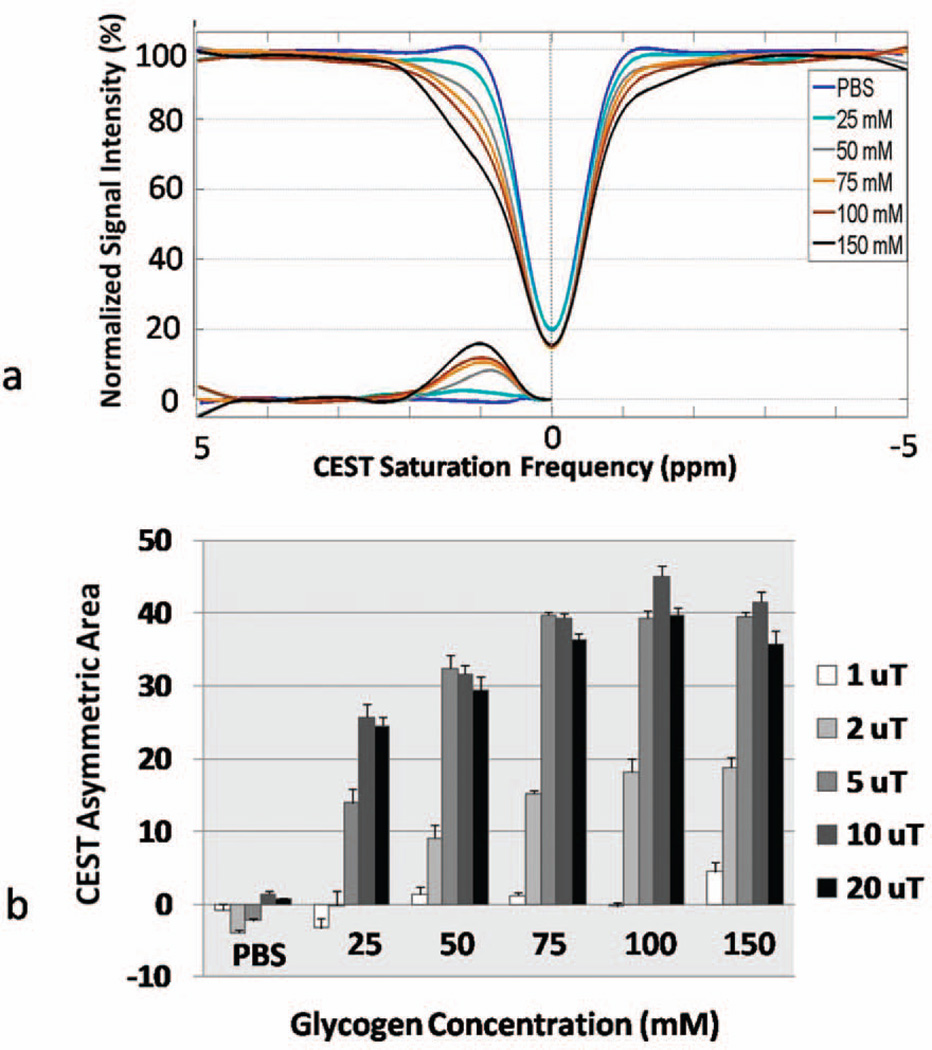
In vitro CEST-FISP z-spectra for all glycogen samples for B1 = 2 µT are shown in Figure 3a. As expected, the CEST effect (~1ppm saturation frequency) increases as a function of glycogen concentration. The modeled CEST Effect (Eq. 1) is also plotted as a function of CEST saturation frequency for each glycogen solution. Integration of the CEST Effect from 0–3 ppm were calculated and are shown in Figure 3b for all glycogen samples and all CEST saturation peak amplitudes (B1 = 1–20 µT). The CEST Asymmetric Area were repeatable (standard error bars are shown in Fig. 3b) and increased with both peak B1 amplitude and glycogen concentration as expected.
Figure 3.
CEST-FISP analysis results of in vitro glycogen samples and a PBS control including (a) z-spectra for B1=2µT and (b) mean CEST Asymmetric Area as a function of B1. The CEST-FISP technique is reliably sensitive to both glycogen concentration as well CEST saturation power (B1).
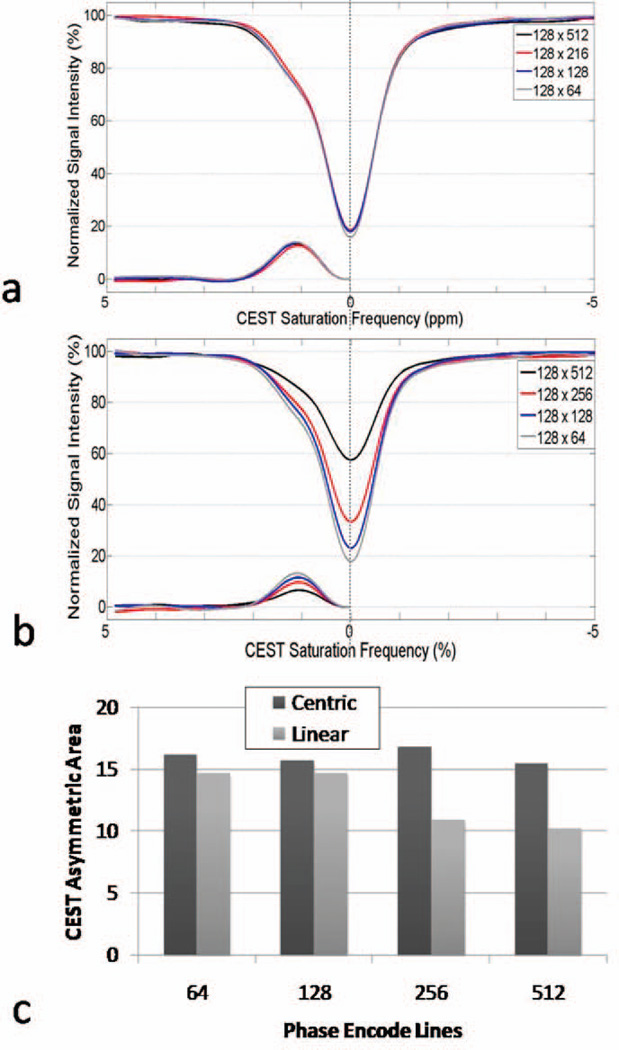
A comparison of linear and centric CEST-FISP results with a 100 mM glycogen sample is shown in Figure 4. As the number of phase encoding lines increased, the centric CEST-FISP z-spectra showed no discernable difference in CEST effect for a 100 mM glycogen sample (Fig. 4a). At the same time, the linearly encoded CEST-FISP acquisition demonstrated a significant decrease in overall saturation and CEST effect with increasing k-space lines (Fig. 4b). Similarly, the CEST Asymmetric Area measurements from these experiments demonstrated a ~30–40% decrease in CEST sensitivity for linear encoding for ≥256 phase encode lines (Fig. 4c).
Figure 4.
CEST Z-spectra obtained from in vitro 100mM bovine glycogen sample using either (a) centric encoding or (b) linear encoding. Quantitative CEST Asymmetric Areas for both encoding schema are shown in (c). Centric encoding provided remarkably consistent results across all phase resolutions while the direct saturation level and net CEST effect were visibly decreased for linear encoding at higher phase resolution (≥ 256 lines).
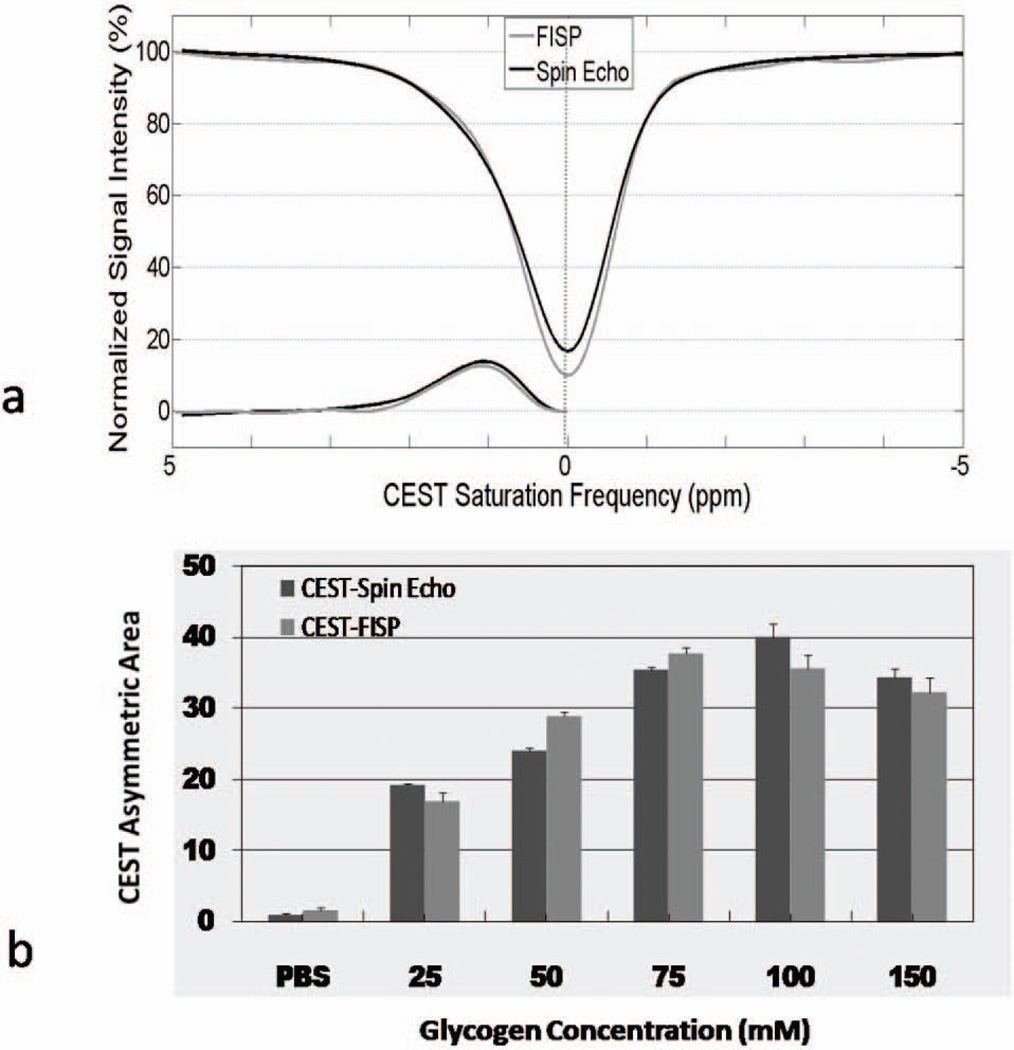
The sensitivity of the rapid CEST-FISP technique (tacq = 20.5 sec) was compared with a conventional CEST-spin echo acquisition (CEST-SE, tacq = 17 min) for the glycogen samples (Figure 5). Representative z-spectra for the 25 mM glycogen sample (Fig. 5a) showed similar CEST sensitivity for both the CEST-FISP and the CEST-SE acquisitions. This generally equivalent CEST sensitivity was obtained with a factor of 50 reduction in acquisition time. At the same time, an ROI analysis confirmed that the signal-to-noise ratio (SNR) in the CEST-FISP images was decreased by a factor of four. The CEST Asymmetric Area results are shown for both acquisitions as a function of glycogen concentration in Fig. 5b. Both acquisitions show similar B1 dependence and CEST sensitivity across all glycogen concentrations.
Figure 5.
A comparison of rapid CEST-FISP and CEST-SE acquisitions shows comparable CEST sensitivity results for both (a) z-spectra and (b) CEST areas. Note the progressively increasing CEST Asymmetric Area as a function of glycogen concentration for both acquisitions.
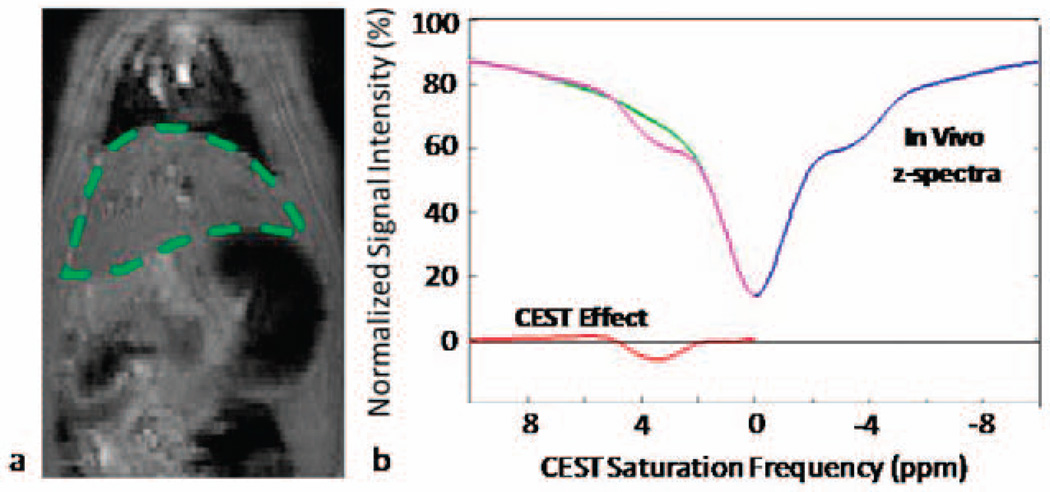
The rapid CEST-FISP scans resulted in reasonable in vivo image quality (Figure 6a). Retrospective respiratory gating removed nearly all motion artifacts providing a high quality in vivo z-spectra of the animal’s liver (Fig. 6b). The in vivo spectra consists of the blue line (negative saturation frequencies) and green lines (positive saturation frequencies). The pink line in the z-spectra is the mirror image of the blue line obtained from the analysis. Our smoothing splines analysis of the in vivo CEST imaging data revealed an asymmetry centered at −3.5ppm (blue line). This asymmetry resulted in a saturation of hepatic lipids at −3.5ppm and / or Nuclear Overhauser Effects (NOE). However, no glycogen CEST effect was observed in this preliminary in vivo experiment.
Figure 6.
Preliminary in vivo CEST-FISP results. (a) Representative coronal CEST-FISP image of a 3-month old male Sprague-Dawley rat. (b) CEST-FISP z-spectra results of rat liver (green ROI in (a)). A negative CEST effect is observed at 3–5 ppm due to the large asymmetry observed in the z-spectra (blue and green lines) most likely due to direct suppression of liver lipids.
DISCUSSION
We have developed a novel and sensitive CEST acquisition technique that combines a single CEST preparation followed by a rapid FISP readout. This new technique, CEST-FISP, is ideally suited for high field MRI applications and is capable of providing quantitative (Para)CEST images in ~5 seconds with inherently less artifacts than conventional EPI readouts. In this initial report, we have evaluated the sensitivity of the CEST-FISP technique with the use of in vitro bovine glycogen samples, whose CEST properties have been described previously by others (5), and with a preliminary in vivo study of a rat liver.
The rapid CEST-FISP acquisition allows multiple CEST-weighted images to be acquired within just a few minutes. The acquisition of multiple images provides quantitative z-spectra, which may be used to correct for B0 and/or B1 heterogeneity. Other applications of this methodology would be for quantitative assessments of exchange rates and ParaCEST agent concentration. And as shown with our initial in vivo results in a rat liver, the CEST-FISP technique is applicable for in vivo imaging studies. Further, since the CEST-FISP technique completely decouples the CEST preparation from the imaging readout, the CEST preparation can be tailored to practically any field strength and Magnetization Transfer / CEST application. Therefore, the CEST-FISP platform provides the basis for eventual translation of endogenous and exogenous CEST applications not only for preclinical studies, but also eventually to the clinic. However, use on human 7T MRI scanners may require adjustments to the CEST preparation scheme, the FISP pulse sequence, and/or the intra-scan delay time to account for SAR restrictions.
The FISP acquisition provides a rapid imaging readout that is a substantial improvement over EPI, especially at high field scanners where both eddy current and ghosting artifacts are extremely problematic. In addition, the FISP acquisition combines many of the advantages of both True FISP and FLASH acquisitions. FISP provides a short echo time (1–2 ms) to limit susceptibility-induced T2* decay like True FISP. The FISP acquisition also only partially rebalances the gradients prior to the next excitation pulse (i.e., only in phase encode direction). This eliminates the off-resonance banding artifacts associated with the True FISP acquisition while still providing a reduced acquisition time in comparison to a FLASH acquisition, which is somewhat compromised by increased T1 relaxation times at high field.
For CEST applications, the main advantage of the FISP acquisition is a very short repetition time (FISP Repetition Time = 2 ms), which results in closely packed echoes following the CEST preparation. These rapid echoes, in addition to the centric k-space encoding, result in minimal relaxation between the end of the CEST preparation and the acquisition of the central lines of k-space. This results in little or no loss of CEST sensitivity in comparison to spin echo acquisitions as shown in Figure 5. For these same reasons, the CEST-FISP acquisition would be expected to provide improved CEST sensitivity in comparison to RARE acquisitions using longer echo trains (nechoes ≥ 8). RARE acquisitions also suffer from increased RF deposition (SAR) and the potential for unintentional CEST/MT effects from multiple refocusing pulses.
Our initial results also confirmed that the CEST-FISP technique is capable of providing quantitative in vivo results (Figure 6). While no glycogen CEST effect was observed in this initial experiment, the CEST-FISP z-spectra did reveal an asymmetry at −3ppm to −5ppm most likely due to direct saturation liver lipids and / or Nuclear Overhauser effects. In vivo detection of glycogen (hepatic or muscular), or other endogenous CEST effects, may first require the elimination of this asymmetry from the z-spectra via known methods (22–24), which can be incorporated into the CEST-FISP methodology with only a slight modification. However, this asymmetry may be less problematic for exogenous ParaCEST applications where the desired CEST effect is >5ppm off-resonance.
The main limitation of the FISP acquisition is a decreased signal-to-noise ratio (SNR) in comparison to spin echo and RARE acquisitions. In these initial experiments, the CEST-FISP acquisition resulted in a factor of four decrease in SNR. This decrease in SNR can result in a practical loss in CEST sensitivity, especially for in vivo applications. However, the decrease in SNR is more than offset by the 50-fold reduction in acquisition time. Additionally, this reduction in acquisition time was obtained with an additional delay of 15 seconds between successive CEST-FISP scans, which was required by the Bruker Biospec scanner. Further developments suggest that the acquisition time for each CEST image can be reduced to 5 seconds, which would provide a 200-fold reduction in acquisition time. Overall, the FISP acquisition provides an increased SNR/time when the highest possible CEST sensitivity is required. At the same time, the rapid FISP acquisition can allow for a more rigorous image analysis to quantify both physical (ex. ParaCEST agent concentration) and physiologic (ex. Tumor pH) parameters (25–27).
CONCLUSIONS
We have developed and validated a new CEST MRI technique that combines a single CEST radiofrequency preparation scheme followed by a rapid FISP imaging readout. This technique is capable of providing rapid CEST MRI z-spectra data in just a few minutes in comparison to conventional MRI acquisition techniques. The temporal resolution of the CEST-FISP technique is comparable to conventional echo-planar imaging methods, but with substantially reduced image artifacts such as ghosting, blurring, and distortion. A comparison with a gold-standard CEST-spin echo acquisition showed that the CEST-FISP technique provided equivalent CEST sensitivity. Initial in vivo results also suggest that the CEST-FISP acquisition can provide quantitative CEST / MT imaging data at 7T. Therefore, the CEST-FISP technique provides a practical and sensitive MRI imaging technique to study both exogenous and endogenous CEST and Magnetization Transfer mechanisms on high field MRI scanners.
ACKNOWLEDGEMENTS
The authors would like to acknowledge the support of Northeast Ohio Small Animal Imaging Resource Center grant (R24 CA110943), the Case Comprehensive Cancer Center (P30 CA043703) and the Case Western Reserve Transdisciplinary Research on Energetics and Cancer (TREC) Center (U54 CA116867).
REFERENCES
- 1.Johnston PD, Redfield AG. An NMR study of the exchange rates for protons involved in the secondary and tertiary structure of yeast tRNA Phe. Nucleic Acids Res. 1977;4(10):3599–3615. doi: 10.1093/nar/4.10.3599. [DOI] [PMC free article] [PubMed] [Google Scholar]
- 2.Wuthrich K, Wagner G, Richarz R, Perkins SJ. Individual assignments of the methyl resonances in the 1H nuclear magnetic resonance spectrum of the basic pancreatic trypsin inhibitor. Biochemistry. 1978;17(12):2253–2263. doi: 10.1021/bi00605a001. [DOI] [PubMed] [Google Scholar]
- 3.Zhou J, Payen JF, Wilson DA, Traystman RJ, van Zijl PCM. Using the amide proton signals of intracellular proteins and peptides to detect pH effects in MRI. Nature medicine. 2003;9(8):1085–1090. doi: 10.1038/nm907. [DOI] [PubMed] [Google Scholar]
- 4.Zhou J, Lal B, Wilson DA, Laterra J, van Zijl PCM. Amide proton transfer (APT) contrast for imaging of brain tumors. Magnetic Resonance in Medicine. 2003;50(6):1120–1126. doi: 10.1002/mrm.10651. [DOI] [PubMed] [Google Scholar]
- 5.van Zijl PC, Jones CK, Ren J, Malloy CR, Sherry AD. MRI detection of glycogen in vivo by using chemical exchange saturation transfer imaging (glycoCEST) Proc Natl Acad Sci U S A. 2007;104(11):4359–4364. doi: 10.1073/pnas.0700281104. [DOI] [PMC free article] [PubMed] [Google Scholar]
- 6.Ling W, Regatte RR, Navon G, Jerschow A. Assessment of glycosaminoglycan concentration in vivo by chemical exchange-dependent saturation transfer (gagCEST) Proceedings of the National Academy of Sciences. 2008;105(7):2266. doi: 10.1073/pnas.0707666105. [DOI] [PMC free article] [PubMed] [Google Scholar]
- 7.Mani T, Tircso G, Togao O, Zhao P, Soesbe TC, Takahashi M, Sherry AD. Modulation of water exchange in Eu(III) DOTA-tetraamide complexes: considerations for in vivo imaging of PARACEST agents. Contrast Media Mol Imaging. 2009;4(4):183–191. doi: 10.1002/cmmi.279. [DOI] [PMC free article] [PubMed] [Google Scholar]
- 8.Ali MM, Liu G, Shah T, Flask CA, Pagel MD. Using two chemical exchange saturation transfer magnetic resonance imaging contrast agents for molecular imaging studies. Acc Chem Res. 2009;42(7):915–924. doi: 10.1021/ar8002738. [DOI] [PMC free article] [PubMed] [Google Scholar]
- 9.Liu G, Ali MM, Yoo B, Griswold MA, Tkach JA, Pagel MD. PARACEST MRI with improved temporal resolution. Magn Reson Med. 2009;61(2):399–408. doi: 10.1002/mrm.21863. [DOI] [PMC free article] [PubMed] [Google Scholar]
- 10.Marzola P, Osculati F, Sbarbati A. High field MRI in preclinical research. European journal of radiology. 2003;48(2):165–170. doi: 10.1016/j.ejrad.2003.08.007. [DOI] [PubMed] [Google Scholar]
- 11.Sun PZ, Sorensen AG. Imaging pH using the chemical exchange saturation transfer (CEST) MRI: Correction of concomitant RF irradiation effects to quantify CEST MRI for chemical exchange rate and pH. Magn Reson Med. 2008;60(2):390–397. doi: 10.1002/mrm.21653. [DOI] [PubMed] [Google Scholar]
- 12.Sun PZ, Farrar CT, Sorensen AG. Correction for artifacts induced by B(0) and B(1) field inhomogeneities in pH-sensitive chemical exchange saturation transfer (CEST) imaging. Magn Reson Med. 2007;58(6):1207–1215. doi: 10.1002/mrm.21398. [DOI] [PubMed] [Google Scholar]
- 13.Sun PZ, Benner T, Kumar A, Sorensen AG. An Investigation of Optimizing and Translating pH-Sensitive Pulsed-Chemical Exchange Saturation Transfer (CEST) Imaging to a 3 T Clinical Scanner. Magnetic resonance in medicine: official journal of the Society of Magnetic Resonance in Medicine/Society of Magnetic Resonance in Medicine. 2008;60(4):834. doi: 10.1002/mrm.21714. [DOI] [PMC free article] [PubMed] [Google Scholar]
- 14.Haacke EM, Tkach JA. Fast MR imaging: techniques and clinical applications. American Journal of Roentgenology. 1990;155(5):951. doi: 10.2214/ajr.155.5.2120964. [DOI] [PubMed] [Google Scholar]
- 15.Schmitt F, Turner R, Stehling MK. Echo-planar imaging. Springer-Verlag; 1998. [Google Scholar]
- 16.Hawkes RC, Patz S. Rapid Fourier imaging using steady-state free precession. Magnetic Resonance in Medicine. 1987;4(1) doi: 10.1002/mrm.1910040103. [DOI] [PubMed] [Google Scholar]
- 17.Oppelt A, Graumann R, Barfuss H, Fischer H, Hartl W, Schajor W. FISP-a new fast MRI sequence. Electromedica. 1986;54(1):15–18. [Google Scholar]
- 18.Woessner DE, Zhang S, Merritt ME, Sherry AD. Numerical solution of the Bloch equations provides insights into the optimum design of PARACEST agents for MRI. Magn Reson Med. 2005;53(4):790–799. doi: 10.1002/mrm.20408. [DOI] [PubMed] [Google Scholar]
- 19.Stancanello J, Terreno E, Castelli DD, Cabella C, Uggeri F, Aime S. Development and validation of a smoothing-splines-based correction method for improving the analysis of CEST-MR images. Contrast Media Mol Imaging. 2008;3(4):136–149. doi: 10.1002/cmmi.240. [DOI] [PubMed] [Google Scholar]
- 20.Terreno E, Stancanello J, Longo D, Castelli DD, Milone L, Sanders HM, Kok MB, Uggeri F, Aime S. Methods for an improved detection of the MRI-CEST effect. Contrast Media Mol Imaging. 2009;4(5):237–247. doi: 10.1002/cmmi.290. [DOI] [PubMed] [Google Scholar]
- 21.Lu LST, Griswold MA, Flask CA. A New, Polynomial-Based (PARA)CEST Analysis Method with B0 Correction and Increased Sensitivity. Honolulu, HI: 2009. Apr, p. 183. 2009. [Google Scholar]
- 22.Flask CA, Dale B, Lewin JS, Duerk JL. Radial alternating TE sequence for faster fat suppression. Magn Reson Med. 2003;50(5):1095–1099. doi: 10.1002/mrm.10615. [DOI] [PubMed] [Google Scholar]
- 23.Fuller S, Reeder S, Shimakawa A, Yu H, Johnson J, Beaulieu C, Gold GE. Iterative decomposition of water and fat with echo asymmetry and least-squares estimation (IDEAL) fast spin-echo imaging of the ankle: initial clinical experience. AJR Am J Roentgenol. 2006;187(6):1442–1447. doi: 10.2214/AJR.05.0930. [DOI] [PubMed] [Google Scholar]
- 24.Szumowski J, Coshow W, Li F, Coombs B, Quinn SF. Double-echo three-point-Dixon method for fat suppression MRI. Magn Reson Med. 1995;34(1):120–124. doi: 10.1002/mrm.1910340118. [DOI] [PubMed] [Google Scholar]
- 25.McMahon MT, Gilad AA, Zhou J, Sun PZ, Bulte JW, van Zijl PC. Quantifying exchange rates in chemical exchange saturation transfer agents using the saturation time and saturation power dependencies of the magnetization transfer effect on the magnetic resonance imaging signal (QUEST and QUESP): Ph calibration for poly-L-lysine and a starburst dendrimer. Magn Reson Med. 2006;55(4):836–847. doi: 10.1002/mrm.20818. [DOI] [PMC free article] [PubMed] [Google Scholar]
- 26.Sun PZ, van Zijl PC, Zhou J. Optimization of the irradiation power in chemical exchange dependent saturation transfer experiments. J Magn Reson. 2005;175(2):193–200. doi: 10.1016/j.jmr.2005.04.005. [DOI] [PubMed] [Google Scholar]
- 27.Zhou J, Wilson DA, Sun PZ, Klaus JA, Van Zijl PC. Quantitative description of proton exchange processes between water and endogenous and exogenous agents for WEX, CEST, and APT experiments. Magn Reson Med. 2004;51(5):945–952. doi: 10.1002/mrm.20048. [DOI] [PubMed] [Google Scholar]


