Abstract
Objective
Induction of heme oxygenase-1 (HO-1) has been demonstrated to result in chronic weight loss in several rodent models of obesity. However, the specific contribution of the HO metabolite, carbon monoxide (CO) to this response remains unknown. In this study, we determined the effect of chronic low level administration of a specific CO donor on the progression of obesity and its effects on metabolism and adipocyte biology in mice fed a high fat diet.
Design
Experiments were performed on C57BL/6J mice fed a high (60%) fat diet from 4 weeks until 30 weeks of age. Mice were administered either the CO donor, CORM-A1 (5 mg/kg, ip every other day) or the inactive form of the drug (iCORM-A1). Body weights were measured weekly and fasted blood glucose, insulin as well as body composition were measured every 6 weeks. Food intake, O2 consumption, CO2 production, activity, and body heat production were measured at 28 weeks after start of the experimental protocol.
Results
Chronic CORM-A1 attenuated the development of high fat induced obesity from 18 weeks until the end of the study. Chronic CORM-A1 treatment in mice fed a high fat diet resulted in significant decreases in fasted blood glucose, insulin, and body fat and increased O2 consumption, and heat production as compared to mice treated with iCORM-A1. Chronic CORM-A1 treatment also resulted in a significant decrease in adipocyte size and an increase in adipocyte number and in NRF1, PGC-1α, and UCP-1 protein levels in epidydmal fat.
Conclusion
Our results demonstrate that chronic CO treatment prevents the development of high fat diet induced obesity via stimulation of metabolism and remodeling of adipocytes.
Keywords: heme oxygenase, metabolism, insulin resistance, oxygen consumption, diabetes
Introduction
The prevalence of obesity is increasing in populations worldwide. Obesity is often part of the metabolic syndrome, a condition which includes insulin resistance, dyslipidemian, reduced HDL cholesterol, and hypertension. Metabolic syndrome increases the risk for development of cardiovascular diseases such as coronary artery disease, stroke, and end-stage renal disease 1, 2.
Carbon monoxide (CO) is an odorless, colorless gas produced by combustion of carbon compounds such as those found in fossil fuels used in internal combustion engines. CO can be poisonous when levels in the air greater 1500 parts per million (ppm) are inhaled for a prolonged period of time as CO alters oxygen transport in red blood cells resulting in severe tissue hypoxia. While we are exposed to CO in the environment, CO is also produced endogenously in the body where it serves as a gaseous transmitter 3–5. CO is produced via catabolism of heme by heme oxygenase (HO) enzymes and by oxidation of lipids. HO enzymes exist in two major isoforms: heme oxygenase-1 (HO-1) and heme oxygenase-2 (HO-2). HO-1 is a 32 kilodalton protein which is inducible by a wide variety of stimuli including oxidants, metals, and hypoxia 6. HO-2 is a 36 kilodalton protein which is the constitutively expressed isoform important in vascular function 7, 8.
Several studies have demonstrated that chemical induction or genetic overexpression of HO-1 can attenuate development of obesity 9–13. Although increases in HO-1 expression attenuate obesity, the role of the HO metabolite, CO, in this response has not been specifically evaluated. Carbon monoxide releasing molecules (CORMs) are a class of compounds which release CO in response to changes in pH or oxidant status 14–18. CORM-A1 is a water soluble CO releasing molecule that does not contain a transition metal and thus releases CO over a longer half-life as compared to first generation CORMs 19. Since CORM-A1 lacks transition metals which are present in CORMs such as CORM-2 and 3, the inactive form of this compound does not induce HO-1 so that the specific effect of increases in CO alone can be evaluated 20. In the present study, mice were treated every other day over a 30 week time frame with a low dose of CORM-A1 in order to determine the specific effect of chronic, low-dose CO treatment on development of obesity in response to a high fat diet.
Methods
Animals
The experimental procedures and protocols of this study conform to the National Institutes of Health Guide for the Care and Use of Laboratory Animals and were approved by the Institutional Animal Care and Use Committee of the University of Mississippi Medical Center. Studies were performed on male C57BL/6J mice purchased from Jackson Labs (Bar Harbor, ME). All mice were 4 weeks old at the onset of the study. Mice were housed under standard conditions and allowed full access to 40% high fat diet (diet # D12492, Research Diets, Inc., New Brunswick, NJ) or a control 17% fat diet (Teklad 22/5 rodent diet, #860, Harland Laboratories, Inc., Indianapolis, IN) and water. Mice received intraperitoneal injections with either CORM-A1 (5 mg/kg body wt., 0.1 cc volume) or iCORM-A1 (2.25 mg · ml−1, 0.1 cc volume) every 48-hours for 30 weeks. CORM-A1 was synthesized as previously described 21. iCORM-A1 consisted of CORM-A1 prepared in 0.1 M HCl bubbled with N2 gas for 10 min and then the pH of the solution was adjusted to 7.0.
Body composition (EchoMRI)
Body composition changes were assessed at 6 week intervals throughout the study using magnetic resonance imaging (EchoMRI-900TM, Echo Medical System, Houston, TX). MRI measurements were performed in conscious mice placed in a thin-walled plastic cylinder with a cylindrical plastic insert added to limit movement of the mice. Mice were briefly submitted to a low intensity electromagnetic field and fat mass, lean mass, free water and total water were measured.
Fasting Glucose
Following an overnight fast a blood sample was obtained via orbital sinus under isoflorane anesthesia. Blood glucose was measured using an Accu-Chek Advantage glucometer (Roche, Mannheim, Germany).
Oxygen consumption, carbon dioxide production and motor activity
At 28 weeks after the start of the experimental protocol CORM-A1 treated, iCORM-A1 treated or control mice were placed individually in an acrylic cage (16 cm × 24 cm × 17 cm) equipped with a metabolic monitoring system (AccuScan system, Harvard Apparatus, Holliston, Massachusetts) for measurements of oxygen consumption (VO2), carbon dioxide production (VCO2) and respiratory quotient (RQ) as previously described 12. VO2, VCO2 and RQ were determined daily (for 2 min every 10-min interval) and expressed as the 24 hour average. RQ was calculated by the formula: VCO2/VO2. Motor activity was determined using infrared light beams mounted in the cages in x, y, and z axes. Heat production was derived from the following formula (4.33 + (0.67*RQ)*VO2*weight (g)*60). After the mice were acclimatized to the new environment for 1 day, VO2, VCO2, RQ and animal activity were recorded for 2 consecutive days.
Glucose tolerance test
For glucose tolerance tests (GTT), mice were subjected to fasting overnight (~ 16 h) and D-glucose (1 g/kg of body weight) was injected intraperitoneally. Blood glucose was monitored at 0, 15, 30, 60, and 90 min after glucose injection.
Food consumption
Food consumption was measured during week 29 of mice receiving CORM-A1 or iCORM-A1 injections. The total amount of Food was weighed daily in the morning for 5 consecutive days. The daily consumption over the 5 day period was averaged for each mouse to obtain 24-hour food consumption.
Adipocyte staining and counting
To determine the effects of treatment on adipocyte morphology, visceral and subcutaneous fat was excised immediately after euthanasia. For analysis of adipocyte size, fat pads of mice from each group were fixed in formalin and embedded in paraffin, cut in 5 mm section and stained with hematoxylin and eosin. Adipocyte size was determined at 100× magnification using a color video camera attached to a Nikon microscope by Metamorph software (Universal Imaging Corporation, Downingtown PA). To ensure accuracy of measurement three images of each animal were analyzed by three different investigators and averaged into a single measurement. Measurements were obtained from 3 individual animals per group. Data is presented as the average ± SE for each group.
Western blot analysis
Western blots were performed on lysates prepared from tissues collected at the end of the experiments. Samples of 30 μg of protein were boiled in Laemmli sample buffer (Bio-Rad, Hercules, CA) for 5 min and electrophoresed on 10 or 12.5% SDS-polyacrylamide gels and blotted onto nitrocellulose membrane. Membranes were blocked with Odyssey blocking buffer (LI-COR, Lincoln, NE) for 2 hours at room temperature and then incubated with primary antibodies overnight at 4°C. Membranes were incubated with either Alex 680 (Molecular Probes) or IRDye 800 (Rockland, Gilbertsville, PA) secondary antibodies for 1 hour at room temperature. Membranes were visualized using an Odyssey infrared imager (Li-COR, Lincoln, NE) which allows for the simultaneous detection of two proteins. Densitometry analysis was performed using Odyssey software (LI-COR, Lincoln, NE). Antibodies for Western blots were as follows: ALDH1A1 (Abcam, Cambridge, MA, 1:1000), HO-1 (Enzo Life Sciences, Farmingdale, NY, 1:1000), NRF-1 (Rockland, Gilbertsville, PA, 1:1000), Nrf-2 (Abcam, Cambridge, MA., 1:1000), PGC1-α (Cell Signaling Tech, Boston, MA, 1:1000), UCP-1 (Sigma, St. Louis, MO, 1:1000), HIF-1α (Novus Biologicals, Littleton, CO, 1:500), Fibronectin (Novus Biologicals, Littleton, CO, 1:1000), VEGF (Abcam, Cambridge, MA, 1:2000), Collagen type I, Sigma-Aldrich, St. Louis, MO, 1:2000), Collagen type III (Abcam, Cambridge, MA, 1:500) and β-actin (Abcam, Cambridge, MA, 1:5000). All blots from tissue samples were run twice with 3 samples from HF + CORM-A1 and HF + iCORM-A1 treated mice and 2 samples from control, lean mice per gel.
Adiponectin, leptin and insulin
Plasma adiponectin, insulin, and leptin concentrations were determined by ELISAs (Millipore adiponectin ELISA kit, Linco Insulin ELISA kit and R & D leptin ELISA kit) as previously described 12.
Statistics
All data are presented as mean + S.E.M. Differences between treatment groups were determined using one-way analysis of variance with a post hoc test (Dunnett’s). A P<0.05 was considered to be significant. All analyses were performed with SigmaStat (Systat software, Inc., Richmond, CA, USA).
Results
Chronic CORM-A1 Treatment Attenuates Weight Gain and Decreases Fat Mass in Mice Fed a High Fat Diet
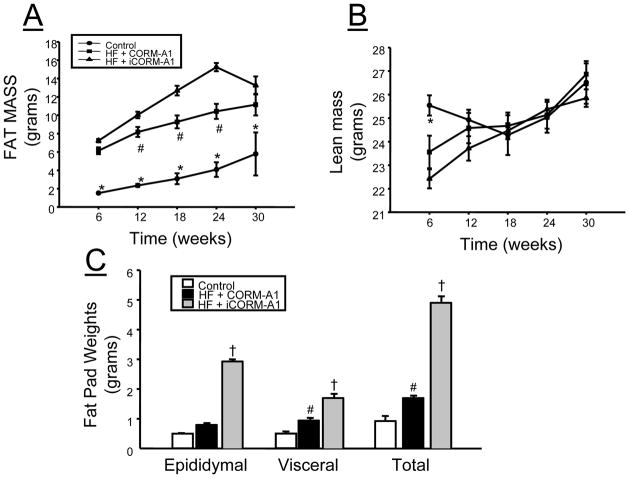
High fat feeding in mice resulted in significant elevations in body weight as compared to mice fed standard chow by week 10 of the study. CORM-A1 treatment resulted in reduced body weight starting at week 19 and remained lower in the CORM-A1 treated mice as compared to the iCORM-A1, which is the inactive form of the CO donor, treated mice throughout the duration of the study (Figure 1). Fat mass as measured by echo-MRI was increased in both groups of high fat fed mice as compared to control mice fed a standard chow. However, fat mass was significantly decreased in CORM-A1 as compared to iCORM-A1 treated mice at 12, 18, and 24 weeks (Figure 2A). No differences in lean mass were detected between the groups at 12, 18, 24 or 30 weeks of age (Figure 2B). Fat pad weight measured at the end of the study was impacted by chronic treatment of CORM-A1. Epididymal fat was significantly increased in iCORM-A1 treated mice as compared to both CORM-A1 and control mice (Figure 2C). Visceral fat was increased in both groups fed a high fat diet as compared to control mice but visceral fat weight was significantly higher in iCORM-A1 treated versus CORM-A1 treated mice (Figure 2C). Total fat was also increased in both groups fed a high fat diet as compared to control mice but the total amount of fat was significantly less in the CORM-A1 as compared to the iCORM-A1 treated mice (Figure 2C).
Figure 1.
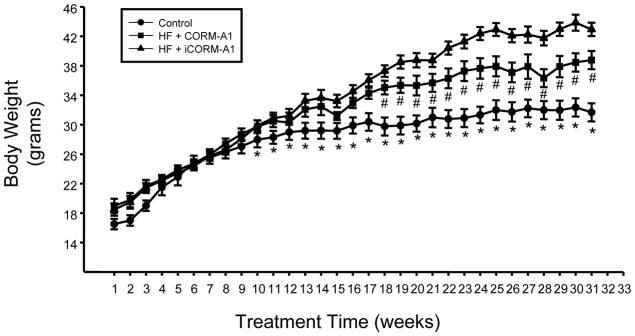
Weekly body weights in control (n=4), high fat (HF) + CORM-A1 (n=9), and high fat (HF) + inactive CORM-A1 (iCORM-A1, n=9) treated mice. *= significant from HF treated mice, P<0.05. #= significant from iCORM-A1 treated mice, P<0.05.
Figure 2.
Effect of CORM-A1 treatment on: A) fat mass as measured by echo-MRI, B) lean mass as measured by echo-MRI, C) fat pad weights measured at the end of the 30 week experimental protocol in control (n=4), high fat (HF) + CORM-A1 (n=9), and high fat (HF) + inactive CORM-A1 (iCORM-A1, n=9) treated mice. *= significant from HF treated mice, P<0.05. #= significant from iCORM-A1 treated mice, P<0.05.
Chronic CORM-A1 Treatment Lowers Blood Glucose and Insulin, Increases Glucose Clearance, and Decreases Plasma Leptin in Mice Fed a High Fat Diet
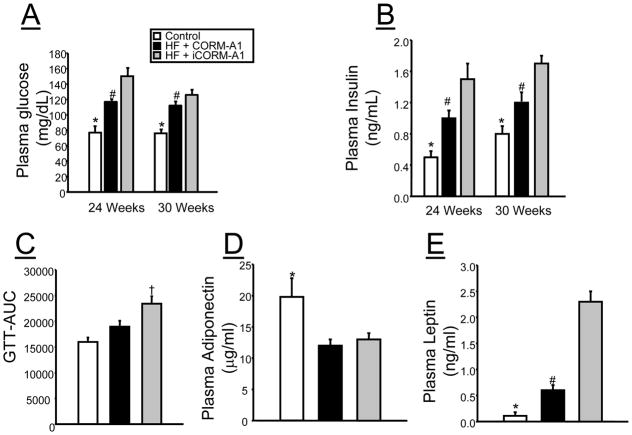
Fasted blood glucose levels in both groups of mice fed a high fat diet were increased at both 24 and 30 weeks of treatment as compared to control mice (Figure 3A). However, fasted blood glucose levels were significantly lower in CORM-A1 treated as compared to iCORM-A1 treated mice at both time frames (Figure 3A). Plasma insulin levels were increased at both 24 and 30 weeks in both groups of mice fed a high fat diet as compared to control mice (Figure 3B). CORM-A1 treatment resulted in 30% decrease in plasma insulin levels as compared to iCORM-A1 treated mice at both 24 and 30 weeks (Figure 3B). In order to access in vivo insulin function, we performed a glucose tolerance test at 30 weeks of age. iCORM-A1 treated mice exhibited a significantly increased delay in the clearance of glucose as indicate by the greater area under the curve as compared to CORM-A1 and control mice (Figure 3C). No difference in glucose clearance was detected between control and high fat fed CORM-A1 treated mice. Plasma adiponectin levels measured at week 30 were decreased in both groups of mice fed a high fat diet as compared to control mice (Figure 3D). Plasma leptin levels were increased in both groups of mice fed a high fat diet as compared to control mice (Figure 3E); however, plasma leptin levels were reduced by 70% in CORM-A1 treated mice as compared to iCORM-A1 treated mice (Figure 3E).
Figure 3.
A) fasted blood glucose measurements in control (n=4), high fat (HF) + CORM-A1 (n=9), and high fat (HF) + inactive CORM-A1 (iCORM-A1, n=9) treated mice. B) Plasma insulin measurements control (n=4), high fat (HF) + CORM-A1 (n=9), and high fat (HF) + inactive CORM-A1 (iCORM-A1, n=9) treated mice. C) Glucose tolerance test area under the curve (GTT-AUC) in control (n=4), high fat (HF) + CORM-A1 (n=6), and high fat (HF) + inactive CORM-A1 (iCORM-A1, n=6) treated mice. Glucose tolerance tests were performed in fasted mice at week 27 of the experimental protocol. D) Plasma adiponectin E) Plasma leptin measurements at week 30 of the experimental protocol control (n=4), high fat (HF) + CORM-A1 (n=9), and high fat (HF) + inactive CORM-A1 (iCORM-A1, n=9) treated mice. *= significant from HF treated mice, P<0.05. #= significant from iCORM-A1 treated mice, P<0.05. † = significant from control and CORM-A1 treated mice, P<0.05.
Chronic CORM-A1 Treatment Increases Oxygen Consumption and Heat Production but Has No Effect on Food Consumption or Physical Activity in Mice Fed a High Fat Diet
In order to determine the effect of chronic CORM-A1 on metabolism, mice were placed in metabolic chambers at 28 weeks of treatment for measurement of oxygen consumption, carbon dioxide production, heat production and activity. Oxygen consumption when normalized to the lean body weight as measured by echo-MRI was significantly elevated in the CORM-A1 treated mice on the high fat diet as compared to both iCORM-A1 treated and control mice fed a standard diet (Figure 4A). Carbon dioxide production when normalized to lean body weight was increased in the CORM-A1 treated mice as compared to both iCORM-A1 and control mice but this increase did not achieve statistical significance (Figure 4B). Heat production was significantly increased in CORM-A1 treated mice as compared to both iCORM-A1 and control mice (Figure 4C). High fat feeding resulted in a significant decrease in activity as compared to control mice which was not reversed by CORM-A1 treatment (Figure 4D). Measured over a 5 day period at 29 weeks after commencement of injections, food intake was not different between any of the groups; however, the caloric intake of the mice fed a high fat diet was higher than that of the mice fed a normal fat diet (Figure 4E).
Figure 4.
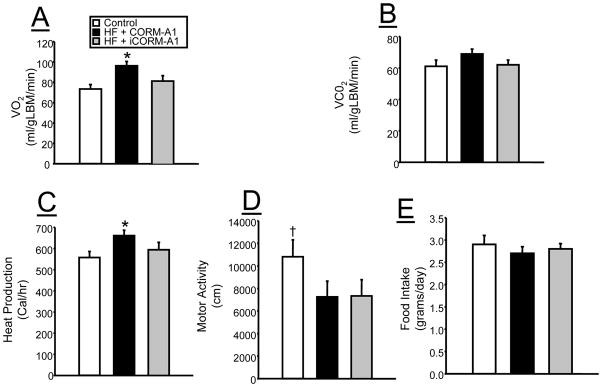
Effects of chronic CORM-A1 treatment on A) oxygen consumption (VO2), B) carbon dioxide production (VCO2), C) heat production, D) motor activity and E) food intake in control (n=4), high fat (HF) + CORM-A1 (n=9), and high fat (HF) + inactive CORM-A1 (iCORM-A1, n=9) treated mice. *= significant from control and HF + iCORM-A1 treated. † = significant from high fat mice, P<0.05.
Chronic CORM-A1 Treatment Remodels Adipocyte Size and Number
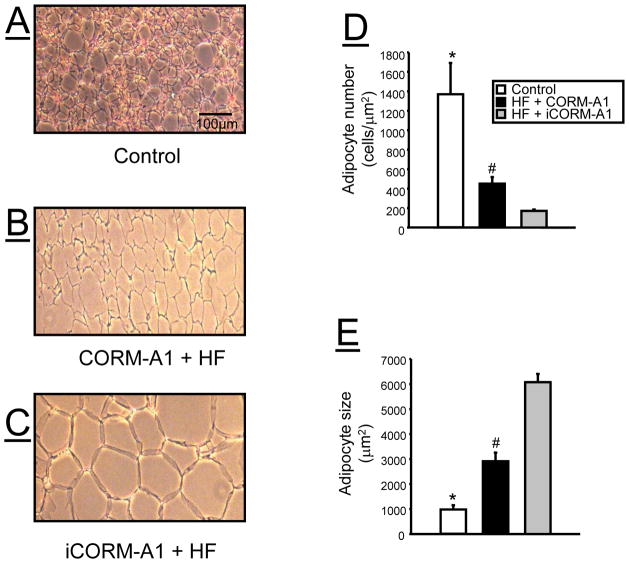
The effect of chronic CORM-A1 treatment on adipocyte number and morphology was determined in sections of epididymal fat obtained at the end of the experimental protocol. High fat diet resulted in a decrease in number and an increase in epididymal adipocyte size as compared to mice fed a standard diet (Figure 5). CORM-A1 treatment resulted in a significant increase in epididymal adipocyte number as compared to iCORM-A1 treated mice (Figure 5D). CORM-A1 also resulted in a significant decrease in epididymal adipocyte size as compared to iCORM-A1 treated mice (Figure 5E). No significant differences in adipocyte number or size were detected in the subcutaneous fat between any of the groups (Supplementary Figure 1).
Figure 5.
Representative hematoxylin and eosin (H &E) staining of epidydmal fat tissues from A) control, B) high fat (HF) + CORM-A1, and C) high fat (HF) + iCORM-A1 treated mice. D) adipocyte number from the different treatment groups (n=3 per group). E) adipocyte size of the different treatment groups (n=3 per group). *= significant from HF treated mice, P<0.05. #= significant from iCORM-A1 treated mice, P<0.05.
Chronic CORM-A1 Treatment Induces Markers of Mitochondrial Biogenesis and Browning of Fat in Adipocytes from Mice Fed a High Fat Diet
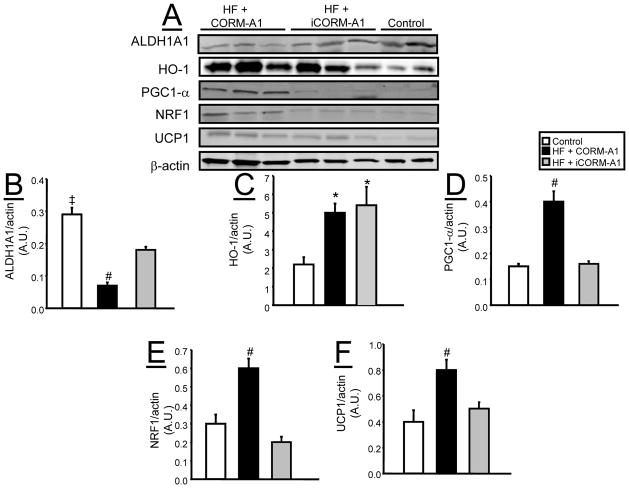
In samples of epidydimal fat, chronic CORM-A1 treatment increased levels of peroxisomal proliferating activating receptor- γ coactivator (PGC-1α) and nuclear respiratory factor-1 (NRF-1) which are considered markers of mitochondrial biogenesis (Figure 6A, D, E). Levels of uncoupling protein-1 (UCP1) were also increased in epidydimal fat of CORM-A1 treated mice (Figure 6A and F). The levels of heme oxygenase-1 (HO-1) were increased in the epidydimal fat of both groups of mice fed a high fat diet as compared with control mice on a normal fat diet (Figure 6A and C).
Figure 6.
Representative Western blots from epidydmal fat tissues from control (n=4), high fat (HF) + CORM-A1 (n=6), and high fat (HF) + iCORM-A1 treated mice (n=6). A) Representative blots. B) Levels of ALDH1A1. C) Levels of HO-1. D) Levels of PGC1-α. E) Levels of NRF1. F) Levels of UCP1. *= significant from control mice, P<0.05. #= significant from HF + iCORM-A1 treated and control mice, P<0.05. ‡ =P<0.05 as compared to HF + iCORM-A1 treated.
In subcutaneous fat, chronic CORM-A1 treatment increased levels of and PGC-1α and NRF-1 similar to what was observed in epidydimal fat (Supplemental Figure 2A, D, E). The levels of UCP1 were increased in the subcutaneous fat in CORM-A1 treated mice (Supplemental Figure 2A and F). In contrast to epididymal fat, the levels of HO-1 were reduced in both groups of mice fed a high fat diet as compared to lean, control mice (Supplemental Figure 2A and C). The levels of aldehyde dehydrogenase-1(ALDH1A1), were increased in iCORM-A1 treated mice fed a high fat diet but were normalized in mice chronically treated with CORM-A1 (Supplemental Figure 2A and B). HO-1 levels in the brown fat were increased in both groups of mice fed a high fat diet as compared to lean, control mice (Figure 7). CORM-A1 treatment resulted in a significant increase in UCP-1 levels in the brown fat as compared to lean, control mice but not high fat mice treated with iCORM-A1 (Figure 7).
Figure 7.
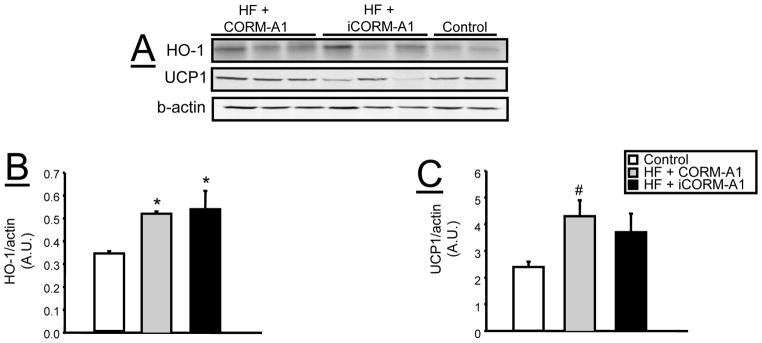
Representative Western blots from brown fat tissue from control (n=4), high fat (HF) + CORM-A1 (n=6), and high fat (HF) + iCORM-A1 treated mice (n=6). A) Representative blots. B) Levels of HO-1. C) Levels of UCP1. *= significant from control mice, P<0.05.
Chronic CORM-A1 Treatment Induces Hypoxia Inducible Factor 1-α (HIF-1α) but not Vascular Endothelial Derived Growth Factor (VEGF) or Collagen Levels in Epidydmal Fat
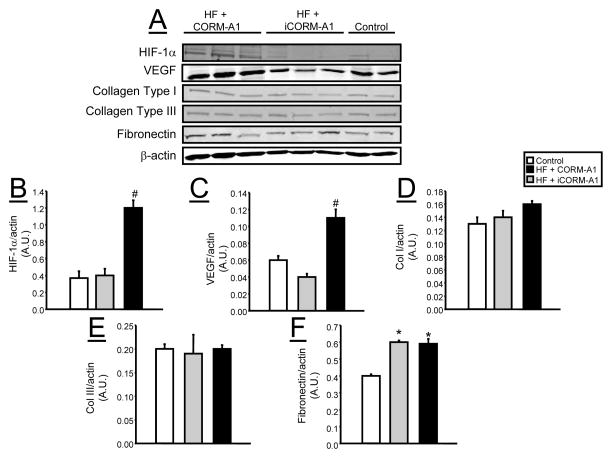
The levels of hypoxia inducible factor 1-α (HIF-1α) as well as the levels of vascular endothelial derived growth factor (VEGF) were measure in samples of epidydmal fat from mice in each treatment groups. HIF-1α levels were significantly elevated in the epidydmal fat of CORM-A1 mice as compared to both iCORM-A1 and control mice (Figure 8A &B). VEGF levels were also significantly increased in CORM-A1 treated mice as compared to both iCORM-A1 treated mice on a high fat diet and control mice on a normal fat diet (Figure 8A &C). In order to further address adipocyte remodeling, the levels of collagen I and III as well as fibronectin levels were measured in samples of epidydmal fat from mice in each treatment group. No differences in collagen I or III levels were detected between the groups (Figure 8A, D &E). Fibronectin levels were decreased by high fat diet treatment and CORM-A1 treatment had no effect on this response (Figure 8A & F).
Figure 8.
Representative Western blots from epidydmal fat tissues from control (n=4), high fat (HF) + CORM-A1 (n=6), and high fat (HF) + iCORM-A1 treated mice (n=6). A) Representative blots. B) Levels of HIF-1α. C) Levels of VEGF. D) Levels of collagen type I. E) Levels of collagen type III. F) Levels of fibronectin. *= significant from control mice, P<0.05. #= significant from HF + iCORM-A1 treated and control mice, P<0.05.
Discussion
Our results demonstrate the chronic low-dose treatment with a CO donor, CORM-A1, attenuates the development of obesity and remodels existing adipocytes in mice fed a high fat diet. The dose of CORM-A1 utilized in the present study was based on previous studies which have demonstrated that this dose of CORM-A1 (5mg/kg) does not significantly elevate blood carboxyhemoglobin levels when measured up to 120 minutes after administration 22. Thus, chronic low-dose CORM-A1treatment as utilized in the present study would have no adverse side-effects due to increases in blood carboxyhemoglobin and interference with oxygen delivery to the tissues. It is not known if a higher dose of CORM-A1, one that would result in a mild 20–25% increase in blood carboxyhemoglobin levels, would have a greater effect to promote further weight loss and remodeling of adipocytes.
Chronic treatment with the CO donor resulted in significant increases in oxygen consumption and heat production without any effects on food intake in mice fed a high fat diet. The effect of CO donor treatment on oxygen consumption and heat production were similar to effects of chronic HO-1 induction in obese melanocortin-4 receptor (MC4R) deficient mice12. The effects of CO donor treatment to increase oxygen consumption without altering food intake suggest that chronic CO donor treatment causes weight loss through increases in metabolism. The increase in metabolism in response to chronic CO donors may be mediated by alterations in mitochondrial function. There are several observations in the literature and in the present study which support the role of increased mitochondrial function in mediating the increase in metabolism in chronic CO treated mice fed a high fat diet. Previous studies have demonstrated that CO increases mitochondrial biogenesis in the heart and skeletal muscle 23–25. The increase in mitochondrial biogenesis in these tissues was mediated via increases in NRF1and PGC-1α25,26. In the present study, chronic CO treatment increased the levels of these proteins in the fat and resulted in changes in adipocyte number and morphology in the epidydimal fat depot.
CO treatment can also have significant effects on mitochondrial function in addition to effects on biogenesis. CO increases intracellular ATP levels in both cultured astrocytes and hepatocytes through soluble guanylyl cyclase (sGC) dependent and independent mechanisms27, 28. One way in which CO may improve mitochondrial efficiency is through its effect on mitochondrial respiration. CO has been reported to have different effects on mitochondrial respiration depending on the levels to which mitochondria are exposed 29. At low levels (1 μM and below) CO increases respiratory control ratio (RCR) and increases mitochondrial transmembrane potential, while at higher levels (> 5 μM) CO has the opposite effect. A recent study in high fat fed mice demonstrated that acute treatment (2 injections separated by 16 hours after 12 weeks on the diet) with the CO donor, CORM-3, improved state 3 respiration, increased mitochondrial membrane potential, and improved cardiac function 30. Although it is difficult to determine the actual concentration of CO that the adipocytes were exposed to in the present study, it is more likely that it would be closer to the lower end (<1 μM) as the dose of CORM-A1 administered in the present study failed to increase blood carboxyhemoglobin levels. CO treatment can also increase oxygen consumption and heat production through mitochondrial uncoupling 29, 31, 32. Although the exact mechanism by which CO causes mitochondrial uncoupling is not known, results from the present study clearly demonstrate that chronic CO treatment results in increases in UCP-1 in both epidydimal and subcutaneous adipocytes but not in brown fat. The important roles of both UCPs and adenine nucleotide transporter (ANT) in CO mediated mitochondrial uncoupling were recently demonstrated in isolated cardiac mitochondria 32. The increase in UPC-1 levels in adipocytes could be responsible for the increase in heat production that was exhibited by mice chronically treated with CORM-A1 in the present study.
An emerging strategy to curb development of obesity is the conversion of white fat to more metabolically active beige fat phenotype or the “browning” of white adipose tissue. It is believed that by converting energy storing white fat to energy burning brown fat that this can result in an increase in energy expenditure 33, 34. One of the key regulators in the transition of white fat to brown fat is aldehyde dehydrogenases (Aldhs). Mice deficient in Aldh1A1 are resistant to the development of high fat diet induced obesity and also display an increase in metabolic rate and body temperature 35. The retinoid receptor signaling pathway also plays an X receptor (RXR) 36, 37. Alhds are the rate limiting step in the conversion of retinaldehyde to retinoic acid. Recent studies have demonstrated that increased levels of Aldhs are associated with obesity and that blockade of Aldh1a1 stimulates thermogenic reprogramming of white fat38. In the present study, chronic CO treatment resulted in a significant decrease in Aldh1a1 protein levels in subcutaneous fat suggesting a novel link between retinol metabolism and CO in adipocytes. The mechanism by which CO decreases Alhd1a1 protein in fat is not known and merits further investigation.
While we have previously demonstrated that the dose of CORM-A1 utilized in the present study does not result in any increase in blood carboxyhemoglobin levels 22, it is still possible that the CO released could cause local adipose hypoxia which may contribute to the observed effects on body weigh in the present study. Consistent with this hypothesis, the levels of the hypoxia marker HIF-1α were significantly increased in epidydmal fat from the CORM-A1 treated mice. Likewise, a similar increase was observed in the HIF-1α target gene, VEGF. These results suggest that the CO released could cause local hypoxia of the adipose tissue. Recent studies have demonstrated that exposure to high altitude hypoxia can also result in weight loss 39–41. However, the primary mechanism for weight loss in response to high altitude hypoxia appears to be mediated through decreases in food intake rather than increases in metabolic rate. We did not observe any differences in food intake in our mice chronically treated with CORM-A1 so it is likely that the mechanism of weight loss observed in the present study is independent from any effects of generalized hypoxia.
Induction of HO-1 in obesity has been linked to increases in adiponectin 9–12, although the mechanism by which this occurs is not known. Chronic CO treatment failed to increase plasma adiponectin levels which were decreased in response to the chronic high fat diet. This would suggest that the ability of HO-1 to increase plasma adiponectin levels occurs independently of CO production and could be mediated through increases in bilirubin levels or simply by the HO-1 protein itself through some yet unknown mechanism. While chronic CO treatment had no effect on plasma adiponectin, it resulted in a significant decrease in the levels of leptin in the plasma. This result is likely due to the significant decrease in adiposity as a result of chronic CO treatment. Previous studies in obese MC4R deficient mice demonstrated that weight loss with HO-1 induction resulted in a significant increase in physical activity 12. In the present study, although CO treatment resulted in a significant decrease in body weight, it was unable to increase physical activity in mice fed a high fat diet. These results suggest that a high fat diet effects physical activity via a mechanism that is independent of body weight and one that is not affected by chronic CO treatment but is by induction of HO-1.
Our results establish low level chronic CO treatment as a potential anti-obesity treatment. Chronic CO treatment can enhance metabolism through upregulation of mitochondrial biogenesis, mitochondrial uncoupling, and the remodeling of white adipose tissue. Further studies are required to identify the specific mechanisms by which chronic CO treatment mediates these effects in obesity.
Supplementary Material
Supplementary Figure 1- Representative hematoxylin and eosin (H &E) staining of subcutaneous fat tissues from A) control, B) high fat (HF) + CORM-A1, and C) high fat (HF) + iCORM-A1 treated mice. D) adipocyte number from the different treatment groups (n=3 per group). E) adipocyte size of the different treatment groups (n=3 per group). No differences in adipocyte number or size were detected between the groups.
Supplementary Figure 2- Representative Western blots from subcutaneous fat tissues from control (n=4), high fat (HF) + CORM-A1 (n=6), and high fat (HF) + iCORM-A1 treated mice (n=6). A) Representative blots. B) Levels of ALDH1A1. C) Levels of HO-1. D) Levels of PGC1-α. E) Levels of NRF1. F) Levels of UCP1. *= significant from control mice, P<0.05. #= significant from iCORM-A1 treated and control mice, P<0.05. † = significant from HF + CORM-A1 and control mice, P<0.05.
Acknowledgments
The authors would like to acknowledge the support of grants from the National Heart, Lung and Blood Institute, PO1HL-51971, HL088421 (D.E.S.) and 1T32HL105324 (P.A.H). The authors gratefully acknowledge the Analytical and Assay Core Laboratory in the Department of Physiology & Biophysics at the University of Mississippi Medical Center.
Footnotes
Conflict of Interest
The authors declare no conflict of interest.
References
- 1.Eckel RH, Grundy SM, Zimmet PZ. The metabolic syndrome. Lancet. 2005;365:1415–1428. doi: 10.1016/S0140-6736(05)66378-7. [DOI] [PubMed] [Google Scholar]
- 2.Hotamisligil GS. Inflammation and metabolic disorders. Nature. 2006;444:860–867. doi: 10.1038/nature05485. [DOI] [PubMed] [Google Scholar]
- 3.Verma A, Hirsch DJ, Glatt CE, Ronnett GV, Snyder SH. Carbon monoxide: a putative neural messenger. Science. 1993;259:381–384. doi: 10.1126/science.7678352. [DOI] [PubMed] [Google Scholar]
- 4.Johnson RA, et al. Role of endogenous carbon monoxide in central regulation of arterial pressure. Hypertension. 1997;30:962–967. doi: 10.1161/01.hyp.30.4.962. [DOI] [PubMed] [Google Scholar]
- 5.Morse D, Sethi J, Choi AM. Carbon monoxide-dependent signaling. Crit Care Med. 2001;30:S12–S17. [PubMed] [Google Scholar]
- 6.Abraham NG, Kappas A. Pharmacological and clinical aspects of heme oxygenase. Pharmacol Rev. 2008;60:79–127. doi: 10.1124/pr.107.07104. [DOI] [PubMed] [Google Scholar]
- 7.Kaide JI, et al. Carbon monoxide of vascular origin attenuates the sensitivity of renal arterial vessels to vasoconstrictors. J Clin Invest. 2001;107:1163–1171. doi: 10.1172/JCI11218. [DOI] [PMC free article] [PubMed] [Google Scholar]
- 8.Parfenova H, et al. Cerebral vascular endothelial heme oxygenase: expression, localization, and activation by glutamate. Am J Physiol Cell Physiol. 2001;281:C1954–C1963. doi: 10.1152/ajpcell.2001.281.6.C1954. [DOI] [PubMed] [Google Scholar]
- 9.Peterson SJ, et al. L-4F treatment reduces adiposity, increases adiponectin levels, and improves insulin sensitivity in obese mice. J Lipid Res. 2008;49:1658–1669. doi: 10.1194/jlr.M800046-JLR200. [DOI] [PMC free article] [PubMed] [Google Scholar]
- 10.Li M, et al. Treatment of obese diabetic mice with a heme oxygenase inducer reduces visceral and subcutaneous adiposity, increases adiponectin levels, and improves insulin sensitivity and glucose tolerance. Diabetes. 2008;57:1526–1535. doi: 10.2337/db07-1764. [DOI] [PubMed] [Google Scholar]
- 11.Burgess A, et al. Adipocyte heme oxygenase-1 induction attenuates metabolic syndrome in both male and female obese mice. Hypertension. 2010;56:1124–1130. doi: 10.1161/HYPERTENSIONAHA.110.151423. [DOI] [PMC free article] [PubMed] [Google Scholar]
- 12.Csongradi E, Docarmo JM, Dubinion JH, Vera T, Stec DE. Chronic HO-1 induction with cobalt protoporphyrin (CoPP) treatment increases oxygen consumption, activity, heat production and lowers body weight in obese melanocortin-4 receptor- deficient mice. Int J Obes (Lond) 2011 doi: 10.1038/ijo.2011.78. [DOI] [PMC free article] [PubMed] [Google Scholar]
- 13.Cao J, et al. Heme oxygenase gene targeting to adipocytes attenuates adiposity and vascular dysfunction in mice fed a high-fat diet. Hypertension. 2012;60:467–475. doi: 10.1161/HYPERTENSIONAHA.112.193805. [DOI] [PMC free article] [PubMed] [Google Scholar]
- 14.Pitchumony TS, Spingler B, Motterlini R, Alberto R. Syntheses, structural characterization and CO releasing properties of boranocarbonate [H3BCO2H]-derivatives. Org Biomol Chem. 2010;8:4849–4854. doi: 10.1039/c0ob00099j. [DOI] [PubMed] [Google Scholar]
- 15.Vummaleti SV, et al. Theoretical Insights into the Mechanism of Carbon Monoxide (CO) Release from CO-Releasing Molecules. Chemistry. 2012;18:9267–9275. doi: 10.1002/chem.201103617. [DOI] [PubMed] [Google Scholar]
- 16.Motterlini R, et al. Carbon monoxide-releasing molecules: characterization of biochemical and vascular activities. Circ Res. 2002;90:E17–E24. doi: 10.1161/hh0202.104530. [DOI] [PubMed] [Google Scholar]
- 17.Clark JE, et al. Cardioprotective actions by a water-soluble carbon monoxide-releasing molecule. Circ Res. 2003;93:e2–e8. doi: 10.1161/01.RES.0000084381.86567.08. [DOI] [PubMed] [Google Scholar]
- 18.Motterlini R, Otterbein LE. The therapeutic potential of carbon monoxide. Nat Rev Drug Discov. 2010;9:728–743. doi: 10.1038/nrd3228. [DOI] [PubMed] [Google Scholar]
- 19.Motterlini R, et al. CORM-A1: a new pharmacologically active carbon monoxide-releasing molecule. FASEB J. 2005;19:284–286. doi: 10.1096/fj.04-2169fje. [DOI] [PubMed] [Google Scholar]
- 20.Vera T, Henegar JR, Drummond HA, Rimoldi JM, Stec DE. Protective effect of carbon monoxide-releasing compounds in ischemia-induced acute renal failure. J Am Soc Nephrol. 2005;16:950–958. doi: 10.1681/ASN.2004090736. [DOI] [PubMed] [Google Scholar]
- 21.Ryan MJ, et al. Renal vascular responses to CORM-A1 in the mouse. Pharmacol Res. 2006;54:24–29. doi: 10.1016/j.phrs.2006.01.012. [DOI] [PubMed] [Google Scholar]
- 22.Csongradi E, Juncos LA, Drummond HA, Vera T, Stec DE. Role of carbon monoxide in kidney function: is a little carbon monoxide good for the kidney? Curr Pharm Biotechnol. 2012;13:819–826. doi: 10.2174/138920112800399284. [DOI] [PMC free article] [PubMed] [Google Scholar]
- 23.Suliman HB, Carraway MS, Tatro LG, Piantadosi CA. A new activating role for CO in cardiac mitochondrial biogenesis. J Cell Sci. 2007;120:299–308. doi: 10.1242/jcs.03318. [DOI] [PubMed] [Google Scholar]
- 24.Suliman HB, et al. The CO/HO system reverses inhibition of mitochondrial biogenesis and prevents murine doxorubicin cardiomyopathy. J Clin Invest. 2007;117:3730–3741. doi: 10.1172/JCI32967. [DOI] [PMC free article] [PubMed] [Google Scholar]
- 25.Rhodes MA, et al. Carbon monoxide, skeletal muscle oxidative stress, and mitochondrial biogenesis in humans. Am J Physiol Heart Circ Physiol. 2009;297:H392–H399. doi: 10.1152/ajpheart.00164.2009. [DOI] [PMC free article] [PubMed] [Google Scholar]
- 26.Piantadosi CA, Carraway MS, Babiker A, Suliman HB. Heme oxygenase-1 regulates cardiac mitochondrial biogenesis via Nrf2-mediated transcriptional control of nuclear respiratory factor-1. Circ Res. 2008;103:1232–1240. doi: 10.1161/01.RES.0000338597.71702.ad. [DOI] [PMC free article] [PubMed] [Google Scholar]
- 27.Almeida AS, Queiroga CS, Sousa MF, Alves PM, Vieira HL. Carbon monoxide modulates apoptosis by reinforcing oxidative metabolism in astrocytes: role of Bcl-2. J Biol Chem. 2012;287:10761–10770. doi: 10.1074/jbc.M111.306738. [DOI] [PMC free article] [PubMed] [Google Scholar]
- 28.Tsui TY, et al. Carbon monoxide inhalation rescues mice from fulminant hepatitis through improving hepatic energy metabolism. Shock. 2007;27:165–171. doi: 10.1097/01.shk.0000239781.71516.61. [DOI] [PubMed] [Google Scholar]
- 29.Lancel S, et al. Carbon monoxide rescues mice from lethal sepsis by supporting mitochondrial energetic metabolism and activating mitochondrial biogenesis. J Pharmacol Exp Ther. 2009;329:641–648. doi: 10.1124/jpet.108.148049. [DOI] [PubMed] [Google Scholar]
- 30.Lancel S, et al. Carbon monoxide improves cardiac function and mitochondrial population quality in a mouse model of metabolic syndrome. PLoS One. 2012;7:e41836. doi: 10.1371/journal.pone.0041836. [DOI] [PMC free article] [PubMed] [Google Scholar]
- 31.Sandouka A, et al. Carbon monoxide-releasing molecules (CO-RMs) modulate respiration in isolated mitochondria. Cell Mol Biol (Noisy -le-grand) 2005;51:425–432. [PubMed] [Google Scholar]
- 32.Lo IL, et al. A carbon monoxide-releasing molecule (CORM-3) uncouples mitochondrial respiration and modulates the production of reactive oxygen species. Free Radic Biol Med. 2011;50:1556–1564. doi: 10.1016/j.freeradbiomed.2011.02.033. [DOI] [PubMed] [Google Scholar]
- 33.Cypess AM, Kahn CR. Brown fat as a therapy for obesity and diabetes. Curr Opin Endocrinol Diabetes Obes. 2010;17:143–149. doi: 10.1097/MED.0b013e328337a81f. [DOI] [PMC free article] [PubMed] [Google Scholar]
- 34.Tseng YH, Cypess AM, Kahn CR. Cellular bioenergetics as a target for obesity therapy. Nat Rev Drug Discov. 2010;9:465–482. doi: 10.1038/nrd3138. [DOI] [PMC free article] [PubMed] [Google Scholar]
- 35.Ziouzenkova O, et al. Retinaldehyde represses adipogenesis and diet-induced obesity. Nat Med. 2007;13:695–702. doi: 10.1038/nm1587. [DOI] [PMC free article] [PubMed] [Google Scholar]
- 36.Schwarz EJ, Reginato MJ, Shao D, Krakow SL, Lazar MA. Retinoic acid blocks adipogenesis by inhibiting C/EBPbeta-mediated transcription. Mol Cell Biol. 1997;17:1552–1561. doi: 10.1128/mcb.17.3.1552. [DOI] [PMC free article] [PubMed] [Google Scholar]
- 37.Villarroya F, Iglesias R, Giralt M. Retinoids and retinoid receptors in the control of energy balance: novel pharmacological strategies in obesity and diabetes. Curr Med Chem. 2004;11:795–805. doi: 10.2174/0929867043455747. [DOI] [PubMed] [Google Scholar]
- 38.Kiefer FW, et al. Retinaldehyde dehydrogenase 1 regulates a thermogenic program in white adipose tissue. Nat Med. 2012;18:918–925. doi: 10.1038/nm.2757. [DOI] [PMC free article] [PubMed] [Google Scholar]
- 39.Shukla V, et al. Ghrelin and leptin levels of sojourners and acclimatized lowlanders and high altitude. Nutr Neurosci. 2005;8:161–165. doi: 10.1080/10284150500132823. [DOI] [PubMed] [Google Scholar]
- 40.Vats P, Singh VK, Singh SN, Singh SB. High altitude induced anorexia: effect of changes in leptin and oxidative stress levels. Nutr Neurosci. 2007;10:243–249. doi: 10.1080/10284150701722299. [DOI] [PubMed] [Google Scholar]
- 41.Norese M, et al. Failure of polycythemia-induced increase in arterial oxygen content to supress the anorexic effect of simulated high altitude in the adult rat. High Alt Med Biol. 2002;3:49–57. doi: 10.1089/152702902753639540. [DOI] [PubMed] [Google Scholar]
Associated Data
This section collects any data citations, data availability statements, or supplementary materials included in this article.
Supplementary Materials
Supplementary Figure 1- Representative hematoxylin and eosin (H &E) staining of subcutaneous fat tissues from A) control, B) high fat (HF) + CORM-A1, and C) high fat (HF) + iCORM-A1 treated mice. D) adipocyte number from the different treatment groups (n=3 per group). E) adipocyte size of the different treatment groups (n=3 per group). No differences in adipocyte number or size were detected between the groups.
Supplementary Figure 2- Representative Western blots from subcutaneous fat tissues from control (n=4), high fat (HF) + CORM-A1 (n=6), and high fat (HF) + iCORM-A1 treated mice (n=6). A) Representative blots. B) Levels of ALDH1A1. C) Levels of HO-1. D) Levels of PGC1-α. E) Levels of NRF1. F) Levels of UCP1. *= significant from control mice, P<0.05. #= significant from iCORM-A1 treated and control mice, P<0.05. † = significant from HF + CORM-A1 and control mice, P<0.05.


