

Abstract
Background
Substantial inter-individual variability exists in the disease trajectories of Alzheimer’s disease (AD) patients. Some decline rapidly while others decline slowly and there are no known explanations for this variability. We describe the first genome wide association study to examine rate of cognitive decline in a sample of AD patients with longitudinal measures of cognition.
Methods
The discovery sample was 303 AD cases recruited in the AD Neuroimaging Initiative and the replication sample was 323 AD cases from the Religious Orders Study and Rush Memory and Aging Project. In the discovery sample, Alzheimer’s Disease Assessment Scale-cognitive subscale responses were tested for association with genome-wide SNP data using linear regression. We tested the 65 most significant SNPs from the discovery sample for association in the replication sample.
Results
We identified SNPs in the gene SPON1 whose minor alleles were significantly associated with a more rapid rate of decline (rs11023139, P = 7.0 × 10⁻¹¹) in the discovery sample. A SPON1 SNP 5.5 KB upstream was associated with decline in the replication sample (rs11606345, P=0.002).
Conclusion
SPON1 has not been previously associated with AD risk, but it is plausibly related since the gene product binds to the amyloid precursor protein and inhibits its cleavage by β-secretase. These data suggest that SPON1 may be associated with the differential rate of cognitive decline in AD.
Keywords: Alzheimer’s disease, GWAS, cognitive decline
Introduction
Alzheimer’s disease (AD) is a common form of dementia with an enormous public health impact and for which there are no treatments yet available that can slow progression. Through the efforts of large consortia that pool data from many genome wide association studies (GWAS) of late onset AD, a number of risk genes have been identified and robustly replicated.1–5 Only with samples in excess of 10,000 AD cases and similar numbers of controls, has consensus been reached on the veracity of these risk variants, and with the exception of the APOE ε4 allele, these variants exert very modest effects on overall disease risk, generally with odds ratios less than 1.2. Although these findings have provided valuable insights into AD pathogenesis, the individual predictive value of these small-effect variants is limited.
Although AD is characterized by progressive cognitive deterioration over time, substantial variability exists in the cognitive trajectories of affected individuals. There have been a number of previous studies of factors reported to be associated with cognitive decline in AD patients that have not examined genetic factors. One suggests that the pathological findings such as neurofibrillary tangles, cerebral infarction, and Lewy bodies that mediate normal and pathological age-related cognitive decline also mediate more rapid cognitive decline in some AD patients.6 Other reports have postulated superimposed medical factors to be associated with rate of decline in AD, including diabetes 7 and other vascular risk factors,8 kidney function,9 and muscle strength.10 Two recent candidate gene studies11, 12 tested a limited number of candidate SNPs for association with rate of decline and identified some promising associations.
In this report, we present the first genome wide association analysis of cognitive decline in a sample of AD cases with longitudinal measures of cognition. By limiting the analysis to AD cases, we hoped to identify novel variants specific to rate of decline. While identifying variants explaining the heterogeneity in rate of decline is important for understanding AD pathogenesis, it may also produce novel therapeutic targets that are distinct from those associated with the presence or absence of AD.
Methods
Discovery Sample
Data used in the discovery sample were obtained from the AD Neuroimaging Initiative (ADNI) database.13 ADNI was launched in 2003 with the primary goal of testing whether longitudinal magnetic resonance imaging (MRI), positron emission tomography (PET), and other serum or CSF biomarkers could serve as proxy markers for the progression of mild cognitive impairment (MCI) and early AD. After several waves of recruitment, ADNI has enrolled over 1000 individuals with AD, MCI or who are normal controls. Detailed protocols for subject recruitment and biomarker accrual are available at the ADNI website http://www.adni-info.org/. Briefly, subjects were recruited from over 50 sites across the U.S. and Canada and were measured longitudinally for changes in the brain measured through neuroimaging, biomarkers, and cognitive tests. At the time we accessed the ADNI database, there were 243 normal, 235 MCI and 340 AD subjects in total. The subset of ADNI subjects analyzed for the discovery sample included 303 individuals of European descent who either had AD at baseline or converted to AD during follow-up and had cognitive data. Baseline data was defined as data from the examination with the first clinical diagnosis of AD. Seventeen individuals with age at onset < 60 years (indicative of familial AD) were excluded.
Replication Sample
We selected the 65 most promising SNPs from the discovery sample based upon association with the outcome measure (see below) and biological relevance to AD pathology. These SNPs were evaluated for replication in an independent sample of 323 AD cases combined from the Religious Orders Study (ROS, 174 participants) and the Rush Memory and Aging Project (MAP, 149 participants). The ROS and MAP cohorts were developed and are managed by the same group of investigators at the Rush University Medical Center, and information about study design and data collection in these studies has been previously published.14, 15 Briefly, subjects free of dementia were enrolled and followed annually for cognitive testing that is the same in both studies. We limited our analyses to subjects of European descent with a clinical diagnosis of AD after the age of 60.
Phenotypic Measures
In ADNI, AD was defined as a participant meeting NINCDS/ADRDA criteria for probable AD.16 Data were collected from participants with MCI at baseline and then at 6-month intervals up to 24 months, followed by a visit at 36 and at 48 months. Data were collected from participants with AD at baseline and then at 6, 12, and 24 months (no visit at 18 months or after 24 months, by design). Cognitive decline was measured based on longitudinally collected Alzheimer’s Disease Assessment Scale-cognitive subscale (ADAS-cog) items. The ADAS-cog consists of 11 tasks measuring the disturbances of memory, language, praxis, attention and other cognitive abilities, which are often referred to as the core symptoms of AD. ADAS-cog scores range from 0 to 70, with 0 indicating little or no cognitive impairment and 70 indicating severe cognitive impairment.17
In the replication sample, we analyzed an independent composite measure of global cognition (GCOG)18 based on 17 tests of cognition including immediate and delayed recall of the East Boston Story and Logical Memory II; immediate and delayed recall and recognition of a 10-item word list; a 15-item Boston Naming Test; verbal fluency; 20-item form of the National Adult Reading Test; digit Span Forward and Backward; Digit Ordering; Number Comparison; the oral form of the Symbol Digit Modalities Test; judgment of line orientation; and Raven’s Standard Progressive Matrices. Total scores of each of these tests were transformed into Z-scores and GCOG was the average of those 17 Z-scores.
Genotyping and Quality Control
ADNI participants contributed blood samples from which DNA was extracted and were genotyped using the Illumina Human Genome 610 Quad BeadChips. In the entire ADNI sample (both cases and controls) 67 individuals were excluded due to a genotyped SNP call rate < 98% and 17 individuals were excluded because the onset of their AD began with age < 60 years. For analysis, we imputed the genotypes for all 1000 Genomes19 SNPs using the Markov chain haplotyping software (MACH)20 and retained those with pairwise linkage disequilibrium (r2 >0.80) for further analysis. Imputed genotypes were analyzed as allele dosages adjusted by the quality of the imputation. SNPs were not analyzed if they had minor allele frequencies (MAF) of less than 4%. EIGENSTRAT21 was used to measure principal components of ancestry (continuous measures summarizing genetic variation that were used to adjust for potential admixture in the sample).
For the ROS/MAP replication cohort, DNA was extracted from blood samples or frozen postmortem brain tissue and genotyped on the Affymetrix Genechip 6.0 platform as previously described.22 Only self-declared non-Hispanic Caucasians were genotyped to minimize population heterogeneity. We applied standard quality control measures for subjects (genotype success rate >95%, genotype-derived gender concordant with reported gender, excess inter/intra-heterozygosity) and for SNPs (HWE p > 0.001; MAF > 0.01, genotype call rate > 0.95; misshap test > 1×10⁻⁹) to these data. In all, 13 individuals were removed due to low SNP call rate. Subsequently, EIGENSTRAT21 was used to identify and remove population outliers using default parameters. SNP genotypes were imputed using MACH software (version 1.0.16a)23 and the 1000 Genomes reference panel. At the conclusion of the QC pipeline and imputation, 203 ROS and 171 MAP subjects with AD diagnosis, longitudinal cognitive data (2 or greater evaluations), and quality-controlled genotyping were available for the replication analysis.
Statistical Analysis
We used linear regression models in the discovery cohort to test for genetic association with ADAS-cog. We included every available post-diagnosis cognitive score in these models. The parameters of interest were the β coefficient and P-values from an interaction term between the minor allele dosage at each SNP and the time in months since AD diagnosis. Conceptually, this interaction term tests whether SNP genotype is associated with a different effect of time on cognitive score. We used R version 2.10.0 to evaluate these models with generalized estimating equations to account for the intra-individual correlation in cognitive performance and genotype. Covariates such as APOE ε4 allele count, education, age, gender, and pre-baseline disease duration (for those who already had AD at baseline) were considered and retained in the final models if significant at P < 0.05. We also included the first three principal components of ancestry in our final models. To limit the number of tests performed in the replication sample, we created a list of the 65 most promising SNPs based on the strength of statistical evidence for association, including supporting evidence from flanking SNPs.
In the replication sample, we used general linear mixed models to model global cognition (GCOG) decline over time, adjusted for age at AD diagnosis (P = 0.02), years of education (P < 0.0001), and sex (P = 0.0004). From these models, we obtained estimated random slopes for each individual with at least two recorded measures of global cognition. Using these random slope estimates as outcomes, we then fit linear regression models using PLINK. Only post-diagnosis GCOG scores were used to compute the slopes.
Finally, we meta-analyzed the results from the discovery and replication samples using sample size-weighted P-values and the direction of the effect using METAL.25 Associations were considered significant if P values were less than 5 × 10⁻⁸.
Results
The discovery sample contained 303 AD cases, including 137 who converted during the study period from MCI to AD. The 166 individuals who were diagnosed with AD prior to the first study visit had a mean pre-baseline disease duration of 3.3 years (SD = 2.6). Table 1 shows the baseline characteristics of the discovery and replication samples. The replication sample contained a higher percentage of females, had an older mean age at AD onset, and a lower frequency of APOE ε4 alleles. Only sex and pre-baseline disease duration were associated with rate of decline in ADAS-cog (P < 0.05) and were retained as covariates, with males showing a slower rate of decline and individuals who had AD for a longer period prior to baseline showing more rapid decline. Figure 1 shows Manhattan and QQ plots for ADAS-cog in the discovery cohort. There was a significant genomic inflation factor (λ = 1.079) for the interaction tests for rate of decline, thus all P-values presented were adjusted accordingly. The strongest associations were with relatively rare (MAF = 3%) SNPs in and near the alpha mannosidase gene (MAN2A1) on chromosome 5 (109,230,839 BP, P = 1.0 × 10⁻²⁰). There were also associated variants in the spondin 1 (SPON1) gene on chromosome 11 (rs11023139, P = 7.0 × 10⁻¹¹), with minor alleles associated with more rapid progression (3.8 points per year in ADAS-cog). Figure 2 shows the mean ADAS-cog scores throughout the follow-up period for minor allele carriers vs. non-carriers. We subsequently tested this SNP for association in the discovery sample with the rate of decline in other cognitive measures (the Rey Auditory Verbal Learning Test (RAVLT) and the Mini-Mental State Examination (MMSE)) and also with the rate of amyloid β-40 (Aβ-40) and Aβ-42 accumulation in cerebrospinal fluid (CSF).
Table 1.
Baseline characteristics of the discovery and replication samples
| Variable | Percent or Mean ADNI | Percent or Mean ROS/MAP |
|---|---|---|
| Female | 44% | 70% |
| Age at onset (SD) | 72.8 (7.6) | 85.0 (6.4) |
| APOE ε4 positive (1 or 2 copies) | 67% | 39% |
| Years education (SD) | 15.2 (3.0) | 16.4 (3.6) |
Figure 1. Genome wide association results for cognitive decline measured with ADAS-cog in the discovery sample.
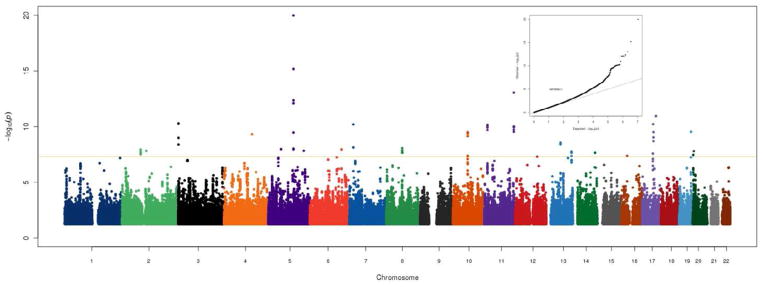
The Y-axis shows the P-values (on the −log10 scale) for each association test. The X-axis is the chromosomal position of each SNP. The gold horizontal line at 5×10⁻⁸ indicates genome-wide significance. The inset shows the Q-Q plot for the adjusted P-values.
Figure 2. Boxplots of ADAS-cog scores in rs11023139 minor allele carriers vs. non-carriers.

The line in each box represents the mean ADAS-cog score at each time point. The box heights indicate the interquartile range, and the whiskers extend to the most extreme data point which is no more than 1.5 times the interquartile range
The AD cases in the replication sample were followed for a mean of 2.5 years post-diagnosis (SD = 2.6 years). We compiled a list of 65 of the top SNP associations in ADNI of rate of decline among people with AD. Table 2 shows the results for these SNPs in the discovery sample. None of the 65 SNPs identified in the discovery sample trended towards association with rate of decline in GCOG in the replication sample at P ≤ 0.05 with the same effect direction. Although rs11023139 in SPON1 was not significantly associated with a change in GCOG slope in ROS/MAP, a different SNP located 5.5 KB upstream did show evidence for association with the same effect direction (rs11606345, P = 0.002). Although these SNPs are in complete LD, the correlation between them is minimal (r2 = 0.002).
Table 2.
Association results for ADAS-cog in ADNI
| Chr | BP | SNP | MAF | SNP Type | Gene | Beta | P |
|---|---|---|---|---|---|---|---|
| 1 | 171557600 | rs2421847 | 0.04 | missense | PRRC2C | 0.26 | 8.71E-07 |
| 1 | 240605052 | rs12091371 | 0.07 | intron | FMN2 | 0.17 | 6.70E-08 |
| 2 | 14987571 | NA | 0.03 | NA | NA | −0.49 | 5.67E-07 |
| 2 | 16965493 | NA | 0.06 | NA | NA | 0.28 | 1.29E-06 |
| 2 | 80281173 | rs6738962 | 0.04 | intron | CTNNA2 | 0.18 | 1.17E-08 |
| 2 | 128396167 | rs78022502 | 0.06 | 3′ UTR | LIMS2 | 0.23 | 1.69E-06 |
| 3 | 39513278 | rs538867 | 0.03 | intron | MOBP | 0.26 | 1.01E-07 |
| 3 | 51095028 | rs9857727 | 0.1 | intron | DOCK3 | 0.18 | 9.70E-06 |
| 3 | 165493136 | rs2668205 | 0.03 | intron | BCHE | 0.27 | 9.63E-06 |
| 4 | 5237153 | rs78647349 | 0.04 | intron | STK32B | 0.3 | 5.24E-07 |
| 4 | 87931404 | rs340635 | 0.03 | intron | AFF1 | 0.23 | 2.18E-07 |
| 5 | 55510656 | rs4700060 | 0.1 | intron | ANKRD55 | 0.21 | 1.07E-08 |
| 5 | 109111327 | rs113689198 | 0.03 | intron | MAN2A1 | 0.3 | 9.65E-09 |
| 5 | 109221026 | rs112724034 | 0.03 | NA | PGAM5P1 | 0.31 | 8.51E-13 |
| 5 | 109230839 | NA | 0.03 | NA | NA | 0.38 | 1.03E-20 |
| 5 | 110719187 | rs77636885 | 0.03 | intron | CAMK4 | 0.3 | 1.80E-06 |
| 5 | 118435127 | rs116348108 | 0.04 | intron | DMXL1 | 0.28 | 8.91E-07 |
| 5 | 126729450 | rs143954261 | 0.04 | intron | MEGF10 | 0.29 | 8.11E-07 |
| 5 | 127382302 | rs146579248 | 0.04 | NA | FLJ33630 | 0.21 | 4.30E-07 |
| 5 | 153837106 | rs148763909 | 0.03 | 3′ UTR | SAP30L | 0.15 | 1.49E-08 |
| 6 | 78357637 | NA | 0.05 | NA | NA | 0.29 | 8.97E-08 |
| 6 | 116056915 | NA | 0.04 | NA | NA | 0.3 | 5.71E-08 |
| 6 | 124326227 | rs117780815 | 0.03 | intron | NKAIN2 | 0.31 | 6.28E-07 |
| 6 | 136288895 | rs9494429 | 0.03 | intron | PDE7B | 0.23 | 5.97E-07 |
| 6 | 136368005 | rs11154851 | 0.03 | intron | PDE7B | 0.25 | 1.14E-08 |
| 6 | 151102830 | rs75253868 | 0.04 | intron | PLEKHG1 | 0.26 | 2.24E-06 |
| 7 | 16707861 | rs58370486 | 0.03 | intron | BZW2 | 0.36 | 6.37E-11 |
| 7 | 16811139 | rs73071801 | 0.04 | intron | TSPAN13 | 0.33 | 9.97E-07 |
| 7 | 25161602 | rs1861525 | 0.03 | 3′ UTR | CYCS | 0.25 | 1.67E-07 |
| 7 | 37365196 | rs2392492 | 0.04 | intron | ELMO1 | 0.32 | 1.15E-06 |
| 7 | 43377276 | rs17172199 | 0.08 | intron | HECW1 | 0.28 | 1.09E-06 |
| 7 | 133747946 | rs11770757 | 0.04 | intron | EXOC4 | 0.16 | 4.76E-07 |
| 8 | 3088173 | rs73660619 | 0.06 | intron | CSMD1 | 0.26 | 7.45E-07 |
| 8 | 53214265 | rs7009219 | 0.06 | intron | ST18 | 0.16 | 5.12E-07 |
| 8 | 68761014 | NA | 0.05 | NA | NA | 0.28 | 8.81E-09 |
| 9 | 132939792 | rs4836694 | 0.11 | intron | NCS1 | 0.21 | 7.15E-07 |
| 10 | 64635265 | NA | 0.04 | NA | NA | 0.26 | 3.90E-10 |
| 10 | 122279476 | rs118048115 | 0.04 | intron | PPAPDC1A | 0.34 | 6.41E-07 |
| 11 | 14224346 | rs11023139 | 0.05 | intron | SPON1 | 0.31 | 7.00E-11 |
| 11 | 14338703 | rs61883963 | 0.06 | intron | RRAS2 | 0.26 | 5.19E-07 |
| 11 | 14556220 | rs34162548 | 0.05 | intron | PSMA1 | 0.27 | 1.14E-06 |
| 11 | 37033930 | NA | 0.06 | NA | NA | 0.16 | 8.22E-07 |
| 11 | 110499253 | rs326946 | 0.17 | intron | ARHGAP20 | 0.16 | 6.81E-07 |
| 11 | 128185570 | NA | 0.03 | NA | NA | 0.31 | 8.92E-14 |
| 12 | 51878760 | rs147845115 | 0.03 | intron | SLC4A8 | 0.29 | 2.84E-07 |
| 12 | 94235165 | rs61144803 | 0.04 | intron | CRADD | 0.16 | 5.02E-08 |
| 12 | 101221239 | rs1399439 | 0.04 | intron | ANO4 | 0.2 | 3.51E-07 |
| 13 | 61617648 | NA | 0.07 | NA | NA | 0.24 | 2.83E-09 |
| 13 | 93945858 | rs143258881 | 0.03 | intron | GPC6 | 0.29 | 6.73E-08 |
| 13 | 109473946 | rs17393344 | 0.06 | intron | MYO16 | 0.26 | 1.69E-08 |
| 14 | 95764564 | rs115102486 | 0.03 | intron | CLMN | 0.31 | 2.28E-08 |
| 15 | 27712644 | rs74006954 | 0.03 | intron | GABRG3 | 0.28 | 2.74E-07 |
| 15 | 58730639 | rs17301739 | 0.07 | intron | LIPC | 0.28 | 1.45E-06 |
| 16 | 24675589 | rs8045064 | 0.05 | NA | FLJ45256 | 0.21 | 4.27E-08 |
| 16 | 77876763 | rs9934540 | 0.03 | intron | VAT1L | 0.25 | 3.55E-07 |
| 17 | 45888374 | rs62076103 | 0.07 | intron | OSBPL7 | 0.26 | 3.32E-07 |
| 17 | 45905622 | rs62076130 | 0.06 | intron | MRPL10 | 0.26 | 7.82E-07 |
| 17 | 45930539 | rs4794202 | 0.08 | intron | SP6 | 0.19 | 7.99E-08 |
| 17 | 47134762 | NA | 0.03 | NA | NA | 0.3 | 6.07E-11 |
| 17 | 48692082 | rs117964204 | 0.04 | intron | CACNA1G | 0.28 | 9.44E-10 |
| 17 | 59292436 | rs72832584 | 0.05 | intron | BCAS3 | 0.3 | 1.14E-11 |
| 19 | 51422877 | NA | 0.05 | NA | NA | 0.34 | 3.00E-10 |
| 19 | 51430596 | rs7245858 | 0.04 | missense | LOC390956 | 0.28 | 2.03E-06 |
| 20 | 2384972 | rs34972666 | 0.11 | intron | TGM6 | 0.23 | 3.46E-08 |
| 22 | 44526105 | rs75617873 | 0.03 | intron | PARVB | 0.17 | 5.01E-07 |
Type = type of SNP
BP = base pair location in release 19, build 135 of the human genome in the dbSNP database
SNPs in bold were genotyped
MAF = minor allele frequency in ADNI
Beta = Change in ADAS-cog per copy of the minor allele per month with AD, positive numbers indicate slower decline and negative numbers indicate more rapid decline
P = P-value after correction for a genomic inflation factor of 1.079
Finally, we evaluated whether or not there was an association with cognitive decline for all SNPs identified as significantly associated with AD at P < 10−4 (supplementary Table 5 in Naj et al.)4 in the recently published results from the Alzheimer Disease Genetics Consortium (ADGC) study that contains more than 19,490 AD cases and 36,770 controls. Five of the 447 AD-associated SNPs selected in this manner were associated with rate of decline in ADAS-cog at a significance level of P < 0.05 in the discovery sample. The minor alleles for a SNP in PVRL2 (rs440277, P = 0.003) was associated with a lower risk of developing AD and a slower rate of decline, as was a SNP in CD33 (rs1354106, P = 0.04). In the replication sample, however, there were three SNPs near the gene gap junction protein, beta 5 (GJB5) that were associated with GCOG. The strongest effect was from rs12048230 (P = 1.9 × 10⁻⁷) and was associated with a slower rate of decline and lower risk of AD in the ADGC samples.
Discussion
This study is the first to search for and discover unbiased associations between genome-wide genetic variants and rate of cognitive decline in AD cases and despite the small sample size, a number of intriguing candidate genes were identified. The most interesting candidate gene we identified is SPON1, both because variants were significantly associated in both discovery and replication cohort, and because of its biological plausibility. The protein SPON1 binds the central terminal domain of the amyloid precursor protein (APP) and inhibits its cleavage by the β-secretase complex (BACE).26 Although all the common (MAF > 3%) associated SNPs in SPON1 are all intronic, there is a rare (MAF = 1%) missense mutation that is strongly associated with rate of decline. The most significant associated SNP in the gene was also associated (much less significantly) with more rapid rate of decline in the RAVLT (P = 0.008) and the MMSE (P = 0.003), and the same SNP was associated with a slower rate of Aβ-40 (but not Aβ-42) accumulation in cerebrospinal fluid (CSF) (P = 0.001). Although the directions of the effects on cognition and Aβ-40 accumulation appear to be opposite, it has previously been suggested that slower accumulation of Aβ in CSF is indicative of more accumulation in the brain27.
Several of the other significant association results are in genes with functions relevant to neuronal maintenance and neurotransmission (EXOC4, GABRG3, VAT1L), with many involved in Ca2+ signaling and homeostasis (CAMK4, CYCS, NCS1, CACNA1G). Other notable candidates for association with variable rate of decline in AD patients are involved in neuronal apoptosis signaling (ELMO1, CYCS), while two are involved in lipid homeostasis (LIPC28, OSBPL7).
Our results require confirmation in larger datasets, but support the intriguing possibility that previously unknown genetic variants may influence the rate of decline in AD. Larger cohorts with longitudinal data, providing improved statistical power, are being collected to provide more definitive replication.
The strengths of this analysis were the unbiased nature of the GWAS, a discovery and a replication sample, and a statistical model that allowed us to specifically measure test for a differential rate of decline (rather than cognitive function in general) while maximizing the information content of the data (use of repeated measures). Our study was limited by small sample sizes in both datasets, and by the fact that the phenotype of cognitive decline was measured and analyzed differently in the discovery and replication cohorts. A full description of these differences is beyond the scope of this paper, but there is face validity to the assumption that both represent a general measure of overall cognitive ability, since both the ADAS-Cog, and the GCOG incorporate measures on a variety of cognitive domains. Our experience with the ADNI data indicates that the genetic association tests for decline are highly sensitive to the assessment scale used.
One of the previous candidate gene studies of rate of decline in AD cases identified SNP rs1868402 in a gene that encodes the regulatory sub-unit of protein phosphatase B (PPP3R1) that was not associated with risk for AD or age at onset, but was associated with rate of decline as measured by the clinical dementia rating sum of boxes (CDR-SB) and also tau phosphorylated at threonine 181 (ptau181) levels measured in CSF, a known biomarker for AD.12 The other candidate gene study found two SNPs (rs3746319, rs8192708) associated with global cognition, one the zinc finger protein 224 gene (ZNF224) and one in the gene encoding phosphoenolpyruvate carboxykinase (PCK1).11 Examining these 3 SNPs, we found a trend towards association with ADAS-cog for rs1868402 (P = 0.14) in the same direction as the previous report.12 The significant results in that study were generated under a dominant model and only in individuals with low levels of Aβ42 in CSF. Given the different phenotypes, subsets of the ADNI data, and statistical and genetic models used for analysis across these studies, the trend towards replication in this analysis substantially increases the evidence that PPP3R1 variants may mediate AD progression through pathways related to ptau181. In the present study, there was also a trend towards association with rs3746319 (P = 0.08) but not rs8192708 with change in ADAS-cog.
In summary, we utilized a discovery sample and a replication sample to perform the first genome wide study to assess genetic variants associated with cognitive rate of decline in people with AD. We identified several SNPs with statistical evidence in genes that have not been previously associated with AD risk, most notably SPON1 which may contain variants whose minor alleles slow disease progression by lowering the amount of extracellular Aβ-40. A different, nearby SNP was associated with decline in an independent sample using a different measure of cognition. Novel genetic associations with rate of decline in AD may provide new insights into the pathophysiology of AD and new targets for therapeutic development.
Acknowledgments
Funding Support:
This research was supported by grants HG02213 and AG027841 (Green) from the National Institutes of Health and a Mentored New Investigator Grant from the Alzheimer’s Association (Sherva/Green).
Data collection and sharing for this project was funded by the Alzheimer’s Disease Neuroimaging Initiative (ADNI) (National Institutes of Health Grant U01 AG024904). ADNI is funded by the National Institute on Aging, the National Institute of Biomedical Imaging and Bioengineering, and through generous contributions from the following: Abbott; Alzheimer’s Association; Alzheimer’s Drug Discovery Foundation; Amorfix Life Sciences Ltd.; AstraZeneca; Bayer HealthCare; BioClinica, Inc.; Biogen Idec Inc.; Bristol-Myers Squibb Company; Eisai Inc.; Elan Pharmaceuticals Inc.; Eli Lilly and Company; F. Hoffmann-La Roche Ltd and its affiliated company Genentech, Inc.; GE Healthcare; Innogenetics, N.V.; Janssen Alzheimer Immunotherapy Research & Development, LLC.; Johnson & Johnson Pharmaceutical Research & Development LLC.; Medpace, Inc.; Merck & Co., Inc.; Meso Scale Diagnostics, LLC.; Novartis Pharmaceuticals Corporation; Pfizer Inc.; Servier; Synarc Inc.; and Takeda Pharmaceutical Company. The Canadian Institutes of Health Research is providing funds to support ADNI clinical sites in Canada. Private sector contributions are facilitated by the Foundation for the National Institutes of Health (www.fnih.org). The grantee organization is the Northern California Institute for Research and Education, and the study is coordinated by the Alzheimer’s Disease Cooperative Study at the University of California, San Diego. ADNI data are disseminated by the Laboratory for Neuro Imaging at the University of California, Los Angeles. This research was also supported by NIH grants P30 AG010129, K01 AG030514, and the Dana Foundation.
Footnotes
Publisher's Disclaimer: This is a PDF file of an unedited manuscript that has been accepted for publication. As a service to our customers we are providing this early version of the manuscript. The manuscript will undergo copyediting, typesetting, and review of the resulting proof before it is published in its final citable form. Please note that during the production process errors may be discovered which could affect the content, and all legal disclaimers that apply to the journal pertain.
References
- 1.Harold D, Abraham R, Hollingworth P, et al. Genome-wide association study identifies variants at CLU and PICALM associated with Alzheimer’s disease. Nat Genet. 2009;41:1088–1093. doi: 10.1038/ng.440. [DOI] [PMC free article] [PubMed] [Google Scholar]
- 2.Lambert J, Heath S, Even G, et al. Genome-wide association study identifies variants at CLU and CR1 associated with Alzheimer’s disease. Nat Genet. 2009;41:1094–1099. doi: 10.1038/ng.439. [DOI] [PubMed] [Google Scholar]
- 3.Bruck S, Huber T, Ingham R, et al. Identification of a novel inhibitory actin-capping protein binding motif in CD2-associated protein. J Biol Chem. 2006;281:19196–19203. doi: 10.1074/jbc.M600166200. [DOI] [PMC free article] [PubMed] [Google Scholar]
- 4.Naj AC, Jun G, Beecham GW, et al. Common variants at MS4A4/MS4A6E, CD2AP, CD33 and EPHA1 are associated with late-onset Alzheimer’s disease. Nat Genet May. 2011;43(5):436–441. doi: 10.1038/ng.801. [DOI] [PMC free article] [PubMed] [Google Scholar]
- 5.Hollingworth P, Harold D, Sims R, et al. Common variants at ABCA7, MS4A6A/MS4A4E, EPHA1, CD33 and CD2AP are associated with Alzheimer’s disease. Nat Genet May. 2011;43(5):429–435. doi: 10.1038/ng.803. [DOI] [PMC free article] [PubMed] [Google Scholar]
- 6.Wilson R, Leurgans S, Boyle P, Schneider J, Bennett D. Neurodegenerative basis of age-related cognitive decline. Neurology. 2010;75(12):1070–1078. doi: 10.1212/WNL.0b013e3181f39adc. [DOI] [PMC free article] [PubMed] [Google Scholar]
- 7.Verdelho A, Madureira S, Moleiro C, et al. White matter changes and diabetes predict cognitive decline in the elderly: The LADIS study. Neurology. 2010;75(2):160–167. doi: 10.1212/WNL.0b013e3181e7ca05. [DOI] [PubMed] [Google Scholar]
- 8.Kume K, Hanyu H, Sato T, et al. Vascular risk factors are associated with faster decline of Alzheimer disease: A longitudinal SPECT study. J Neurol. 2011 doi: 10.1007/s00415-011-5927-y. [DOI] [PubMed] [Google Scholar]
- 9.Menkes D, Buchman A, Shah R, Boyle P, Bennett D. Kidney function is associated with the rate of cognitive decline in the elderly. Neurology. 2010;74:1656–1657. doi: 10.1212/WNL.0b013e3181d8a4ef. [DOI] [PubMed] [Google Scholar]
- 10.Boyle P, Buchman A, Wilson R, Leurgans S, Bennett D. Association of muscle strength with the risk of Alzheimer disease and the rate of cognitive decline in community-dwelling older persons. Arch Neurol. 2009;66:1339–1344. doi: 10.1001/archneurol.2009.240. [DOI] [PMC free article] [PubMed] [Google Scholar]
- 11.Shulman J, Chibnik L, Aubin C, Schneider J, Bennett D, De Jager P. Intermediate phenotypes identify divergent pathways to Alzheimer’s disease. PLoS One. 2010;21(5):e11244. doi: 10.1371/journal.pone.0011244. [DOI] [PMC free article] [PubMed] [Google Scholar]
- 12.Cruchaga C, Kauwe J, Mayo K, et al. SNPs associated with cerebrospinal fluid phospho-tau levels influence rate of decline in Alzheimer’s disease. PLoS Genet. 2010;6(9) doi: 10.1371/journal.pgen.1001101. [DOI] [PMC free article] [PubMed] [Google Scholar]
- 13.Weiner MW, Aisen PS, Jack CR, Jr, et al. The Alzheimer’s disease neuroimaging initiative: Progress report and future plans. Alzheimers Dement. 2010 May;6(3):202–211. e207. doi: 10.1016/j.jalz.2010.03.007. [DOI] [PMC free article] [PubMed] [Google Scholar]
- 14.Bennett D, Schneider J, Arvanitakis Z, et al. Neuropathology of older persons without cognitive impairment from two community-based studies. Neurology. 2006 Jun 27;66(12):1837–1844. doi: 10.1212/01.wnl.0000219668.47116.e6. [DOI] [PubMed] [Google Scholar]
- 15.Bennett D, Schneider J, Buchman A, Mendes de Leon C, Bienias J, Wilson R. The Rush Memory and Aging Project: Study design and baseline characteristics of the study cohort. Neuroepidemiology. 2005;25(4):163–175. doi: 10.1159/000087446. [DOI] [PubMed] [Google Scholar]
- 16.McKhann GM, Drachman D, Folstein MF, Katzman R, Price D, Stadlan EM. Clinical diagnosis of Alzheimer’s disease: Report of the NINCDS-ADRDA work group. Neurology. 1984;34:939–944. doi: 10.1212/wnl.34.7.939. [DOI] [PubMed] [Google Scholar]
- 17.Rosen W, Mohs RC, Davis KL. A new rating scale for Alzheimer’s disease. Am J Psychiatry. 1984;141(11):1356–1364. doi: 10.1176/ajp.141.11.1356. [DOI] [PubMed] [Google Scholar]
- 18.Wilson RS, Beckett LA, Barnes LL, et al. Individual differences in rates of change in cognitive abilities of older persons. Psychol and Aging. 2002;17(2):179–193. [PubMed] [Google Scholar]
- 19.The 1000 Genomes Project; A map of the human genome variation from population-scale sequencing. Nature. 467:1061–1073. doi: 10.1038/nature09534. Available at: www.1000genomes.org. [DOI] [PMC free article] [PubMed] [Google Scholar]
- 20.Li M, Boehnke M, Abecasis G. Efficient study designs for test of genetic association using sibship data and unrelated cases and controls. Am J Hum Genet. 2006;78(5):778–792. doi: 10.1086/503711. [DOI] [PMC free article] [PubMed] [Google Scholar]
- 21.Price AL, Patterson NJ, Plenge RM, Weinblatt ME, Shadick NA, Reich D. Principal components analysis corrects for stratification in genome-wide association studies. Nat Genet Aug. 2006;38(8):904–909. doi: 10.1038/ng1847. [DOI] [PubMed] [Google Scholar]
- 22.Chibnik L, Shulma J, Leurgans S, et al. CR1 is associated with amyloid plaque burden and age-related cognitive decline. Annals of Neurology. 2011;69(3):560–569. doi: 10.1002/ana.22277. [DOI] [PMC free article] [PubMed] [Google Scholar]
- 23.Scott LJ, Mohlke KL, Bonnycastle LL, et al. A genome-wide association study of type 2 diabetes in Finns detects multiple susceptibility variants. Science. 2007 Jun 1;316(5829):1341–1345. doi: 10.1126/science.1142382. [DOI] [PMC free article] [PubMed] [Google Scholar]
- 24.Frazer KA, Ballinger DG, Cox DR, et al. A second generation human haplotype map of over 3.1 million SNPs. Nature. 2007 Oct 18;449(7164):851–861. doi: 10.1038/nature06258. [DOI] [PMC free article] [PubMed] [Google Scholar]
- 25.Willer CJ, Li Y, Abecasis GR. METAL: Fast and efficient meta-analysis of genomewide association scans. Bioinformatics. 2010 Sep 1;26(17):2190–2191. doi: 10.1093/bioinformatics/btq340. [DOI] [PMC free article] [PubMed] [Google Scholar]
- 26.Ho A, Sudhof TC. Binding of F-spondin to amyloid-beta precursor protein: A candidate amyloid-beta precursor protein ligand that modulates amyloid-beta precursor protein cleavage. Proc Natl Acad Sci U S A. 2004 Feb 24;101(8):2548–2553. doi: 10.1073/pnas.0308655100. [DOI] [PMC free article] [PubMed] [Google Scholar]
- 27.Strozyk D, Blennow K, White LR, Launer LJ. CSF Abeta levels correlate with amyloid-neuropathology in a population-based autopsy study. Neurology. 2003 Feb 25;60(4):652–656. doi: 10.1212/01.wnl.0000046581.81650.d0. [DOI] [PubMed] [Google Scholar]
- 28.Cai SJ, Wong DM, Chen SH, Chan L. Structure of the human hepatic triglyceride lipase gene. Biochemistry. 1989 Nov 14;28(23):8966–8971. doi: 10.1021/bi00449a002. [DOI] [PubMed] [Google Scholar]