Abstract
Introduction
Stasis filling, defined as delayed, weak, and persistent opacification of proximal segments of the cerebral arteries, is frequently found in brain dead patients. This phenomenon causes a major problem in the development of reliable computed tomographic angiography (CTA) protocol in the diagnosis of brain death (BD). The aim of our study was to characterize stasis filling in the diagnosis of BD. To achieve this, we performed a dynamic evaluation of contrast enhancement of the cerebral and extracranial arteries in patients with BD and controls.
Methods
Study population included 30 BD patients, who showed stasis filling in computed tomographic perfusion (CTP) series. Thirty patients, after clipping of an intracranial aneurysm, constituted the control group. The study protocol consisted of CTA, CTP, and angiography. Time–density curves (TDCs) of cerebral and extracranial arteries were generated using 40-s series of CTP.
Results
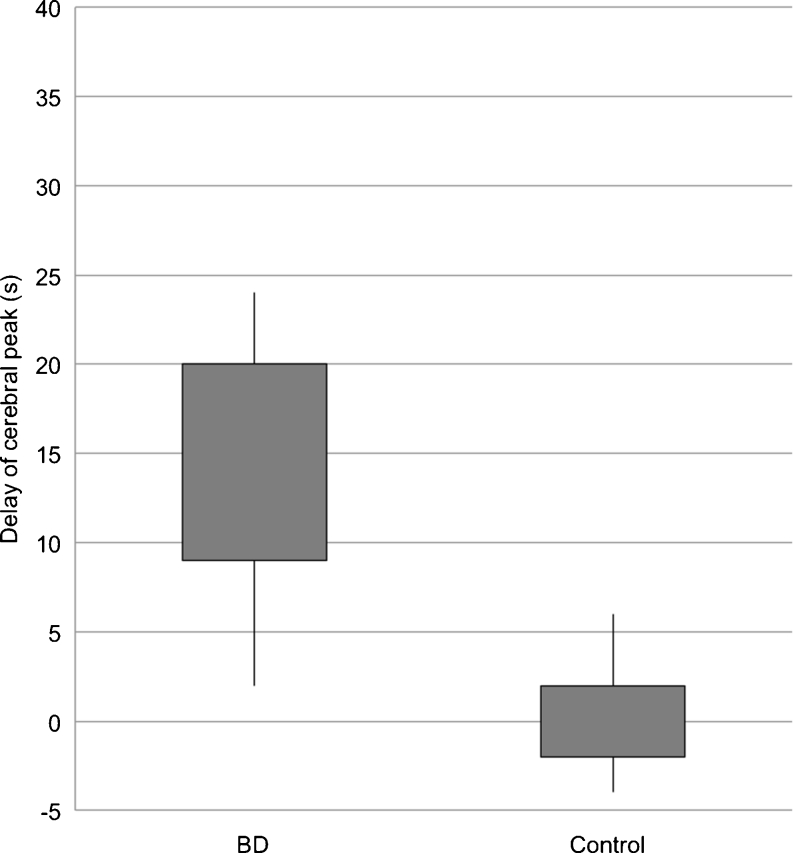
Cerebral TDCs in BD patients represented flat curves in contrast to TDCs in controls, which formed steep and narrow Gaussian curves. We found longer time to peak enhancement in BD patients than in controls (32 vs. 21 s; p < 0.0001). In BD patients, peak enhancement in the cerebral arteries occurred with a median delay of 14.5 s to peak in extracranial arteries, while no delay was noted in controls (p < 0.0001). Cerebral arteries in BD patients showed lower peak enhancement than controls (34.5 vs. 81.5 HU; p < 0.0001). In all BD patients, CTP revealed zero values of cerebral blood flow and volume. Angiography showed stasis filling in 14 (46.7 %) and non-filling in 16 (53.3 %) cases.
Conclusion
A confrontation of stasis filling with CTP results showed that stasis filling is not consistent with preserved cerebral perfusion, thus does not preclude diagnosis of BD.
Keywords: Brain death, Stasis filling, Catheter angiography, Computed tomographic angiography, Computed tomographic perfusion
Background
According to the national regulations regarding diagnostic criteria of brain death (BD), instrumental confirmatory tests should be used in certain clinical situations, such as intoxications, infratentorial processes, extensive facial damage, children younger than 2 years of age, or any case in which clinical examinations are inadequate [1]. Electrophysiological tests are often unavailable due to limited access to proper equipment and competent specialists. Therefore, cerebral perfusion tests are methods of choice. Two of them, catheter angiography and computed tomographic angiography (CTA), are based on the detection of contrast enhancement of cerebral vessels. In these examinations, two patterns are observed in patients with BD. First is a non-filling phenomenon, which means a complete absence of contrast above the carotid siphons and foramen magnum. Second is a delayed, weak, and persistent opacification of proximal segments of the cerebral arteries not reaching cortical branches. Kricheff et al. used a term stasis filling to describe this phenomenon [2]. Stasis filling causes a significant problem in interpretation of CTA results in the diagnosis of BD. Since 1998, when CTA was proposed as the new imaging technique in the diagnostics of BD, a consensus on its interpretation criteria has not been reached [3]. An analysis of stasis filling in a dynamic series of computed tomographic perfusion (CTP) can provide valuable information on the interpretation of CTA results and relation of this phenomenon to brain perfusion.
The aim of this prospective study was to characterize stasis filling phenomenon in the diagnosis of BD. To achieve this, we performed a dynamic evaluation of contrast enhancement of the cerebral and extracranial arteries in patients with BD and control subjects with the use of the 40-s series of CTP scans. We also confronted stasis filling pattern with CTP findings to assess the relevance of this phenomenon to brain perfusion.
Material and methods
We examined 67 patients who fulfilled clinical BD criteria according to the national regulations (coma, apnea, and no brainstem reflexes) [1]. The examination protocol consisted of CTA, followed by CTP and catheter angiography. Thirty-seven subjects were excluded due to lack of contrast enhancement in the intracranial arteries in CTP series. Finally, 30 (44.8 %) patients, in whom analysis of CTP series enabled us to identify contrast-enhanced intracranial arteries, were enrolled in the study. The population consisted of 18 men and 12 women with a median age of 54.5 years (range, 22–84 years). Initial causes of coma were intracerebral hemorrhage (n = 16), subarachnoid hemorrhage (n = 11), cerebral edema (n = 2), and ischemic stroke (n = 1). Decompressive craniectomy was performed in 19 (63 %) included patients. Among 37 excluded patients, there were only four (11 %) with craniectomy. All patients were managed in the intensive care units of two university hospitals and one multi-profile provincial hospital. During all the examinations, the patients were normoventilated and mean arterial blood pressure (MABP) maintained at greater than 80 mmHg. The elapsed time between the onset of BD symptoms and the radiological examination ranged between 6 and 48 h. Delay was sometimes caused by a prolonged initial observation due to prior use of sedatives and sometimes the limited availability of an angiographic team. The majority of patients became actual organ donors. In some cases, organ donation was not possible for medical reasons and occasionally because of a failure to obtain permission from relatives. In such situations, families were informed about the termination of futile therapy, and ventilators were legally switched off. The demographic and epidemiological characteristics of BD patients are presented in Table 1.
Table 1.
Demographic and clinical characteristics of BD patients
| Number | Sex | Age (years) | Diagnosis | Craniectomy | Examined artery | Stasis filling in angiography |
|---|---|---|---|---|---|---|
| 1 | M | 56 | ICH | MCA | ||
| 2 | M | 71 | SAH | MCA | + | |
| 3 | M | 73 | ICH | + | MCA | + |
| 4 | F | 49 | SAH | + | ACA | |
| 5 | F | 29 | SAH | ACA | ||
| 6 | M | 40 | IS | ACA | ||
| 7 | F | 66 | ICH | MCA | ||
| 8 | M | 84 | SAH | + | MCA | |
| 9 | M | 53 | ICH | MCA | ||
| 10 | F | 67 | ICH | + | MCA | + |
| 11 | M | 63 | CE | MCA | ||
| 12 | F | 58 | SAH | + | MCA | |
| 13 | M | 34 | SAH | + | ACA | |
| 14 | M | 34 | SAH | + | MCA | + |
| 15 | M | 78 | ICH | MCA | + | |
| 16 | M | 39 | ICH | + | MCA | + |
| 17 | F | 38 | SAH | + | MCA | |
| 18 | F | 74 | SAH | ACA | + | |
| 19 | F | 75 | ICH | MCA | + | |
| 20 | F | 40 | SAH | + | MCA | + |
| 21 | F | 22 | ICH | + | MCA | + |
| 22 | F | 34 | ICH | + | MCA | |
| 23 | M | 50 | ICH | + | ACA | + |
| 24 | M | 44 | SAH | + | MCA | + |
| 25 | M | 51 | ICH | + | PCA | + |
| 26 | M | 71 | ICH | + | MCA | |
| 27 | F | 41 | CE | + | MCA | |
| 28 | M | 59 | ICH | MCA | ||
| 29 | M | 62 | ICH | + | MCA | |
| 30 | M | 56 | ICH | + | MCA | + |
IS ischemic stroke, CE cerebral edema, ACA anterior cerebral artery, MCA middle cerebral artery, PCA posterior cerebral artery
The control group consisted of 30 patients who underwent surgical clipping of an intracranial aneurysm. The population consisted of 14 men and 16 women with a median age of 53 years (range, 18–65 years). They were examined only with CTP, without CTA, or catheter angiography. CTP was performed 8–10 days after neurosurgical clipping of the middle cerebral or anterior communicating artery aneurysms. During all the examinations, MABP stayed above 80 mmHg. None of the control subjects presented any signs of BD, with normal pCO2 and pO2.
CTA
All CTA and aortocervical angiography examinations in BD patients were performed using the same methodology as described previously [4, 5]. We used Siemens Sensation 64 (Siemens AG, Erlangen, Germany) to perform CTA. Non-enhanced CT was followed by an i.v. injection of 80 mL of iodinated contrast medium at a flow rate of 4 mL/s. Then CTA was carried out in three phases, which were manually programmed with fixed delays of 25, 40, and 60 s after contrast injection.
CTP
We used the same scanner—Siemens Sensation 64 (Siemens AG, Erlangen, Germany)—to perform CTP in both groups. In BD patients, the time interval between CTA and CTP ranged from 1 to 15 min. After i.v. administration of 50 mL of the contrast medium at a flow rate of 5 mL/s, a series of scans were made at the level of the basal and thalamic nuclei above the basal cisterns. The series consisted of 40 scans with one scan per second. Scan range in z-axis was 28.8 mm. Detailed protocol is presented in Table 2.
Table 2.
Technical parameters of CTP examination
| Acquisition | |
|---|---|
| Tube voltage (kVp) | 80 |
| Tube current (mAs) | 270 |
| Rotation time (s) | 1.0 |
| Collimation (mm) | 24 × 1.2 |
| Scan range (mm) | 28.8 |
| Cycle time (s) | 1.0 |
| Scan time (s) | 40 |
| Automatic dose modulation | Off |
| Reconstruction | |
| Slice width (mm) | 3 × 9.6 |
| FOV (mm) | 220 |
| Matrix | 512 × 512 |
| RECON algorithm | H30s |
| Contrast injection | |
| Volume (mL) | 50 |
| Flow rate (mL/s) | 5 |
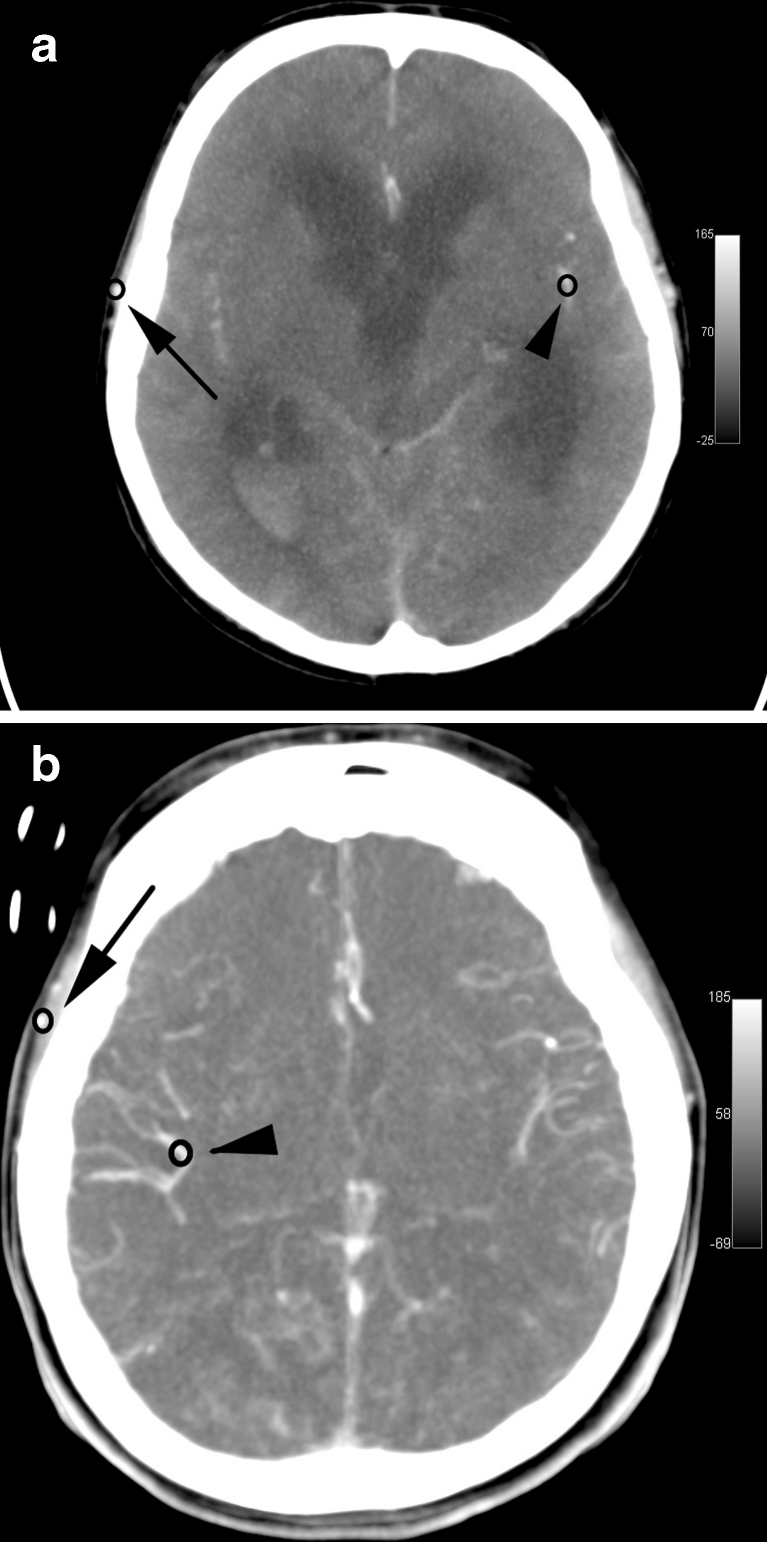
The dynamic series of CTP scans were analyzed in two different ways. In the first part of post-processing, two small circular 0.25–0.3-cm2 regions of interest (ROIs) were positioned in each CTP series of scans. The first ROI was placed on the superficial temporal artery. The second ROI covered the cerebral artery in the most distal visible segment (see Fig. 1). Among the cerebral arteries, MCA was preferred. This artery was visible in all control examinations (contralateral artery to the clipped aneurysm was always chosen) and 23 examinations of BD patients. Among the remaining seven examinations in six cases, the only opacified cerebral artery was ACA and in one case PCA (see Table 1). ROIs were automatically propagated over the entire series of scans. For each ROI, time–density curve (TDC) was plotted. Calculation was performed using the OsiriX v.5.5.1 software (Pixmeo Sarl, Bernex, Switzerland).
Fig. 1.
Axial CTP scans in MIP reconstruction from 40-s series in a BD patient (a) and in a control subject (b). ROIs are positioned in the distal segment of MCA (arrowhead) and in the superficial temporal artery (arrow)
In BD patients, the same dynamic series of scans were used for measurements of cerebral blood flow (CBF) and cerebral blood volume (CBV) with the Multimodality Workplace and syngo VE40A software package (Siemens AG, Erlangen, Germany). This software is based on a maximum slope method, which assumes that there is no venous outflow from the tissue volume under consideration during the time of observation. Therefore, the lack of venous outflow in BD patients was not an obstacle, and calculation of CBF and CBV was feasible in all cases. Arterial input function was optimized in relation to user-selected arteries. We chose the same cerebral arteries, which were used in the first part of post-processing for calculation of TDCs. CBF and CBV values were measured in circular 2.5–3.5-cm2 ROIs placed in the cortical regions of the frontal, temporal, occipital lobes, and basal nuclei of both hemispheres with exclusion of major blood vessels.
Catheter angiography
All BD patients underwent aortocervical angiography as the last part of radiological workup. Angiography was performed with a delay of 15 min to 3 h after CTP. We used two angiographic systems: Fluorospot Top and Axiom Artis (Siemens AG, Germany). A typical femoral approach was used in all cases. After positioning a Pigtail 4–5-F catheter in the ascending aorta, 30 mL of contrast was injected at a flow rate of 15 mL/s. We registered 30–50 s series with a frequency of 2 f/s visualizing head and neck area with the use of a digital subtraction technique. According to the national guidelines, cerebral circulatory arrest was diagnosed in two situations:
Non-filling of intracranial vessels with preserved flow in the external carotid arteries
Stasis filling—delayed, weak, and persistent opacification of the proximal cerebral arterial segments, without opacification of the cortical branches or venous outflow [1]
Data collection
Demographic data recorded for BD patients and control subjects were age and sex. In addition, for BD patients, we registered initial cause of coma and the presence of craniectomy. For each extracranial and cerebral ROI in the CTP series, the following parameters were measured:
Baseline density: CT density on the first scan
Enhancement at 20, 30, and 40 s: difference between density at the time point of 20, 30, and 40 s and baseline density
Peak enhancement: difference between the highest density and baseline density
C/E peak ratio: ratio of peak enhancement in a cerebral artery to peak enhancement in the superficial temporal artery
Time to peak: period of time in seconds from the time when the first image was acquired to the time when the highest density was reached
Delay of cerebral peak: period of time in seconds from peak enhancement in the superficial temporal artery to the peak enhancement in the cerebral artery
In BD patients, the additional recorded data were values of CBF, CBV, and results of catheter angiography classified as non-filling or stasis filling.
Statistical analysis
Non-parametric Mann–Whitney test was used for the analysis of differences between the groups because the distributions of most of the quantitative variables were significantly different from the normal distribution (p < 0.05, Shapiro–Wilk test). P < 0.05 was considered statistically significant. Statistica 10 software (StatSoft, Inc., Tulsa, OK, USA) was used for the statistical analysis.
Results
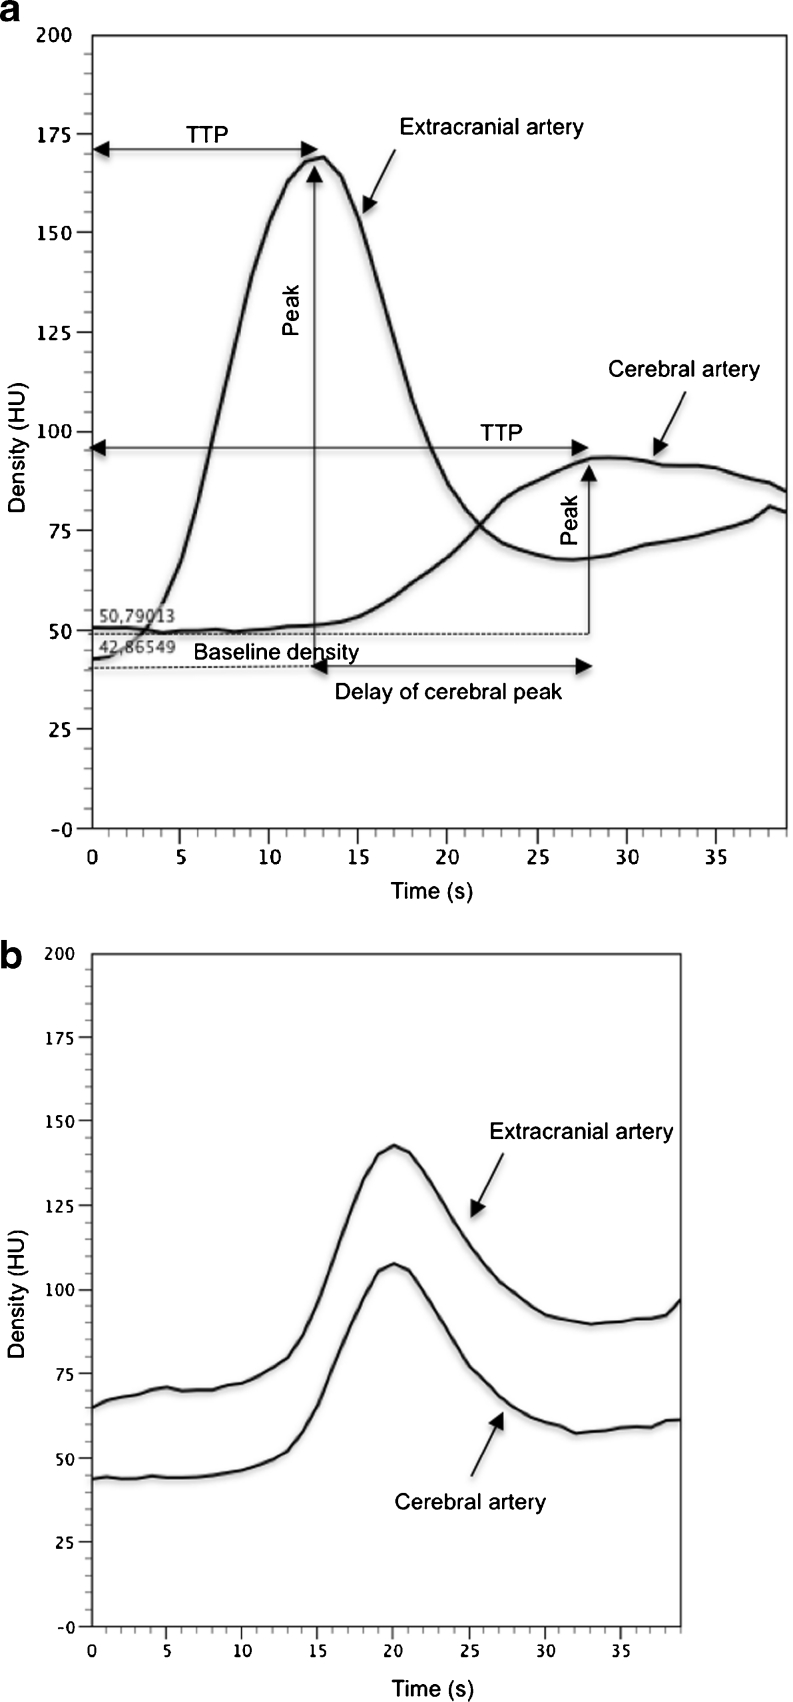
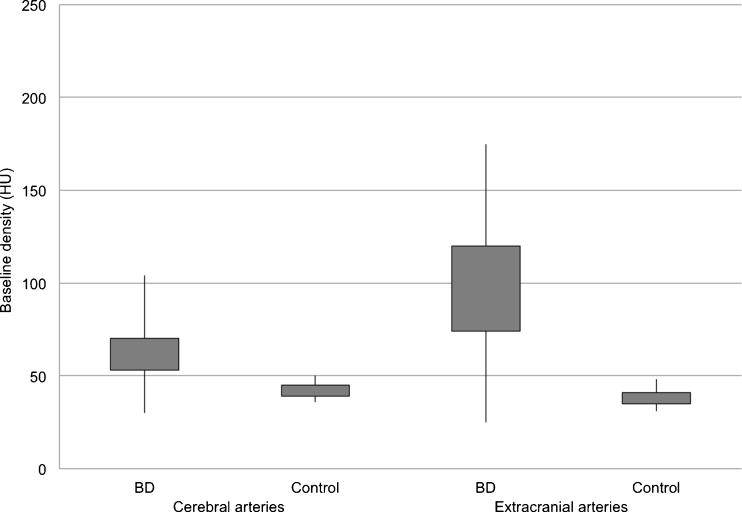
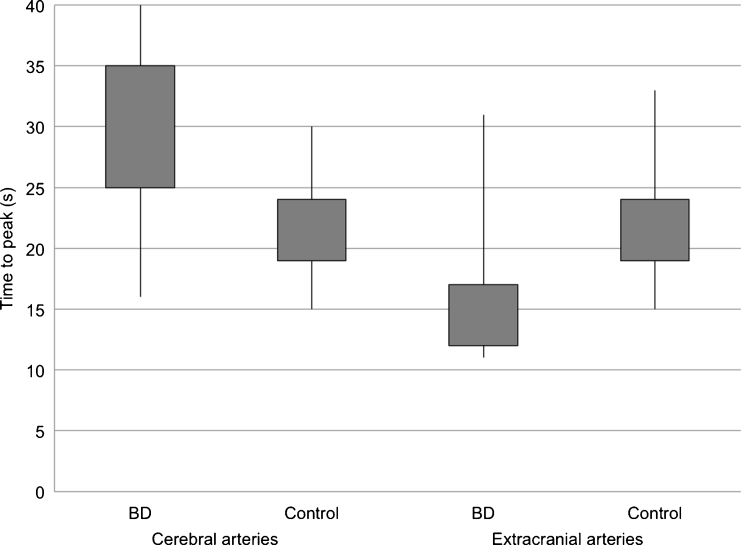
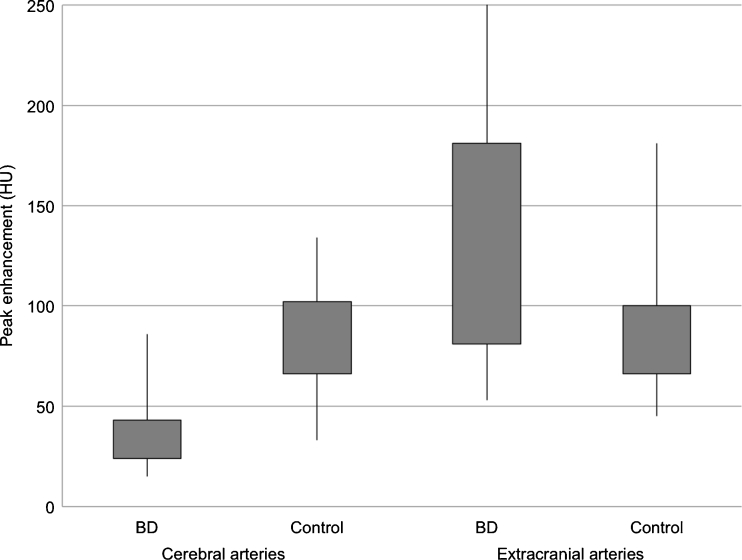
For cerebral arteries, TDCs in BD patients represented flat curves in contrast to TDCs in the control group, which formed steep and narrow Gaussian curves (see Fig. 2). Baseline density for cerebral and extracranial arteries was significantly higher in BD patients in comparison to the control group (60.5 vs. 41.5 HU (Hounsfield unit); p < 0.0001) (see Fig. 3). We found significantly longer time to peak enhancement in cerebral arteries in BD patients than in controls (median, 32 vs. 21 s; p < 0.0001) (see Fig. 4). In BD patients, peak enhancement in cerebral arteries occurred with a median delay of 14.5 s to peak in extracranial arteries while practically no delay was noted in controls (it occurred 1 s earlier, which is represented as median −1 s value; p < 0.0001) (see Fig. 5). Cerebral arteries in BD patients showed significantly lower peak enhancement in comparison to the control group (34.5 vs. 81.5 HU; p < 0.0001) (see Fig. 6).
Fig. 2.
Time–density curves in a BD patient (a) and in a control subject (b). Time to peak (TTP) enhancement
Fig. 3.
Distribution of baseline density values in BD patients and controls in cerebral and extracranial arteries
Fig. 4.
Distribution of time to peak in cerebral and extracranial arteries in BD patients and controls
Fig. 5.
Distribution of delay of cerebral peak values in BD patients and controls
Fig. 6.
Distribution of peak enhancement in cerebral and extracranial arteries in BD patients and controls
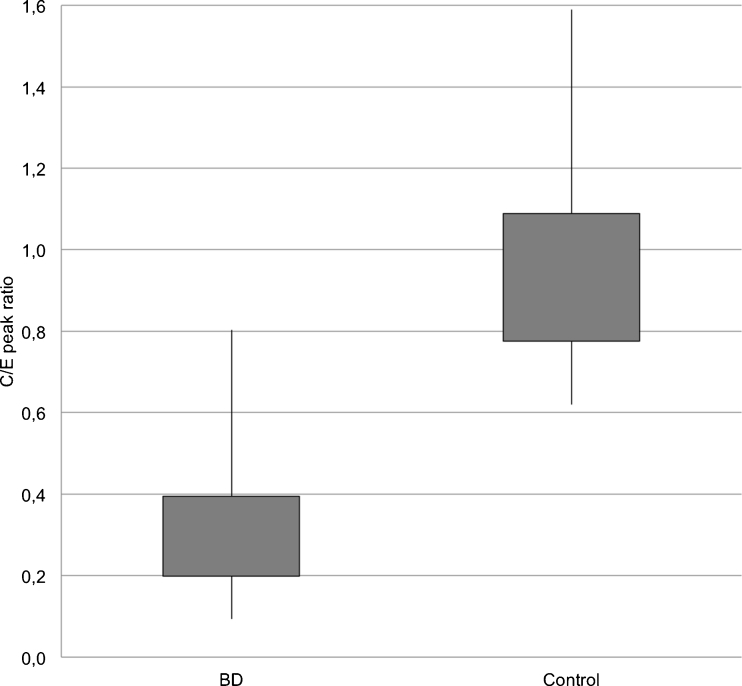
For extracranial arteries, TDCs represented a similar shape in both groups. However, we observed higher enhancement in BD patients at 20, 30, and 40 s (see Table 3). Peak enhancement was significantly higher and earlier in BD patients compared to controls (p = 0.0087 and p < 0.0001, respectively) (see Figs. 4 and 6). The intensity of peak enhancement in cerebral arteries in relation to extracranial arteries expressed as C/E peak ratio appeared to be significantly lower in BD patients in comparison to the control group (0.31 vs. 0.87; p < 0.0001) (see Fig. 7).
Table 3.
Variables calculated from dynamic CTP series in BD patients vs. controls
| Parameter | BD (N = 30) | Controls (N = 30) | P value |
|---|---|---|---|
| Enhancement at 20 s (HU) | |||
| Cerebral artery | 7.5 (24) | 41 (25) | <0.0001 |
| Extracranial artery | 53.5 (40) | 41.5 (30) | ns |
| Enhancement at 30 s (HU) | |||
| Cerebral artery | 18.5 (14) | 25 (19) | ns |
| Extracranial artery | 36 (23) | 26 (20) | 0.0225 |
| Enhancement at 40 s (HU) | |||
| Cerebral artery | 20 (15) | 16.5 (8) | ns |
| Extracranial artery | 36.5 (18) | 17 (10) | <0.0001 |
Values expressed as median (interquartile range)
ns not significant
Fig. 7.
Distribution of cerebral/extracranial peak ratio values in BD patients and controls
Analyzing the influence of demographic and clinical features on dynamic CT parameters, we revealed significant differences in time to peak and delay of peak enhancement in cerebral arteries between subgroups of BD patients with and without craniectomy. In the subgroup with craniectomy, time to peak and delay of cerebral peak were shorter in comparison to the subgroup without craniectomy (see Table 4). A statistically insignificant trend was found in the analysis of TDCs in BD patients with subarachnoid hemorrhage (SAH) and intracerebral hemorrhage (ICH). We revealed a tendency to longer time to peak and longer delay of cerebral peak in the group with SAH compared to the group with ICH (see Table 5). We did not observe any significant differences between CT parameters in relation to sex or examined artery.
Table 4.
Variables calculated from dynamic CTP series in BD patients without vs. with craniectomy
| Parameter | BD patients without craniectomy (N = 11) | BD patients with craniectomy (N = 19) | P value |
|---|---|---|---|
| Time to peak in cerebral artery (s) | 34 (6) | 26 (9) | 0.007 |
| Delay of cerebral peak (s) | 18 (8) | 13 (9) | 0.04 |
Values expressed as median (interquartile range)
Table 5.
Variables calculated from dynamic CTP series in BD patients with intracerebral vs. subarachnoid hemorrhage
| Parameter | BD patients with ICH (N = 16) | BD patients with SAH (N = 11) | P value |
|---|---|---|---|
| Time to peak in cerebral artery (s) | 27.5 (10) | 33 (9) | 0.34 (ns) |
| Delay of cerebral peak (s) | 13.5 (8) | 18 (13) | 0.16 (ns) |
Values expressed as median (interquartile range)
ns not significant
In all 30 BD patients, CTP revealed zero values of CBF and CBV in all ROIs.
Catheter angiography showed cerebral circulatory arrest in all 30 BD patients. Stasis filling pattern was observed in 14 (46.7 %) and non-filling in 16 (53.3 %) cases. In 37 excluded BD patients, angiography revealed a non-filling pattern in all cases; no stasis filling was noted.
Discussion
The term stasis filling for describing a delayed, weak, and persistent intracranial opacification in patients with BD was used for the first time by Kricheff et al. in 1978 [2]. This phenomenon is commonly observed in angiographic studies. Munari et al. reported stasis filling in 5 % (one out of 20), Braun et al. in 11 % (15/140), Bradac et al. in 12.5 % (two out of 16), Kricheff et al. in 15 % (three out of 20), and Savard et al. in 28 % (nine out of 32) of cases [2, 6–9]. CTA studies reveal even higher prevalence of intracranial filling. Dupas et al. noted stasis filling in 43 % (six out of 14) and Welschehold et al. in 59 % (37/63) of cases [3, 10]. This is similar to the results of the present study. In this material, intracranial filling occurred in 45 % (30/67) of dynamic CT examinations.
Stasis filling, as specific angiographic pattern of cerebral circulatory arrest, is a consequence of two major factors: raised intracranial pressure (ICP) and high cerebrovascular resistance (CVR). They both cause reduction of CBF, according to Poiseuille’s law: CBF = CPP/CVR = (MABP − ICP)/CVR, where CPP stands for cerebral perfusion pressure. Increased CVR in extreme cerebral hemodynamic disturbances was revealed in studies using a transcranial Doppler (TCD) [11, 12]. This is caused mainly by altered cerebral autoregulation mechanisms, which are sufficient to preserve almost constant CBF when CPP is above 50 mmHg [13]. Gradual deterioration of cerebral circulation primarily affects capillary and deep venous blood flow. Cessation of capillary circulation is consistent with cerebral circulatory arrest while proximal arterial segments are still patent [14]. At this stage, TCD frequently shows “to and fro” or narrow systolic spike patterns, which reflect blood movement [11, 12]. In such circumstances, heartbeat driven slow propagation of contrast column in proximal cerebral arteries is possible.
In the present study, stasis filling phenomenon was correlated with CTP results. Uwano et al. recently revealed a potential efficacy of CTP for assessing brain death [15]. In this material, CTP detected complete absence of brain perfusion reflected by zero values of CBF and CBV in all cases. These findings clearly show that stasis filling is not an indicator of any residual brain perfusion but only ineffective propagation of contrast in cerebral vessels; thus, it does not preclude diagnosis of brain death. CTP results are complementary to the recent report of Selcuk et al., which revealed global reduction of ADC consistent with necrosis of neurons using diffusion-weighted MRI technique [16].
The findings showed two features of stasis filling phenomenon: delay and weakness of intracranial opacification. TDCs for cerebral arteries in BD patients were characterized by significantly longer times to peak (median, 32 s) compared to controls (21 s). Moreover, intracranial peak enhancement occurred with a median delay of 14.5 s to extracranial peak. This is consistent with observations in CTA studies, in which intracranial filling in BD patients is usually detected in the late phase (performed 60 s after contrast injection) and very rarely in the early phase of scanning [3, 10, 17]. Such long delay indicates extremely slowed propagation of contrast in the cerebral arteries. Correlation with CTP results shows that such delayed vascular opacification does not provide any brain perfusion, thus cannot preclude diagnosis of brain death.
Typical cerebral TDC in BD patients was a flat curve with a low peak (median value of 34.5 HU); about three times lower compared to the peak in the extracranial artery. In contrast, extra- and intracranial TDCs in the control group represented steep and narrow Gaussian curves, and both peaks were of similar height. Such low peak values could be the reason of lower detectability of stasis filling by catheter angiography compared to CT (14/67 = 21 % vs. 30/67 = 45 % cases) observed in the present study. These findings are consistent with results of others as was presented in the first paragraph of discussion. Dupas et al. also observed underestimation of intracranial filling in catheter angiography compared to CTA in four out of seven cases [3]. Although, a larger amount of contrast was used in dynamic CT than in catheter angiography (50 vs. 30 mL), but in angiography, it was injected intra-arterially, which minimizes the effect of dilution. This discrepancy could be a result of advanced reconstruction algorithms, systems of noise reduction, and signal amplification used in CT scanners, which reduce noise, improve spatial resolution, and low contrast detectability. The other explanation could be the time sequence in performing CTP and catheter angiography. Angiography was carried out with a delay from 15 min to 3 h after CTP. During this period, slow rising ICP could stop the propagation of contrast at the level of skull base.
Analyzing the influence of demographic and clinical features on TDC’s parameters, we found a statistically significant trend towards shorter time to peak and shorter delay of peak in the cerebral arteries of BD patients with craniectomy compared to those without it. Moreover, the incidence of craniectomy was much lower in BD patients excluded from the study due to lack of intracranial opacification (four out of 37 = 11 %) compared to included patients who presented intracranial filling (19/30 = 63 %). Several authors previously reported a relationship between skull defect and preserved intracranial filling in BD patients [7, 18, 19]. This can be explained by a decreased ICP enabling propagation of contrast in the cerebral vessels.
A statistically insignificant trend was found in the analysis of TDCs in BD patients with SAH and intracerebral hemorrhage. We revealed a tendency to longer time to peak and longer delay of cerebral peak in the group with SAH compared to the group with ICH. This difference was probably caused by vasospasm after SAH, which independently increases CVR and additionally contributes to slowing down the propagation of contrast.
Limitations
The major drawback of this study is a consequence of performing CTP shortly after CTA in BD patients. The influence of residual contrast injected for CTA was reflected by higher baseline density in the cerebral and extracranial arteries, higher and earlier peak enhancement, and shorter time to peak in the extracranial vessels in BD patients compared to controls. However, this contrast contamination should not significantly change values of delay of cerebral peak or C/E peak ratio as they were calculated on the basis of both cerebral and extracranial TCDs. Besides, we cannot exclude the influence of residual contrast on CTP results.
Conclusions
In this study, we assessed the characteristic features of intracranial filling in BD patients—delay and weakness of cerebrovascular opacification. Stasis filling was confronted with CTP findings. It led to the conclusion that delayed and weak opacification of cerebral arteries do not necessarily mean the presence of cerebral perfusion, thus does not preclude diagnosis of BD.
Acknowledgments
This study was partially supported by scientific grant no. KBN-N 403 171 137.
Conflict of interest
We declare that we have no conflict of interest.
References
- 1.Announcement of the Minister of Health of Poland regarding criteria and methods for the diagnosis of irreversible termination of brain function (2007) http://isip.sejm.gov.pl/DetailsServlet?id=WMP20070460547.
- 2.Kricheff II, Pinto RS, George AE, Braunstein P, Korein J. Angiographic findings in brain death. Ann N Y Acad Sci. 1978;315:168–183. doi: 10.1111/j.1749-6632.1978.tb50338.x. [DOI] [PubMed] [Google Scholar]
- 3.Dupas B, Gayet-Delacroix M, Villers D, Antonioli D, Veccherini MF, Soulillou JP. Diagnosis of brain death using two-phase spiral CT. AJNR Am J Neuroradiol. 1998;19(4):641–647. [PMC free article] [PubMed] [Google Scholar]
- 4.Bohatyrewicz R, Sawicki M, Walecka A, Walecki J, Rowinski O, Bohatyrewicz A, Kanski A, Czajkowski Z, Krzysztalowski A, Solek-Pastuszka J, Zukowski M, Marzec-Lewenstein E, Wojtaszek M. Computed tomographic angiography and perfusion in the diagnosis of brain death. Transplant Proc. 2010;42(10):3941–3946. doi: 10.1016/j.transproceed.2010.09.143. [DOI] [PubMed] [Google Scholar]
- 5.Sawicki M, Walecka A, Bohatyrewicz R, Poncyljusz W, Kordowski J. Computed tomographic angiography in the diagnosis of brain death. Med Sci Monit. 2010;16(Suppl 1):28–32. [Google Scholar]
- 6.Munari M, Zucchetta P, Carollo C, Gallo F, De Nardin M, Marzola MC, Ferretti S, Facco E. Confirmatory tests in the diagnosis of brain death: comparison between SPECT and contrast angiography. Crit Care Med. 2005;33(9):2068–2073. doi: 10.1097/01.CCM.0000179143.19233.6A. [DOI] [PubMed] [Google Scholar]
- 7.Braun M, Ducrocq X, Huot JC, Audibert G, Anxionnat R, Picard L. Intravenous angiography in brain death: report of 140 patients. Neuroradiology. 1997;39(6):400–405. doi: 10.1007/s002340050432. [DOI] [PubMed] [Google Scholar]
- 8.Bradac GB, Simon RS. Angiography in brain death. Neuroradiology. 1974;7(1):25–28. doi: 10.1007/BF00344671. [DOI] [PubMed] [Google Scholar]
- 9.Savard M, Turgeon AF, Gariepy JL, Trottier F, Langevin S. Selective 4 vessels angiography in brain death: a retrospective study. Can J Neurol Sci. 2010;37(4):492–497. doi: 10.1017/s0317167100010520. [DOI] [PubMed] [Google Scholar]
- 10.Welschehold S, Kerz T, Boor S, Reuland K, Thomke F, Reuland A, Beyer C, Wagner W, Muller-Forell W, Giese A. Detection of intracranial circulatory arrest in brain death using cranial CT-angiography. Eur J Neurol. 2013;20(1):173–179. doi: 10.1111/j.1468-1331.2012.03826.x. [DOI] [PubMed] [Google Scholar]
- 11.Hassler W, Steinmetz H, Gawlowski J. Transcranial Doppler ultrasonography in raised intracranial pressure and in intracranial circulatory arrest. J Neurosurg. 1988;68(5):745–751. [PubMed] [Google Scholar]
- 12.Hassler W, Steinmetz H, Pirschel J. Transcranial Doppler study of intracranial circulatory arrest. J Neurosurg. 1989;71(2):195–201. doi: 10.3171/jns.1989.71.2.0195. [DOI] [PubMed] [Google Scholar]
- 13.Greenberg MS. Handbook of neurosurgery. 7. New York: Thieme Publishers; 2010. [Google Scholar]
- 14.Langfitt TW, Kassell NF. Non-filling of cerebral vessels during angiography: correlation with intracranial pressure. Acta Neurochir (Wien) 1966;14(1):96–104. doi: 10.1007/BF01401893. [DOI] [PubMed] [Google Scholar]
- 15.Uwano I, Kudo K, Sasaki M, Christensen S, Ostergaard L, Ogasawara K, Ogawa A. CT and MR perfusion can discriminate severe cerebral hypoperfusion from perfusion absence: evaluation of different commercial software packages by using digital phantoms. Neuroradiology. 2012;54(5):467–474. doi: 10.1007/s00234-011-0905-8. [DOI] [PubMed] [Google Scholar]
- 16.Selcuk H, Albayram S, Tureci E, Hasiloglu ZI, Kizilkilic O, Cagil E, Kocer N, Islak C. Diffusion-weighted imaging findings in brain death. Neuroradiology. 2012;54(6):547–554. doi: 10.1007/s00234-011-0912-9. [DOI] [PubMed] [Google Scholar]
- 17.Rieke A, Regli B, Mattle HP, Brekenfeld C, Gralla J, Schroth G, Ozdoba C (2011) Computed tomography angiography (CTA) to prove circulatory arrest for the diagnosis of brain death in the context of organ transplantation. Swiss Med Wkly 141:w13261. doi:10.4414/smw.2011.13261 [DOI] [PubMed]
- 18.Heiskanen O. Cerebral circulatory arrest caused by acute increase of intracranial pressure. A clinical and roentgenological study of 25 cases. Acta Neurol Scand Suppl. 1964;40(Suppl 7):1–57. [PubMed] [Google Scholar]
- 19.Alvarez LA, Lipton RB, Hirschfeld A, Salamon O, Lantos G. Brain death determination by angiography in the setting of a skull defect. Arch Neurol. 1988;45(2):225–227. doi: 10.1001/archneur.1988.00520260117031. [DOI] [PubMed] [Google Scholar]


