

Abstract
Musashi1 (Msi1) is a highly conserved RNA-binding protein that is required during the development of the nervous system. Msi1 has been characterized as a stem cell marker, controlling the balance between self-renewal and differentiation, and has also been implicated in tumorigenesis, being highly expressed in multiple tumor types. We analyzed Msi1 expression in a large cohort of medulloblastoma samples and found that Msi1 is highly expressed in tumor tissue compared with normal cerebellum. Notably, high Msi1 expression levels proved to be a sign of poor prognosis. Msi1 expression was determined to be particularly high in molecular subgroups 3 and 4 of medulloblastoma. We determined that Msi1 is required for tumorigenesis because inhibition of Msi1 expression by small-interfering RNAs reduced the growth of Daoy medulloblastoma cells in xenografts. To characterize the participation of Msi1 in medulloblastoma, we conducted different high-throughput analyses. Ribonucleoprotein immunoprecipitation followed by microarray analysis (RIP-chip) was used to identify mRNA species preferentially associated with Msi1 protein in Daoy cells. We also used cluster analysis to identify genes with similar or opposite expression patterns to Msi1 in our medulloblastoma cohort. A network study identified RAC1, CTGF, SDCBP, SRC, PRL, and SHC1 as major nodes of an Msi1-associated network. Our results suggest that Msi1 functions as a regulator of multiple processes in medulloblastoma formation and could become an important therapeutic target.
RNA-binding proteins (RBPs) play a key role in gene regulation by modulating processes such as splicing, mRNA transport and stability, and translation. The human genome contains approximately 800 RBPs, many of which regulate specific groups of transcripts.1 Some RBPs control mRNA subsets whose proteins are implicated in cancer-relevant processes, such as cell cycle, proliferation, apoptosis, and differentiation.2 If the function or expression level of such RBPs is altered, the expression of multiple genes is affected, triggering or contributing to tumor formation.3 An important example of such an RBP is Musashi1 (Msi1), a highly conserved protein with functions in nervous system development, stem cell self-renewal, and differentiation.4,5 Musashi was originally identified in Drosophila, where it controls asymmetric cell division in sensory precursor cells.6 In mammals, Msi1 is considered to define a population of multipotent stem cells in the brain,7 crypt cells in the intestines,8 breast,9 and hair follicles.10 In the brain, Msi1 is expressed in the subventricular zone where stem cells are located.11,12
Msi1 can function either as a negative or positive regulator of translation by binding to specific motifs located in the 3′ untranslated regions (UTRs) of its target mRNAs.4,5 Four well-characterized mRNA targets of Msi1 are known in mammals: Numb,13 CDKN1A,14 doublecortin,15 and Robo3.16 Numb inhibits the expression of Notch and Hedgehog and acts to prevent degradation of the tumor suppressor p53.17 CDKN1A is an inhibitor of cyclin-dependent protein kinases that regulate the transition through the G1/S phase of the cell cycle18 and chromosome segregation and mitosis.19 Doublecortin is a microtubule-binding protein involved in neural stem cell migration that is expressed in neuronal precursor cells.15 Robo3 is a receptor involved in axonal guidance. Robo proteins direct the growing axons to the appropriate location and enable the crossing of the midline.20 Additional targets for Msi1 have been identified by RIP-chip analysis, which pertain to the cell cycle, apoptosis, proliferation, and differentiation.21
Expression of Msi1 was first observed in glioblastoma and medulloblastoma and has since been found in several cancers, such as hepatocellular carcinoma, cervical cancer, lung cancer, retinoblastoma, and breast, bladder, endometrial, and colon cancer.22–32 Msi1 is particularly well characterized in breast and colon cancers. Approximately 40% of primary breast tumors and 100% of lymph node metastasis express increased levels of Msi1, which has been correlated to a poor prognosis.29 Reduced expression of Msi1 affected the growth of cells as spheroids and tumor xenografts.33 In the colon, Msi1 localizes within the crypt cells of the small intestine along with stem and progenitor cells.34,35 Intestinal adenomas of mice harboring an APC gene mutation are thought to have increased levels of Msi1 due to a constitutively active Wnt pathway.36–38 Colorectal tumor cells co-expressing CD133 and Msi1 are resistant to oxiliplatin and 5-fluorouracil.39 The crypts of the intestines after exposure to toxic levels of 5-fluorouracil continued to express Msi1, suggesting that Msi1-positive cells are drug resistant.40 Knockdown of Msi1 by RNA interference inhibited colon tumor cell growth as xenografts, whereas its ectopic expression in intestinal epithelium progenitor cells increased proliferation and tumorigenic capacity through the activation of Wnt and Notch pathways.30,41
In brain tumors, high Msi1 expression is correlated with poor prognosis in the cases of gliomas, astrocytomas, and medulloblastoma.23 In a previous study from our laboratory, we demonstrated that increased Msi1 expression is partially caused by loss or decreased expression of tumor suppressor microRNAs and via HuR, which increases mRNA stability and translation.42,43 In gliomas, Msi1 is associated with Notch1 expression in areas of tumor proliferation and infiltration.23 Moreover, in an expression correlation study performed with The Cancer Genome Atlas glioblastoma data set, we identified Notch3 and Notch4 among the genes with the highest correlative expression with Msi1.44 In medulloblastoma, a connection between Msi1 and Notch pathway activation was demonstrated by suppression subtractive hybridization.45 Moreover, knockdown of Msi1 in Daoy medulloblastoma cells down-regulated the expression of Notch pathway members, Hes1, Hey2, and Notch2.46 Msi1 influences the Notch pathway by inhibiting its repressor, Numb.13 Knockdown of Msi1 in medulloblastoma cells affected their proliferation and growth as spheroids, suggesting a possible involvement with the so-called cancer stem cell population.46
In this article, we report that Msi1 is a marker of poor prognosis in medulloblastoma. Msi1 seems to control tumor growth via a complex network of cancer-related genes. Altogether, our data demonstrate that Msi1 is a major player in medulloblastoma and may represent an important therapeutic target.
Materials and Methods
Cell Culture
The Daoy human medulloblastoma cell line and human embryonic kidney 293 (HEK293T) cells were obtained from ATCC (Manassas, VA). Cells were cultured using Dulbecco's modified Eagle medium (Hyclone, Logan, UT) supplemented with 10% fetal bovine serum (Atlanta Biologicals, Lawrenceville, GA) and penicillin and streptomycin (Gibco, Gaithersburg, MD) and incubated at 37°C in a humidified atmosphere of 5% carbon dioxide.
Tissue Arrays and Immunohistochemistry
Hematoxylin-eosin–stained sections from 259 paraffin blocks were prepared to define representative tumor regions. In addition, 10 samples of nontumor cerebellar tissues were included as a control. All tissue specimens were arrayed into a recipient block as previously described.47 Evaluation of MSI1 (Abnova, Walnut, CA) immunostaining was performed in a semiquantitative manner (positive versus negative), and cases with clear evidence of cytoplasmic and/or nuclear staining were considered immunopositive by two investigators (A.K. and M.R.), who were blinded to clinical and molecular variables.
Xenografts
Xenograft models were established by using 5-week-old, male, athymic, nude mice. The mice were maintained with water and mouse chow ad libitum in a pathogen-free environment. To establish tumors, 5 × 10⁷ Daoy cells were injected into the right and left flanks. Tumor size was measured by caliper, and volume was calculated as (length × width2) × 0.5. After 15 days, groups of five mice received three different treatments: Msi1 small-interfering (siRNA) injection, control siRNA injection, and nontreated control. siRNA was injected into the tumors every third day for a total of 5 doses. Msi1 siRNA (sequence targeting the coding region of Msi1; 5′-GGCUUUUGGAUUUGUGCAUdTdT-3′, where the lower case indicates deoxyribonucleotides) and a control siRNA were obtained from Ambion (Austin, TX). Efficacy of knockdown of Msi1 by siRNA was analyzed by real-time PCR and Western blot (see Supplemental Figure S1 at http://ajp.amjpathol.org). The siRNAs were mixed with 1,2-dioleoyl-sn-glycero-3-phosphocholine (DOPC) (Avanti Polar Lipids, Alabaster, AL) in the presence of excess t-butanol at a ratio of 1:10 (wt/wt) (siRNA/DOPC). Tween 20 (Sigma-Aldrich, St. Louis, MO) was added to the mixture in a ratio of 1:19 (Tween 20:siRNA/DOPC) and vortexed. The mixture was frozen in an acetone/dry ice bath and lyophilized. The siRNA preparation was reconstituted in 0.9% sterile saline before injecting at a dose of 5 μmol/L. At the end of treatment, animals were euthanized and the tumors removed and weighed. Size and weight between experiment and control tumors were compared using a paired two-tailed Student's t-test. P <0.05 was considered statistically significant. All values are expressed as mean ± SEM.
Immunohistochemistry of Xenografts
Tumors removed from xenografts were embedded in paraffin and cut into 4-μm sections and transferred to slides. The samples were deparaffinized, treated with a citrate buffer, and rehydrated in graded alcohol. Staining was completed by first blocking with avidin/biotin for 20 minutes and subsequent incubation with the appropriate antibody overnight at 4°C. Anti-Msi1 (Abcam, Cambridge, MA) and anti-Notch1 (Santa Cruz Biotechnology, Santa Cruz, CA) antibodies were used for immunohistochemistry. A secondary antibody conjugated to horseradish peroxidase was added to the slides, incubated for 30 minutes, and then developed with 3,3′-diaminobenzidine (Sigma-Aldrich). We used hematoxylin as a counterstain. Slides were dehydrated in graded alcohol (dH2O-95%), rinsed with xylene, and permanently mounted with Cryoseal Mounting Media 60 (Richard-Allen, Kalamazoo, MI).
RIP-Chip Experiments
RIP-chip was performed as previously described.48 Daoy cells were grown to 100% confluency in 150-mm dishes and then washed twice with ice-cold phosphate-buffered saline. Lysates were prepared with 1.5 volumes of polysomal lysis buffer [100 mmol/L KC, 25 mmol/L EDTA, 5 mmol/L MgCl2, 10 mmol/L HEPES, pH 7.0, 0.5% Nonidet P-40, 10% glycerol, 2 mmol/L dithiothreitol, 0.4 mmol/L vanadyl ribonucleoside complex, one tablet of complete protease inhibitor (Roche Applied Sciences, Indianapolis, IN), and RNaseOUT (Invitrogen, Carlsbad, CA)] and centrifuged, and the supernatant was removed and stored at −80°C. Protein A sepharose beads (GE Healthcare, Piscataway, NJ) were incubated overnight at 4°C with either anti-Msi1 polyclonal antibody or the preimmune serum.46 The beads coated with antibody were resuspended in NT2 buffer supplemented with RNaseOUT, 0.2% vanadyl ribonucleoside complex, 2 mmol/L dithiothreitol, and 25 mmol/L EDTA. The cell lysate was added, and the mixture of beads and lysate was incubated at room temperature while tumbling end over end. After incubation, the beads were spun down and washed four times with ice-cold NT2 buffer. Subsequently, the material was digested with proteinase K, extracted with phenol/chloroform, and precipitated with isopropanol. RNA quality was analyzed by using an Agilent 2100 Bioanalyzer (Agilent Technologies, Santa Clara, CA) according to the manufacturer protocol.
Two hundred nanograms of RNA from each sample was labeled with Cy3 or Cy5 dye using an Agilent Low RNA Input Linear Amplification Kit (Agilent Technologies) according to manufacturer protocol. Dye-swap was performed on each sample to avoid dye-specific biases. After amplification, 750 ng of Cy3- and Cy5-labeled RNA were combined and hybridized to an Agilent Human Gene expression array (Agilent Technologies). After incubation, hybridized slides were washed according to manufacturer protocol. Microarray slides were then scanned on an Agilent Microarray Scanner G2565BA (Agilent Technologies), and data were extracted with Agilent Feature Extraction software version 9.1 (Agilent Technologies).
RIP-Chip Data Analysis
All analyses were performed within the R/Bioconductor software (R Foundation for Statistical Computing, Vienna, Austria). First, the quality of the microarrays was assessed by diagnostic plots (eg, a red/green density plot and an MA plot) and hierarchal clustering. The background was then corrected using a normexp + offset method.49 Data were normalized within and between samples using the Loess and Aquantile methods, respectively. The LIMMA model was used to identify the mRNAs, which were preferentially associated with Msi1.50 We used a conservative threshold of three-fold enrichment and an adjusted P<1 × 10⁻⁷. The microarray data were deposited in the NCBI Gene Expression Omnibus under the accession number GSE30904 (http://www.ncbi.nlm.nih.gov/geo).
Quantitative RT-PCR
We performed RIP-PCR to validate the RIP-chip data. Immunoprecipitated RNA was recovered and amplified using the NuGEN Ovation RNA Amplification kit (NuGEN Technologies, San Carlos, CA). Complementary DNA was synthesized using Applied Biosystems High Capacity cDNA Reverse Transcription Kit (Applied Biosystems, Carlsbad, CA) using random priming. Quantitative PCR was performed using the TaqMan Gene Expression Master Mix (Applied Biosystems). All reactions were run on an ABI 7500 Real Time PCR machine (Applied Biosystems). The data were acquired using the ABI SDS software package version 2.0.1 (Applied Biosystems) and analyzed using the 2-ΔΔCt method.
Polysome Profiling
HEK293T cells were transfected in a 100-mm cell culture plate with an Msi1 expression construct and a green fluorescent protein (GFP) expression construct as negative control. Translation was arrested by adding 100 μg/mL of cycloheximide (Sigma-Aldrich) for 10 minutes for 72 hours after transfection. Cells were lysed in plate using a polysome lysis buffer (20 mmol/L Tris, pH 7.4, 250 mmol/L NaCl, 15 mmol/L MgCl2, 1 mmol/L dithiothreitol, 0.5% Triton X-100, 24 U/mL of Turbo DNase, and 100 μg/mL of cycloheximide). After scraping, the cells were triturated with a pipette. The lysate was incubated on ice for 10 minutes, clarified via centrifugation for 10 minutes at 11,592 × g at 4°C, and then overlaid on a 10% to 50% sucrose gradient in a buffer solution of 20 mmol/L Tris-HCl, pH 7.5, 100 mmol/L NaCl, 5 mmol/L MgCl2, and 0.1 mg/mL of cycloheximide. After ultracentrifugation at 113,422 × g at 4°C, 1-mL fractions were obtained on a Brandel density gradient fractionation system. A254 was measured during the entire fractionation process.
The monosomes and polysomes fractions were combined in separate tubes. RNA was extracted using the TRIzol reagent (Invitrogen) and resuspended in nuclease-free water (Ambion). Complementary DNA was synthesized using Applied Biosystems High Capacity cDNA Reverse Transcription Kit using random priming. Quantitative PCR was performed as described. Polysome association was calculated according to Peng et al,51 with high polysome association taken as a proxy of high translation activity. In brief, the mRNA levels in the polysome and monosome fractions were calculated. Then, the percentage of mRNA in the polysome fraction relative to the total (polysome plus monosome fractions) was determined. The percentage values were normalized to the control GFP expression (setting the GFP value at 1).
Computational Data Analysis
To identify transcripts with similar expression as MSI1, we computed the Pearson correlation coefficients of the Msi1 expression profile across a medulloblastoma microarray study52 to those of all other genes in the data set. Genes displaying strong positive correlation or anticorrelation (|R| > 0.5) with Msi1's profile were used in subsequent analysis.
To determine biological processes strongly associated with Msi1 and to explore the relationships of putative Msi1 targets, we analyzed all data sets with Pathway Studio 9 (Ariadne Genomics Inc., Rockville, MD), an automated text-mining tool based on published literature from various sources (eg, protein-protein interactions and gene co-expression).
Results
MSI1 Expression Is Elevated in Medulloblastoma and Is an Indicator of Poor Prognosis
We analyzed MSI1 expression in medulloblastoma versus normal cerebellar tissue using a large cohort of medulloblastoma samples (n = 103).52 Overall, MSI1 expression levels in medulloblastoma are significantly higher than in adult cerebellum, where expression is restricted to the external granular cell layer (P < 0.001) (Figure 1A).11 Fetal cerebellar tissue also presents high MSI1 expression, which is consistent with the role of Msi1 during neurogenesis in the developing brain.11 We also found that MSI1 expression is significantly elevated in medulloblastoma molecular subgroups 3 and 4, which are associated with a poor and intermediate prognosis, respectively, compared with the less severe WNT and SHH subgroups as defined by Taylor et al53 using the Toronto series (n = 103, P <0.001) (Figure 1B) and Heidelberg series (see Supplemental Figure S2 at http://ajp.amjpathol.org) (n = 64) of gene expression cohort data.52,54,55
Figure 1.

Distinct expression patterns of Msi1 and its prognostic relevance in medulloblastoma. A:MSI1 mRNA expression in the developing fetal cerebellum (FCB) and medulloblastoma (MB) compared with adult cerebellum (ACB) in the Toronto series (n = 103).52B:MSI1 mRNA expression is significantly elevated in both the group 3 and group 4 subgroups of medulloblastoma in the Toronto series (n = 103). MSI1 is elevated in the group 3 and group 4 subgroups of medulloblastoma compared with the WNT and SHH subgroups. C: Patterns of Msi1 protein expression: immunonegative (left panel) and immunopositive (right panel) examples on a medulloblastoma tissue microarray (n = 259). Kaplan-Meier plot of estimated overall survival (D) and progression-free survival (E) time distributions. The number of patients at risk is indicated for time increments of 12 months. Kaplan-Meier plots according to Msi1 expression in the entire cohort of 259 patients. *P ≤ 0.05, **P ≤ 0.01, and ***P ≤ 0.001.
Furthermore, Msi1 expression was evaluated by immunohistochemistry in 259 tumor samples on two medulloblastoma tissue microarrays. Among these samples, 59 (23%) were immunonegative, whereas the remaining 200 tumors (77%) demonstrated strong and homogeneous Msi1 expression (Figure 1C). Survival analysis by the Kaplan-Meier estimate and log-rank test revealed a significant association of Msi1 immunoreactivity with poor overall survival (P <0.0001) (Figure 1D) and progression-free survival (P <0.0001) (Figure 1E). We then delineated Msi1 expression in a subgroup-specific manner. For instance, we found that 98% of group 3 tumors have high Msi1 expression, whereas this number is only 53% in the case of WNT subgroup (see Supplemental Figure S3 at http://ajp.amjpathol.org). Moreover, when we focused on groups 3 and 4 tumors, we determined that high Msi1 expression denotes poor prognosis and overall survival compared with the Msi1-negative tumors (see Supplemental Figure S4 at http://ajp.amjpathol.org). These findings strongly support Msi1's role in tumorigenesis of high-risk medulloblastoma and, importantly, suggest its use as a prognostic marker.
Msi1 Contributes to Medulloblastoma Formation
We previously showed that Msi1 affects the viability of Daoy cells grown as tumor spheroids and cell proliferation by cell colony formation assay.46 Building on these studies, we examined the role of Msi1 in medulloblastoma growth in xenografts of Daoy cells (Figure 2A). Fifteen days after cell implantation, tumors were treated with multiple injections of either a control (scrambled) or Msi1 siRNA. Tumor volume was measured at various time points, and tumor weight (Figure 2B) was determined on euthanasia. Tumors subjected to Msi1 siRNA treatment had a statistically significant decrease in tumor growth compared with the tumors injected with control siRNA and nontreated controls (P = 0.002) (Figure 2C). Tumors treated with control siRNA had a slight increase compared with the nontreated control, a similar effect that was previously observed.30 Xenografts were immunohistochemically stained for Msi1 and Notch1 to corroborate the effects of the siRNA knockdown (Figure 2D). A decrease in Notch expression on Msi1 knockdown was expected based on the fact that Msi1 represses Numb, a Notch inhibitor.
Figure 2.

Msi1 silencing caused tumor regression of medulloblastoma cells grown as xenografts. Daoy medulloblastoma cells were implanted into the flank of nude mice and subjected to various treatments: nontreated control, scrambled siRNA injection, and Msi1 siRNA injection. Tumor size was measured at different time points, and tumor weight was calculated at the end of the experiment. A: Representative gross images of tumors from each of the treatment after extirpation. Scale bar = 1 cm. B: Graph representing the measurement of the tumor volume, in cubic millimeters, throughout the experiment. The data are shown as mean ± SE of mean (SEM) (n = 5). C: Tumor weights, in grams, at the final point of the experiment. Treatment with Msi1 siRNA resulted in reduction of tumor volume and weight. The data are shown as mean ± SEM (n = 5). Student's t-test was used to calculate P values. D: Immunohistochemical analysis of medulloblastoma xenograft tumors. Msi1 and Notch1 expression was assessed in each of the tumors. Representative images of each slide are shown. Notch1 expression is decreased when tumors are treated with Msi1 siRNA; thus, Notch1 is used as a readout for Notch signaling activity. Original magnification, ×40.
Genome-Wide Analyses Suggest that Msi1 Affects Tumorigenesis in Multiple Ways
Previous data from our laboratory indicated that through its binding to multiple RNA species, Msi1 controls a complex network of genes from multiple biological processes.21 To investigate the impact of Msi1 in medulloblastoma, we conducted two genomic analyses. We started by mapping genes highly correlated (positively and negatively) with MSI1 expression by exploring the microarray data from our medulloblastoma cohort (n = 103, see Supplemental Table S1 at http://ajp.amjpathol.org). High correlation could indicate that the identified gene is a target or regulator of Msi1, the identified gene and Msi1 are co-regulated by the same factor, or the identified gene and Msi1 are functionally associated. Given the size of our data set, a Pearson correlation coefficient of ±0.5, corresponding to a P < 0.001, was used as cutoff for significant correlation or anticorrelation, resulting in 218 and 150 genes, respectively.
We used RIP-chip56 to identify mRNAs that are preferentially associated with Msi1 protein and to further determine how Msi1 influences tumorigenesis. Immunoprecipitations using Daoy cell extract were performed with anti-Msi1 antibodies and prebleed serum (see Supplemental Figure S5A at http://ajp.amjpathol.org).46 Isolated mRNA populations were analyzed on microarrays. We used very stringent parameters (threefold minimum enrichment in experimental versus control samples and adjusted P ≤ 1 × 10⁻⁷) to filter the data. A summary plot presented in Supplemental Figure S5B (available at http://ajp.amjpathol.org) reveals the cutoff values and the genes with significant enrichment according to these criteria. The list includes 52 genes (Table 1; see also Supplemental Table S2 at http://ajp.amjpathol.org), 14 of which were previously identified in HEK293T cells.21 We also noticed a substantial overlap (circa 60%) with mRNAs identified via RIP-chip in U251 glioblastoma cells (Vo et al, unpublished data). The presence of common targets across cell lines corroborates the efficiency of our approach to identify Msi1 target mRNAs. Data were validated by RIP-PCR (see Supplemental Figure S6 at http://ajp.amjpathol.org).
Table 1.
Genes Identified by RIP-chip are Associated with Cancer-Related Processes
| Gene name | Apoptosis | Cell cycle | Cell differentiation | Cell proliferation | Cell survival | DNA repair | Total no. |
|---|---|---|---|---|---|---|---|
| RAC1 | x | x | x | x | x | x | 6 |
| CTGF | x | x | x | x | x | 5 | |
| PTGS1 (COX1) | x | x | x | x | x | 5 | |
| SDCBP | x | x | x | x | 4 | ||
| HERPUD1⁎ | x | x | x | x | 4 | ||
| SRSF3 | x | x | x | x | 4 | ||
| ARL6IP1⁎ | x | x | x | x | x | 5 | |
| ATP6AP2⁎ | x | x | x | x | 4 | ||
| CD164⁎ | x | x | x | x | x | 5 | |
| CDK2AP1 | x | x | x | x | x | 5 | |
| PDCD6 | x | x | x | x | 4 | ||
| PKNOX1⁎ | x | x | x | x | x | 5 | |
| VAMP7 | x | x | x | 3 | |||
| BTG3⁎ | x | x | x | x | 4 | ||
| DNAJB9 | x | x | x | 3 | |||
| GDE1 | x | x | x | x | 4 | ||
| KIAA0101⁎ | x | x | x | x | 4 | ||
| VAPA | x | x | x | x | 4 | ||
| FSTL1 | x | x | x | 3 | |||
| HSBP1⁎ | x | x | x | x | x | 5 | |
| LAPTM4B | x | x | x | 3 | |||
| MAP1LC3B | x | x | 2 | ||||
| UBE2E3⁎ | x | x | x | 3 | |||
| AASDHPPT⁎ | x | 1 | |||||
| SPOCK1 | x | 1 | |||||
| TSPAN3⁎ | x | 1 | |||||
| ZFAND5 | x | 1 |
Pathway Studio 9 was used to map mRNAs preferentially associated with Msi1 to biological processes.
x, biological processes associated with each gene.
Genes previously identified in a study with HEK293T cells.21
We examined the 3′ UTRs of the 52 identified putative Msi1 targets for evidence of the binding sites recently described by the Ohyama et al.57 For each target 3′ UTR, we counted the number of occurrences of the GUAG and UAG oligomers and normalized each count by the length of the UTR. We did the same for nontarget 3′ UTRs. On average, GUAG occurs 30% more frequently and UAG 50% more frequently in the target 3′ UTRs when compared with nontarget 3′ UTRs (P < 1.6 × 10⁻⁶ and < 9.2 × 10⁻²⁰, respectively; Wilcoxon rank-sum test). Furthermore, we examined the most enriched targets in the RIP-chip data and observed the same distinct pattern of AUG and GUAG oligomers separated by a variable length linker region as was recently reported57 (Figure 3). These results lend further support both for the putative Msi1 binding motif and for the accuracy of the identified targets.
Figure 3.
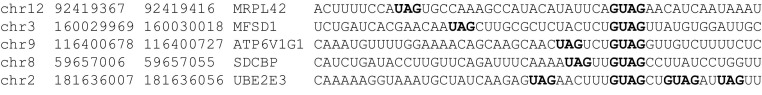
Identification of putative Msi1 binding sites. Highlighted in bold are the putative binding sites for Msi1. GUAG is the putative binding sequence for the RNA recognition motif 1 (RRM1) of Msi1, and UAG corresponds to the putative binding site for Msi1 RRM2.
Pathway Studio 9 determined significant correlation between identified Msi1 associated mRNAs and cancer relevant processes [apoptosis (∼44%), cell cycle (∼24%), cell differentiation (∼40%), cell proliferation (∼46%), cell survival (∼36%), and DNA repair (∼7%)]. All observed values showed enrichment over total transcriptome (P < 0.1–0.001) (Figure 4 and Table 1).
Figure 4.

Msi1 putative targets are enriched for cancer-related process. We used Pathway Studio 9 to analyze the biological processes connected with Msi1-associated mRNAs. The graph shows the percentage of genes associated with each biological process in the Msi1 subset (gray) and in total transcriptome (black). RIP-chip analysis of Msi1 results in an overall enrichment of mRNAs related to apoptosis, cell cycle, cell differentiation, cell proliferation, cell survival, and DNA repair versus the percentage of mRNAs that resides in whole transcriptome that are connected to cancer-related biological processes. Fisher's exact test was used to calculate P values.
To have a broader view of Msi1's impact on medulloblastoma and to identify the main mediators of its function, we conducted an in silico network analysis of the functional relationships between Msi1's associated mRNAs and correlated genes. Links between genes are drawn by Pathway Studio based on regulation, functional, and biological associations extracted from the literature (Figure 5; see also Supplemental Table S3 at http://ajp.amjpathol.org).
Figure 5.

Network analysis of Msi1. Blue ovals indicate Msi1 RIP-chip targets in Daoy cells (this study), and red ovals are genes whose expression is correlated to Msi1 (Pearson's R > 0.5). Links between nodes denote a functional relationship between the two genes as reported by literature, co-expression analysis, regulation, and protein-protein interaction analysis. The edges are directed to denote regulator-target relationships as determined by local connectivity. The figure illustrates the high connectivity of genes controlled by Msi1 expression.
Msi1 Potentially Regulates Translation of Target mRNAs
To determine changes in translation efficiency as a consequence of Msi1 binding, we performed a polysome association experiment. HEK293T cells were transfected with either a GFP (negative control) or a Msi1 expression construct.42,43 Cellular lysate was prepared and the polysome fraction (which contains highly translated mRNAs) and monosome fraction (which contains poorly translated mRNAs) were separated by ultracentrifugation in a sucrose density gradient. Quantitative RT-PCR was then used to measure the impact of Msi1 transgenic expression on polysome association of a group mRNAs in experimental versus control samples (Figure 6). We focused on a set of mRNAs that had been identified as preferentially associated with Msi1 both in Daoy and HEK293T cells,21 thus representing highly likely Msi1 targets. We observed that AASDHPPT, ATP6AP2, ATP6V1G1, and KIAA0101 have decreased polysome association on Msi1 expression, suggesting translational repression by Msi1 (as has been observed for other genes5,13,14).
Figure 6.

Msi1 affects ribosomal profile of associated mRNAs. 293T cells were transfected with expression constructs for Msi1 (pEF1-Msi1) or GFP (pEF1-GFP). After 72 hours of transfection, translation was arrested with cycloheximide, and cell lysates were prepared and analyzed on a sucrose density gradient. The polysome association for each selected mRNA was calculated according to Peng et al51 and compared between Msi1 and GFP. GAPDH and ACTB, which were not identified to be associated with Msi1, were used as a negative control. Transgenic expression of Msi1 repressed polysome association of four of the five analyzed target mRNAs without affecting GAPDH and ACTB. Data were analyzed with Student's t-test and are presented as mean ± SEM. Experiments were performed in triplicate. *P < 0.01, ***P < 0.001.
Discussion
In this report, we determined the relevance of Msi1 to medulloblastoma, the most common malignant brain tumor in children.58 The design of more efficient therapies requires a more elaborate study of this cell population, including the mapping and characterization of key regulators such as Msi1 that maintain the balance between self-renewal and differentiation under normal circumstances but can trigger or contribute to tumor formation when aberrantly expressed. We have previously determined that Msi1 expression is elevated in Daoy medulloblastoma cells grown as spheroids, which are enriched with cells with stem-like characteristics.46 Knockdown of Msi1 in these cells markedly affected their proliferation and growth.46 Similar results were obtained with breast cancer cells.29
Our data suggest that Msi1 is a marker of poor prognosis of medulloblastoma because patients displaying tumors with high Msi1 expression had a worse overall survival and progression-free survival than patients with tumors that had lower Msi1 expression. In agreement with this observation, we demonstrated that Msi1 silencing in tumor xenografts caused an impact on tumor growth. Therefore, we conclude that Msi1 is not only a marker of poor prognosis in medulloblastoma but also is required for tumorigenesis.
Recent analyses of a large cohort of medulloblastoma gene expression data have defined four molecular subgroups of medulloblastoma with different prognostic outcomes (SHH, WNT, group 3, and group 4).53 By examining the expression of MSI1 in this data set, we determined that high MSI1 expression is prevalent in subgroups 3 and 4, being particularly high in group 4. Groups 3 and 4 display a clear class separation from the other two subgroups of medulloblastoma, WNT and SHH. This stratification of MSI1 expression correlates with patients in groups 3 and 4 having a poor and intermediate prognosis, respectively, compared with the WNT and SHH subgroups, which have relatively good prognosis.53
Msi1 seems to influence tumorigenesis in multiple ways as suggested by our RIP-chip studies. We focus the discussion on the major nodes identified by analysis of a functional network. We discuss selected genes whose degree in the network is higher than the median degree. Among the RIP-chip identified targets, we highlight RAC1, CTGF, and SDCBP. Rac1 is a member of the Ras superfamily of GTP-binding proteins that has many cellular roles, such as regulating gene expression, cell proliferation, cytoskeleton reorganization, and metastasis.59 Previous studies observed abundant expression and activity of Rac1 in medulloblastoma.60 Furthermore, silencing of Rac1 using RNA interference in Daoy, UW-228, and OWS-76 cells leads to a reduced invasiveness.61 In many cancers, CTGF functions in biological processes, such as cell proliferation, migration, adhesion, extracellular matrix formation, and angiogenesis.62 CTGF overexpression is found in many malignant tumors, such as melanoma, prostate cancer, pancreatic cancer, esophageal carcinoma, lymphoblastic leukemia, gastric cancer, and gliomas.63–69 Enhanced CTGF expression provides the cell with the ability to invade and grow in an anchorage-independent manner.62 SDCBP, or syntenin, is an important molecule in connecting syndecan signaling to the cytoskeleton through the binding of its PDZ motif to syndecan proteoglycans.70 This interaction allows cancer cells to acquire the capability to migrate and invade; in particular, this capability is garnered through the activation of c-Src, focal adhesion kinase, MAPK pathway, and NF-κB by syntenin.71–75 In addition to its Msi1 interaction observed by RIP-chip analysis, SDCBP also correlates negatively with MSI1 gene expression (P < 0.0002).
Three major nodes come from the analysis of expression correlation: SRC, PRL, and SHC1. SRC (c-Src) is one of the first proto-oncogenes discovered and provided a launching point for the study of the molecular basis of cancer.76 c-Src is one of the members of the SRC family of kinases and is implicated in the development and progression of various human cancers. Elevated expression of c-Src is observed in a number of different cancer types.77 c-Src has a wide range of different kinase substrates, which includes proteins such as RasGAP SH3-domain binding protein, Ewing sarcoma breakpoint region 1, and heteronuclear ribonucleoprotein A2/B1.78 The cellular effects of c-Src are evident and widespread. c-Src expression can transform normal fibroblast so that the cell is now able to proliferate faster, lose density-dependent growth inhibition, and form tumors in in vivo xenograft models. Like many other tumor types, c-Src is overexpressed in medulloblastoma.79 Because c-Src expression is so potent and a potential therapeutic target, inhibition of c-Src kinase activity with novel inhibitors, such as pyrazolo-[3,4-day]-pyrimidine derivatives, can reduce the growth rate of medulloblastoma cells by arresting cell cycle progression at the G2/M transition and induce apoptosis.80 PRL is a luteotropic hormone protein whose best characterized effect is the stimulation of mammary glands to produce milk. In the maternal central nervous system, PRL can stimulate the proliferation of oligodendrocyte precursor cells and enhance remyelination.81 In cancers such as mammary, prostate, colorectal, and glioblastoma, PRL may have a role in the induction and progression of these cancers.82 In medulloblastoma, PRL expression is high and may serve as a potential target for therapy.83 SHC1 (also known as SHCA) is a signal transduction adaptor protein that relays extracellular signals downstream of receptor tyrosine kinases. SHC1 has a wide range of functions through its promotion of proliferation, angiogenesis, migration, and invasion.84–87 In medulloblastoma, SHC1 expression is elevated in metastatic medulloblastoma samples compared with nonmetastatic samples, suggesting a potential role of SHC1 in mediating metastasis of medulloblastoma.88
In summary, our study establishes a functional role of Msi1 in medulloblastoma through posttranscriptional control of a subset of cancer-related mRNAs. Studies such as this underline the importance of RBPs and posttranscriptional gene regulation in the molecular pathogenesis of cancer. We believe that further studies will likely demonstrate that more RBPs are directly involved in tumorigenesis. In fact, in a previous in silico study from our laboratory, we identified 53 RBPs aberrantly expressed in multiple tumor types.89 Further systematic studies are required to understand the role of posttranscriptional gene regulation in tumorigenesis and its interaction with known cancer signaling pathways and to identify novel therapeutic targets for cancer treatment.
Footnotes
Supported by grants from the Children's Brain Tumor Foundation, Association for Research of Childhood Cancer, The Max and Minnie Tomerlin Voelcker Fund, and NIH grant R01HG006015 (L.O.F.P.).
D.T.V., D.S., and M.R. contributed equally to this work.
Supplemental material for this article can be found at http://ajp.amjpathol.org or at http://dx.doi.org/ 10.1016/j.ajpath.2012.07.031.
Contributor Information
Christine Vogel, Email: cvogel@nyu.edu.
Luiz O.F. Penalva, Email: penalva@uthscsa.edu.
Supplementary data
Assessing the efficacy of MSI1 knockdown by siRNA. A: Quantitative RT-PCR analysis of MSI1 knockdown using siRNAs. Daoy medulloblastoma cells were transfected with a control siRNA (at 50 nmol/L) or increasing concentrations of MSI1 siRNAs (10, 50, 100 nmol/L). Untreated Daoy cells are denoted as control. B: Western blot analysis of Msi1 knockdown using siRNAs. Control or MSI1 siRNAs were transfected into Daoy medulloblastoma cells and analyzed by Western blot. Concentrations of each siRNA are listed above each lane. Actin was used as a loading control.
MSI1 expression pattern in the Heidelberg medulloblastoma gene expression data set54 (n = 64). MSI1 is elevated in the group 3 and group 4 subtypes of medulloblastoma compared with the WNT and SHH subgroups.
Subgroup-specific delineation of Msi1 expression of tissue microarray data of medulloblastoma. Tumors were categorized into specific molecular subgroups of medulloblastoma and parsed into subcategories of high and low Msi1 expression. The percentage of each subcategory for each medulloblastoma subgroup is shown.
Kaplan-Meier analysis of overall survival of non-WNT/-SHH tumors and Msi1 expression. A total of 152 tumors of group 3 and group 4 were analyzed for Msi1 expression and correlated to Msi1 expression. Patients with tumors with positive Msi1 expression had a poorer overall survival compared with patients with tumors with negative Msi1 expression (P = 0.0187).
A: Immunoprecipitation-Western blotting demonstrates that the Msi1 antibody specifically immunoprecipitates Msi1 versus that of the prebleed serum. B: Summary plot shows the cutoff value for the RIP-chip data using an adjusted P ≤ 1 × 10⁷ and a fold change of ≥3. Dots in red represent mRNAs that are preferentially associated with Msi1.
Validation of RIP-chip data using RIP-PCR. RIP was performed using a Msi1-specific antibody and IgG isotype antibody control. Bound RNA was extracted and amplified. Quantitative RT-PCR was used to analyze Msi1 target mRNAs, and the data were normalized to the IgG isotype immunoprecipitation.
References
- 1.Keene J.D. RNA regulons: coordination of post-transcriptional events. Nat Rev Genet. 2007;8:533–543. doi: 10.1038/nrg2111. [DOI] [PubMed] [Google Scholar]
- 2.Audic Y., Hartley R.S. Post-transcriptional regulation in cancer. Biol Cell. 2004;96:479–498. doi: 10.1016/j.biolcel.2004.05.002. [DOI] [PubMed] [Google Scholar]
- 3.Mittal N., Roy N., Babu M.M., Janga S.C. Dissecting the expression dynamics of RNA-binding proteins in posttranscriptional regulatory networks. Proc Natl Acad Sci U S A. 2009;106:20300–20305. doi: 10.1073/pnas.0906940106. [DOI] [PMC free article] [PubMed] [Google Scholar]
- 4.Okano H., Kawahara H., Toriya M., Nakao K., Shibata S., Imai T. Function of RNA-binding protein Musashi-1 in stem cells. Exp Cell Res. 2005;306:349–356. doi: 10.1016/j.yexcr.2005.02.021. [DOI] [PubMed] [Google Scholar]
- 5.Glazer R.I., Vo D.T., Penalva L.O. Musashi1: an RBP with versatile functions in normal and cancer stem cells. Front Biosci. 2012;17:54–64. doi: 10.2741/3915. [DOI] [PubMed] [Google Scholar]
- 6.Nakamura M., Okano H., Blendy J.A., Montell C. Musashi, a neural RNA-binding protein required for Drosophila adult external sensory organ development. Neuron. 1994;13:67–81. doi: 10.1016/0896-6273(94)90460-x. [DOI] [PubMed] [Google Scholar]
- 7.Keyoung H.M., Roy N.S., Benraiss A., Louissaint A., Jr., Suzuki A., Hashimoto M., Rashbaum W.K., Okano H., Goldman S.A. High-yield selection and extraction of two promoter-defined phenotypes of neural stem cells from the fetal human brain. Nature Biotechnol. 2001;19:843–850. doi: 10.1038/nbt0901-843. [DOI] [PubMed] [Google Scholar]
- 8.Kayahara T., Sawada M., Takaishi S., Fukui H., Seno H., Fukuzawa H., Suzuki K., Hiai H., Kageyama R., Okano H., Chiba T. Candidate markers for stem and early progenitor cells: Musashi-1 and Hes1, are expressed in crypt base columnar cells of mouse small intestine. FEBS Lett. 2003;535:131–135. doi: 10.1016/s0014-5793(02)03896-6. [DOI] [PubMed] [Google Scholar]
- 9.Wang X.Y., Yin Y., Yuan H., Sakamaki T., Okano H., Glazer R.I. Musashi1 modulates mammary progenitor cell expansion through proliferin-mediated activation of the Wnt and Notch pathways. Mol Cell Biol. 2008;28:3589–3599. doi: 10.1128/MCB.00040-08. [DOI] [PMC free article] [PubMed] [Google Scholar]
- 10.Sugiyama-Nakagiri Y., Akiyama M., Shibata S., Okano H., Shimizu H. Expression of RNA-binding protein Musashi in hair follicle development and hair cycle progression. Am J Pathol. 2006;168:80–92. doi: 10.2353/ajpath.2006.050469. [DOI] [PMC free article] [PubMed] [Google Scholar]
- 11.Sakakibara S., Imai T., Hamaguchi K., Okabe M., Aruga J., Nakajima K., Yasutomi D., Nagata T., Kurihara Y., Uesugi S., Miyata T., Ogawa M., Mikoshiba K., Okano H. Mouse-Musashi-1, a neural RNA-binding protein highly enriched in the mammalian CNS stem cell. Dev Biol. 1996;176:230–242. doi: 10.1006/dbio.1996.0130. [DOI] [PubMed] [Google Scholar]
- 12.Sakakibara S., Okano H. Expression of neural RNA-binding proteins in the postnatal CNS: implications of their roles in neuronal and glial cell development. J Neurosci. 1997;17:8300–8312. doi: 10.1523/JNEUROSCI.17-21-08300.1997. [DOI] [PMC free article] [PubMed] [Google Scholar]
- 13.Imai T., Tokunaga A., Yoshida T., Hashimoto M., Mikoshiba K., Weinmaster G., Nakafuku M., Okano H. The neural RNA-binding protein Musashi1 translationally regulates mammalian numb gene expression by interacting with its mRNA. Mol Cell Biol. 2001;21:3888–3900. doi: 10.1128/MCB.21.12.3888-3900.2001. [DOI] [PMC free article] [PubMed] [Google Scholar]
- 14.Battelli C., Nikopoulos G.N., Mitchell J.G., Verdi J.M. The RNA-binding protein Musashi-1 regulates neural development through the translational repression of p21WAF-1. Mol Cell Neurosci. 2006;31:85–96. doi: 10.1016/j.mcn.2005.09.003. [DOI] [PubMed] [Google Scholar]
- 15.Horisawa K., Imai T., Okano H., Yanagawa H. 3′-Untranslated region of doublecortin mRNA is a binding target of the Musashi1 RNA-binding protein. FEBS Lett. 2009;583:2429–2434. doi: 10.1016/j.febslet.2009.06.045. [DOI] [PubMed] [Google Scholar]
- 16.Kuwako K., Kakumoto K., Imai T., Igarashi M., Hamakubo T., Sakakibara S., Tessier-Lavigne M., Okano H.J., Okano H. Neural RNA-binding protein Musashi1 controls midline crossing of precerebellar neurons through posttranscriptional regulation of Robo3/Rig-1 expression. Neuron. 2010;67:407–421. doi: 10.1016/j.neuron.2010.07.005. [DOI] [PubMed] [Google Scholar]
- 17.Colaluca I.N., Tosoni D., Nuciforo P., Senic-Matuglia F., Galimberti V., Viale G., Pece S., Di Fiore P.P. NUMB controls p53 tumour suppressor activity. Nature. 2008;451:76–80. doi: 10.1038/nature06412. [DOI] [PubMed] [Google Scholar]
- 18.Sherr C.J., Roberts J.M. CDK inhibitors: positive and negative regulators of G1-phase progression. Genes Dev. 1999;13:1501–1512. doi: 10.1101/gad.13.12.1501. [DOI] [PubMed] [Google Scholar]
- 19.Hartwell L.H., Kastan M.B. Cell cycle control and cancer. Science. 1994;266:1821–1828. doi: 10.1126/science.7997877. [DOI] [PubMed] [Google Scholar]
- 20.Jen J.C., Chan W.M., Bosley T.M., Wan J., Carr J.R., Rub U., Shattuck D., Salamon G., Kudo L.C., Ou J., Lin D.D., Salih M.A., Kansu T., Al Dhalaan H., Al Zayed Z., MacDonald D.B., Stigsby B., Plaitakis A., Dretakis E.K., Gottlob I., Pieh C., Traboulsi E.I., Wang Q., Wang L., Andrews C., Yamada K., Demer J.L., Karim S., Alger J.R., Geschwind D.H., Deller T., Sicotte N.L., Nelson S.F., Baloh R.W., Engle E.C. Mutations in a human ROBO gene disrupt hindbrain axon pathway crossing and morphogenesis. Science. 2004;304:1509–1513. doi: 10.1126/science.1096437. [DOI] [PMC free article] [PubMed] [Google Scholar]
- 21.de Sousa Abreu R., Sanchez-Diaz P.C., Vogel C., Burns S.C., Ko D., Burton T.L., Vo D.T., Chennasamudaram S., Le S.Y., Shapiro B.A., Penalva L.O. Genomic analyses of musashi1 downstream targets show a strong association with cancer-related processes. J Biol Chem. 2009;284:12125–12135. doi: 10.1074/jbc.M809605200. [DOI] [PMC free article] [PubMed] [Google Scholar]
- 22.Toda M., Iizuka Y., Yu W., Imai T., Ikeda E., Yoshida K., Kawase T., Kawakami Y., Okano H., Uyemura K. Expression of the neural RNA-binding protein Musashi1 in human gliomas. Glia. 2001;34:1–7. doi: 10.1002/glia.1034. [DOI] [PubMed] [Google Scholar]
- 23.Kanemura Y., Mori K., Sakakibara S., Fujikawa H., Hayashi H., Nakano A., Matsumoto T., Tamura K., Imai T., Ohnishi T., Fushiki S., Nakamura Y., Yamasaki M., Okano H., Arita N. Musashi1, an evolutionarily conserved neural RNA-binding protein, is a versatile marker of human glioma cells in determining their cellular origin, malignancy, and proliferative activity. Differentiation. 2001;68:141–152. doi: 10.1046/j.1432-0436.2001.680208.x. [DOI] [PubMed] [Google Scholar]
- 24.Nakano A., Kanemura Y., Mori K., Kodama E., Yamamoto A., Sakamoto H., Nakamura Y., Okano H., Yamasaki M., Arita N. Expression of the neural RNA-binding protein Musashi1 in pediatric brain tumors. Pediatr Neurosurg. 2007;43:279–284. doi: 10.1159/000103307. [DOI] [PubMed] [Google Scholar]
- 25.Shu H.J., Saito T., Watanabe H., Ito J.I., Takeda H., Okano H., Kawata S. Expression of the Musashi1 gene encoding the RNA-binding protein in human hepatoma cell lines. Biochem Biophys Res Commun. 2002;293:150–154. doi: 10.1016/S0006-291X(02)00175-4. [DOI] [PubMed] [Google Scholar]
- 26.Ye F., Zhou C., Cheng Q., Shen J., Chen H. Stem-cell-abundant proteins Nanog, Nucleostemin and Musashi1 are highly expressed in malignant cervical epithelial cells. BMC Cancer. 2008;8:108. doi: 10.1186/1471-2407-8-108. [DOI] [PMC free article] [PubMed] [Google Scholar]
- 27.Kanai R., Eguchi K., Takahashi M., Goldman S., Okano H., Kawase T., Yazaki T. Enhanced therapeutic efficacy of oncolytic herpes vector G207 against human non-small cell lung cancer–expression of an RNA-binding protein: Musashi1, as a marker for the tailored gene therapy. J Gene Med. 2006;8:1329–1340. doi: 10.1002/jgm.965. [DOI] [PubMed] [Google Scholar]
- 28.Seigel G.M., Hackam A.S., Ganguly A., Mandell L.M., Gonzalez-Fernandez F. Human embryonic and neuronal stem cell markers in retinoblastoma. Mol Vis. 2007;13:823–832. [PMC free article] [PubMed] [Google Scholar]
- 29.Wang X.Y., Penalva L.O., Yuan H., Linnoila R.I., Lu J., Okano H., Glazer R.I. Musashi1 regulates breast tumor cell proliferation and is a prognostic indicator of poor survival. Mol Cancer. 2010;9:221. doi: 10.1186/1476-4598-9-221. [DOI] [PMC free article] [PubMed] [Google Scholar]
- 30.Sureban S.M., May R., George R.J., Dieckgraefe B.K., McLeod H.L., Ramalingam S., Bishnupuri K.S., Natarajan G., Anant S., Houchen C.W. Knockdown of RNA binding protein musashi-1 leads to tumor regression in vivo. Gastroenterology. 2008;134:1448–1458. doi: 10.1053/j.gastro.2008.02.057. [DOI] [PubMed] [Google Scholar]
- 31.Nikpour P., Baygi M.E., Steinhoff C., Hader C., Luca A.C., Mowla S.J., Schulz W.A. The RNA binding protein Musashi1 regulates apoptosis, gene expression and stress granule formation in urothelial carcinoma cells. J Cell Mol Med. 2011;15:1210–1224. doi: 10.1111/j.1582-4934.2010.01090.x. [DOI] [PMC free article] [PubMed] [Google Scholar]
- 32.Gotte M., Greve B., Kelsch R., Muller-Uthoff H., Weiss K., Kharabi Masouleh B., Sibrowski W., Kiesel L., Buchweitz O. The adult stem cell marker musashi-1 modulates endometrial carcinoma cell cycle progression and apoptosis via notch-1 and p21(WAF1/CIP1) Int J Cancer. 2010;128:2042–2049. doi: 10.1002/ijc.25856. [DOI] [PubMed] [Google Scholar]
- 33.Wang X.Y. Musashi1 regulates breast tumor cell proliferation and is a prognostic indicator of poor survival. Mol Cancer. 2010;9:221. doi: 10.1186/1476-4598-9-221. [DOI] [PMC free article] [PubMed] [Google Scholar]
- 34.Potten C.S., Booth C., Tudor G.L., Booth D., Brady G., Hurley P., Ashton G., Clarke R., Sakakibara S., Okano H. Identification of a putative intestinal stem cell and early lineage marker; musashi-1. Differentiation. 2003;71:28–41. doi: 10.1046/j.1432-0436.2003.700603.x. [DOI] [PubMed] [Google Scholar]
- 35.Nishimura S., Wakabayashi N., Toyoda K., Kashima K., Mitsufuji S. Expression of Musashi-1 in human normal colon crypt cells: a possible stem cell marker of human colon epithelium. Dig Dis Sci. 2003;48:1523–1529. doi: 10.1023/a:1024763723240. [DOI] [PubMed] [Google Scholar]
- 36.Moser A.R., Mattes E.M., Dove W.F., Lindstrom M.J., Haag J.D., Gould M.N. ApcMin, a mutation in the murine Apc gene, predisposes to mammary carcinomas and focal alveolar hyperplasias. Proc Natl Acad Sci U S A. 1993;90:8977–8981. doi: 10.1073/pnas.90.19.8977. [DOI] [PMC free article] [PubMed] [Google Scholar]
- 37.Schulenburg A., Cech P., Herbacek I., Marian B., Wrba F., Valent P., Ulrich-Pur H. CD44-positive colorectal adenoma cells express the potential stem cell markers musashi antigen (msi1) and ephrin B2 receptor (EphB2) J Pathol. 2007;213:152–160. doi: 10.1002/path.2220. [DOI] [PubMed] [Google Scholar]
- 38.Lewis A., Segditsas S., Deheragoda M., Pollard P., Jeffery R., Nye E., Lockstone H., Davis H., Clark S., Stamp G., Poulsom R., Wright N., Tomlinson I. Severe polyposis in Apc(1322T) mice is associated with submaximal Wnt signalling and increased expression of the stem cell marker Lgr5. Gut. 2010;59:1680–1686. doi: 10.1136/gut.2009.193680. [DOI] [PMC free article] [PubMed] [Google Scholar]
- 39.Todaro M., Alea M.P., Di Stefano A.B., Cammareri P., Vermeulen L., Iovino F., Tripodo C., Russo A., Gulotta G., Medema J.P., Stassi G. Colon cancer stem cells dictate tumor growth and resist cell death by production of interleukin-4. Cell Stem Cell. 2007;1:389–402. doi: 10.1016/j.stem.2007.08.001. [DOI] [PubMed] [Google Scholar]
- 40.Yuqi L., Chengtang W., Ying W., Shangtong L., Kangxiong L. The expression of Msi-1 and its significance in small intestinal mucosa severely damaged by high-dose 5-FU. Dig Dis Sci. 2008;53:2436–2442. doi: 10.1007/s10620-007-0155-0. [DOI] [PubMed] [Google Scholar]
- 41.Rezza A., Skah S., Roche C., Nadjar J., Samarut J., Plateroti M. The overexpression of the putative gut stem cell marker Musashi-1 induces tumorigenesis through Wnt and Notch activation. J Cell Sci. 2010;123:3256–3265. doi: 10.1242/jcs.065284. [DOI] [PubMed] [Google Scholar]
- 42.Vo D.T., Qiao M., Smith A.D., Burns S.C., Brenner A.J., Penalva L.O. The oncogenic RNA-binding protein Musashi1 is regulated by tumor suppressor miRNAs. RNA Biol. 2011;8:817–828. doi: 10.4161/rna.8.5.16041. [DOI] [PubMed] [Google Scholar]
- 43.Vo D.T., Abdelmohsen K., Martindale J.L., Qiao M., Tominaga K., Burton T.L., Gelfond J.A., Brenner A.J., Patel V., Trageser D., Scheffler B., Gorospe M., Penalva L.O. The oncogenic RNA-binding protein Musashi1 is regulated by HuR via mRNA translation and stability in glioblastoma cells. Mol Cancer Res. 2012;10:143–155. doi: 10.1158/1541-7786.MCR-11-0208. [DOI] [PMC free article] [PubMed] [Google Scholar]
- 44.Vo D.T., Sandhu D., Gelfond J.A., Penalva L.O. The Musashi1 RNA-binding Protein: A Critical Regulator in Glioblastoma. In: Garami M., editor. InTech; Rijeka, Croatia: 2011. pp. 549–564. [Google Scholar]
- 45.Yokota N., Mainprize T.G., Taylor M.D., Kohata T., Loreto M., Ueda S., Dura W., Grajkowska W., Kuo J.S., Rutka J.T. Identification of differentially expressed and developmentally regulated genes in medulloblastoma using suppression subtraction hybridization. Oncogene. 2004;23:3444–3453. doi: 10.1038/sj.onc.1207475. [DOI] [PubMed] [Google Scholar]
- 46.Sanchez-Diaz P.C., Burton T.L., Burns S.C., Hung J.Y., Penalva L.O. Musashi1 modulates cell proliferation genes in the medulloblastoma cell line Daoy. BMC Cancer. 2008;8:280. doi: 10.1186/1471-2407-8-280. [DOI] [PMC free article] [PubMed] [Google Scholar]
- 47.Freier K., Joos S., Flechtenmacher C., Devens F., Benner A., Bosch F.X., Lichter P., Hofele C. Tissue microarray analysis reveals site-specific prevalence of oncogene amplifications in head and neck squamous cell carcinoma. Cancer Res. 2003;63:1179–1182. [PubMed] [Google Scholar]
- 48.Penalva L.O., Keene J.D. Biotinylated tags for recovery and characterization of ribonucleoprotein complexes. Biotechniques. 2004;37:604. doi: 10.2144/04374ST05. [DOI] [PubMed] [Google Scholar]; 606, 608–610
- 49.Ritchie M.E., Silver J., Oshlack A., Holmes M., Diyagama D., Holloway A., Smyth G.K. A comparison of background correction methods for two-colour microarrays. Bioinformatics. 2007;23:2700–2707. doi: 10.1093/bioinformatics/btm412. [DOI] [PubMed] [Google Scholar]
- 50.Smyth G.K. Linear models and empirical Bayes methods for assessing differential expression in microarray experiments. Stat Appl Genet Mol Biol. 2004;3 doi: 10.2202/1544-6115.1027. [DOI] [PubMed] [Google Scholar]; Article 3
- 51.Peng S, Chen LL, Lei XX, Yang L, Lin H, Carmichael GG, Huang Y: Genome-wide studies reveal that Lin28 enhances the translation of genes important for growth and survival of human embryonic stem cells. Stem Cells 29:496-504 [DOI] [PubMed]
- 52.Northcott P.A., Korshunov A., Witt H., Hielscher T., Eberhart C.G., Mack S., Bouffet E., Clifford S.C., Hawkins C.E., French P., Rutka J.T., Pfister S., Taylor M.D. Medulloblastoma comprises four distinct molecular variants. J Clin Oncol. 2011;29:1408–1414. doi: 10.1200/JCO.2009.27.4324. [DOI] [PMC free article] [PubMed] [Google Scholar]
- 53.Taylor M.D., Northcott P.A., Korshunov A., Remke M., Cho Y.J., Clifford S.C., Eberhart C.G., Parsons D.W., Rutkowski S., Gajjar A., Ellison D.W., Lichter P., Gilbertson R.J., Pomeroy S.L., Kool M., Pfister S.M. Molecular subgroups of medulloblastoma: the current consensus. Acta Neuropathol. 2012;123:465–472. doi: 10.1007/s00401-011-0922-z. [DOI] [PMC free article] [PubMed] [Google Scholar]
- 54.Remke M., Hielscher T., Korshunov A., Northcott P.A., Bender S., Kool M., Westermann F., Benner A., Cin H., Ryzhova M., Sturm D., Witt H., Haag D., Toedt G., Wittmann A., Schottler A., von Bueren A.O., von Deimling A., Rutkowski S., Scheurlen W., Kulozik A.E., Taylor M.D., Lichter P., Pfister S.M. FSTL5 is a marker of poor prognosis in non-WNT/non-SHH medulloblastoma. J Clin Oncol. 2011;29:3852–3861. doi: 10.1200/JCO.2011.36.2798. [DOI] [PubMed] [Google Scholar]
- 55.Remke M., Hielscher T., Northcott P.A., Witt H., Ryzhova M., Wittmann A., Benner A., von Deimling A., Scheurlen W., Perry A., Croul S., Kulozik A.E., Lichter P., Taylor M.D., Pfister S.M., Korshunov A. Adult medulloblastoma comprises three major molecular variants. J Clin Oncol. 2011;29:2717–2723. doi: 10.1200/JCO.2011.34.9373. [DOI] [PubMed] [Google Scholar]
- 56.Jain R., Devine T., George A.D., Chittur S.V., Baroni T.E., Penalva L.O., Tenenbaum S.A. RIP-chip analysis: rNA-binding protein immunoprecipitation-microarray (chip) profiling. Methods Mol Biol. 2011;703:247–263. doi: 10.1007/978-1-59745-248-9_17. [DOI] [PubMed] [Google Scholar]
- 57.Ohyama T., Nagata T., Tsuda K., Kobayashi N., Imai T., Okano H., Yamazaki T., Katahira M. Structure of Musashi1 in a complex with target RNA: the role of aromatic stacking interactions. Nucleic Acids Res. 2012;40:3218–3231. doi: 10.1093/nar/gkr1139. [DOI] [PMC free article] [PubMed] [Google Scholar]
- 58.Roberts R.O., Lynch C.F., Jones M.P., Hart M.N. Medulloblastoma: a population-based study of 532 cases. J Neuropathol Exp Neurol. 1991;50:134–144. doi: 10.1097/00005072-199103000-00005. [DOI] [PubMed] [Google Scholar]
- 59.Bosco E.E., Mulloy J.C., Zheng Y. Rac1 GTPase: a “Rac” of all trades. Cell Mol Life Sci. 2009;66:370–374. doi: 10.1007/s00018-008-8552-x. [DOI] [PMC free article] [PubMed] [Google Scholar]
- 60.Zavarella S. Role of Rac1-regulated signaling in medulloblastoma invasion. J Neurosurg Pediatr. 2009;4:97. doi: 10.3171/2009.4.PEDS08322. [DOI] [PubMed] [Google Scholar]
- 61.Zavarella S., Nakada M., Belverud S., Coniglio S.J., Chan A., Mittler M.A., Schneider S.J., Symons M. Role of Rac1-regulated signaling in medulloblastoma invasion: laboratory investigation. J Neurosurg Pediatr. 2009;4:97–104. doi: 10.3171/2009.4.PEDS08322. [DOI] [PubMed] [Google Scholar]
- 62.Yin D., Chen W., O'Kelly J., Lu D., Ham M., Doan N.B., Xie D., Wang C., Vadgama J., Said J.W., Black K.L., Koeffler H.P. Connective tissue growth factor associated with oncogenic activities and drug resistance in glioblastoma multiforme. Int J Cancer. 2010;127:2257–2267. doi: 10.1002/ijc.25257. [DOI] [PMC free article] [PubMed] [Google Scholar]
- 63.Bennewith K.L., Huang X., Ham C.M., Graves E.E., Erler J.T., Kambham N., Feazell J., Yang G.P., Koong A., Giaccia A.J. The role of tumor cell-derived connective tissue growth factor (CTGF/CCN2) in pancreatic tumor growth. Cancer Res. 2009;69:775–784. doi: 10.1158/0008-5472.CAN-08-0987. [DOI] [PMC free article] [PubMed] [Google Scholar]
- 64.Kubo M., Kikuchi K., Nashiro K., Kakinuma T., Hayashi N., Nanko H., Tamaki K. Expression of fibrogenic cytokines in desmoplastic malignant melanoma. Br J Dermatol. 1998;139:192–197. doi: 10.1046/j.1365-2133.1998.02354.x. [DOI] [PubMed] [Google Scholar]
- 65.Liu L.Y., Han Y.C., Wu S.H., Lv Z.H. Expression of connective tissue growth factor in tumor tissues is an independent predictor of poor prognosis in patients with gastric cancer. World J Gastroenterol. 2008;14:2110–2114. doi: 10.3748/wjg.14.2110. [DOI] [PMC free article] [PubMed] [Google Scholar]
- 66.Sala-Torra O., Gundacker H.M., Stirewalt D.L., Ladne P.A., Pogosova-Agadjanyan E.L., Slovak M.L., Willman C.L., Heimfeld S., Boldt D.H., Radich J.P. Connective tissue growth factor (CTGF) expression and outcome in adult patients with acute lymphoblastic leukemia. Blood. 2007;109:3080–3083. doi: 10.1182/blood-2006-06-031096. [DOI] [PMC free article] [PubMed] [Google Scholar]
- 67.Xie D., Yin D., Wang H.J., Liu G.T., Elashoff R., Black K., Koeffler H.P. Levels of expression of CYR61 and CTGF are prognostic for tumor progression and survival of individuals with gliomas. Clin Cancer Res. 2004;10:2072–2081. doi: 10.1158/1078-0432.ccr-0659-03. [DOI] [PubMed] [Google Scholar]
- 68.Yang F., Tuxhorn J.A., Ressler S.J., McAlhany S.J., Dang T.D., Rowley D.R. Stromal expression of connective tissue growth factor promotes angiogenesis and prostate cancer tumorigenesis. Cancer Res. 2005;65:8887–8895. doi: 10.1158/0008-5472.CAN-05-1702. [DOI] [PubMed] [Google Scholar]
- 69.Zhou Z.Q., Cao W.H., Xie J.J., Lin J., Shen Z.Y., Zhang Q.Y., Shen J.H., Xu L.Y., Li E.M. Expression and prognostic significance of THBS1: Cyr61 and CTGF in esophageal squamous cell carcinoma. BMC Cancer. 2009;9:291. doi: 10.1186/1471-2407-9-291. [DOI] [PMC free article] [PubMed] [Google Scholar]
- 70.Grootjans J.J., Zimmermann P., Reekmans G., Smets A., Degeest G., Durr J., David G. Syntenin, a PDZ protein that binds syndecan cytoplasmic domains. Proc Natl Acad Sci U S A. 1997;94:13683–13688. doi: 10.1073/pnas.94.25.13683. [DOI] [PMC free article] [PubMed] [Google Scholar]
- 71.Sarkar D., Boukerche H., Su Z.Z., Fisher P.B. mda-9/Syntenin: more than just a simple adapter protein when it comes to cancer metastasis. Cancer Res. 2008;68:3087–3093. doi: 10.1158/0008-5472.CAN-07-6210. [DOI] [PubMed] [Google Scholar]
- 72.Boukerche H., Su Z.Z., Prevot C., Sarkar D., Fisher P.B. mda-9/Syntenin promotes metastasis in human melanoma cells by activating c-Src. Proc Natl Acad Sci U S A. 2008;105:15914–15919. doi: 10.1073/pnas.0808171105. [DOI] [PMC free article] [PubMed] [Google Scholar]
- 73.Boukerche H., Su Z.Z., Emdad L., Sarkar D., Fisher P.B. mda-9/Syntenin regulates the metastatic phenotype in human melanoma cells by activating nuclear factor-kappaB. Cancer Res. 2007;67:1812–1822. doi: 10.1158/0008-5472.CAN-06-3875. [DOI] [PubMed] [Google Scholar]
- 74.Hwangbo C., Kim J., Lee J.J., Lee J.H. Activation of the integrin effector kinase focal adhesion kinase in cancer cells is regulated by crosstalk between protein kinase C-alpha and the PDZ adapter protein mda-9/Syntenin. Cancer Res. 2010;70:1645–1655. doi: 10.1158/0008-5472.CAN-09-2447. [DOI] [PubMed] [Google Scholar]
- 75.Meerschaert K., Bruyneel E., De Wever O., Vanloo B., Boucherie C., Bracke M., Vandekerckhove J., Gettemans J. The tandem PDZ domains of syntenin promote cell invasion. Exp Cell Res. 2007;313:1790–1804. doi: 10.1016/j.yexcr.2007.03.014. [DOI] [PubMed] [Google Scholar]
- 76.Varmus H.E., Quintrell N., Wyke J. Revertants of an ASV-transformed rat cell line have lost the complete provius or sustained mutations in src. Virology. 1981;108:28–46. doi: 10.1016/0042-6822(81)90525-0. [DOI] [PubMed] [Google Scholar]
- 77.Dehm S.M., Bonham K. SRC gene expression in human cancer: the role of transcriptional activation. Biochem Cell Biol. 2004;82:263–274. doi: 10.1139/o03-077. [DOI] [PubMed] [Google Scholar]
- 78.Amanchy R., Zhong J., Molina H., Chaerkady R., Iwahori A., Kalume D.E., Gronborg M., Joore J., Cope L., Pandey A. Identification of c-Src tyrosine kinase substrates using mass spectrometry and peptide microarrays. J Proteome Res. 2008;7:3900–3910. doi: 10.1021/pr800198w. [DOI] [PMC free article] [PubMed] [Google Scholar]
- 79.Wasson J.C., Saylors R.L., III, Zeltzer P., Friedman H.S., Bigner S.H., Burger P.C., Bigner D.D., Look A.T., Douglass E.C., Brodeur G.M. Oncogene amplification in pediatric brain tumors. Cancer Res. 1990;50:2987–2990. [PubMed] [Google Scholar]
- 80.Rossi A., Schenone S., Angelucci A., Cozzi M., Caracciolo V., Pentimalli F., Puca A., Pucci B., La Montagna R., Bologna M., Botta M., Giordano A. New pyrazolo-[3,4-d]-pyrimidine derivative Src kinase inhibitors lead to cell cycle arrest and tumor growth reduction of human medulloblastoma cells. FASEB J. 2010;24:2881–2892. doi: 10.1096/fj.09-148593. [DOI] [PMC free article] [PubMed] [Google Scholar]
- 81.Gregg C., Shikar V., Larsen P., Mak G., Chojnacki A., Yong V.W., Weiss S. White matter plasticity and enhanced remyelination in the maternal CNS. J Neurosci. 2007;27:1812–1823. doi: 10.1523/JNEUROSCI.4441-06.2007. [DOI] [PMC free article] [PubMed] [Google Scholar]
- 82.Pearson R.D. Evo-Devo and the evolution of cancer: a hypothesis for metamorphic therapies for the cancers of prolactin-influenced tumourigenesis: with special reference to glioblastoma multiforme (GBM) Med Hypotheses. 2009;72:629–630. doi: 10.1016/j.mehy.2009.01.014. [DOI] [PubMed] [Google Scholar]
- 83.Boon K., Edwards J.B., Siu I.M., Olschner D., Eberhart C.G., Marra M.A., Strausberg R.L., Riggins G.J. Comparison of medulloblastoma and normal neural transcriptomes identifies a restricted set of activated genes. Oncogene. 2003;22:7687–7694. doi: 10.1038/sj.onc.1207043. [DOI] [PubMed] [Google Scholar]
- 84.Stevenson L.E., Ravichandran K.S., Frackelton A.R., Jr. Shc dominant negative disrupts cell cycle progression in both G0-G1 and G2-M of ErbB2-positive breast cancer cells. Cell Growth Differ. 1999;10:61–71. [PubMed] [Google Scholar]
- 85.Saucier C., Khoury H., Lai K.M., Peschard P., Dankort D., Naujokas M.A., Holash J., Yancopoulos G.D., Muller W.J., Pawson T., Park M. The Shc adaptor protein is critical for VEGF induction by Met/HGF and ErbB2 receptors and for early onset of tumor angiogenesis. Proc Natl Acad Sci U S A. 2004;101:2345–2350. doi: 10.1073/pnas.0308065101. [DOI] [PMC free article] [PubMed] [Google Scholar]
- 86.Marone R., Hess D., Dankort D., Muller W.J., Hynes N.E., Badache A. Memo mediates ErbB2-driven cell motility. Nat Cell Biol. 2004;6:515–522. doi: 10.1038/ncb1134. [DOI] [PubMed] [Google Scholar]
- 87.Ursini-Siegel J., Hardy W.R., Zuo D., Lam S.H., Sanguin-Gendreau V., Cardiff R.D., Pawson T., Muller W.J. ShcA signalling is essential for tumour progression in mouse models of human breast cancer. EMBO J. 2008;27:910–920. doi: 10.1038/emboj.2008.22. [DOI] [PMC free article] [PubMed] [Google Scholar]
- 88.MacDonald T.J., Brown K.M., LaFleur B., Peterson K., Lawlor C., Chen Y., Packer R.J., Cogen P., Stephan D.A. Expression profiling of medulloblastoma: pDGFRA and the RAS/MAPK pathway as therapeutic targets for metastatic disease. Nat Genet. 2001;29:143–152. doi: 10.1038/ng731. [DOI] [PubMed] [Google Scholar]
- 89.Galante P.A., Sandhu D., de Sousa Abreu R., Gradassi M., Slager N., Vogel C., de Souza S.J., Penalva L.O. A comprehensive in silico expression analysis of RNA binding proteins in normal and tumor tissue: identification of potential players in tumor formation. RNA Biol. 2009;6:426–433. doi: 10.4161/rna.6.4.8841. [DOI] [PMC free article] [PubMed] [Google Scholar]
Associated Data
This section collects any data citations, data availability statements, or supplementary materials included in this article.
Supplementary Materials
Assessing the efficacy of MSI1 knockdown by siRNA. A: Quantitative RT-PCR analysis of MSI1 knockdown using siRNAs. Daoy medulloblastoma cells were transfected with a control siRNA (at 50 nmol/L) or increasing concentrations of MSI1 siRNAs (10, 50, 100 nmol/L). Untreated Daoy cells are denoted as control. B: Western blot analysis of Msi1 knockdown using siRNAs. Control or MSI1 siRNAs were transfected into Daoy medulloblastoma cells and analyzed by Western blot. Concentrations of each siRNA are listed above each lane. Actin was used as a loading control.
MSI1 expression pattern in the Heidelberg medulloblastoma gene expression data set54 (n = 64). MSI1 is elevated in the group 3 and group 4 subtypes of medulloblastoma compared with the WNT and SHH subgroups.
Subgroup-specific delineation of Msi1 expression of tissue microarray data of medulloblastoma. Tumors were categorized into specific molecular subgroups of medulloblastoma and parsed into subcategories of high and low Msi1 expression. The percentage of each subcategory for each medulloblastoma subgroup is shown.
Kaplan-Meier analysis of overall survival of non-WNT/-SHH tumors and Msi1 expression. A total of 152 tumors of group 3 and group 4 were analyzed for Msi1 expression and correlated to Msi1 expression. Patients with tumors with positive Msi1 expression had a poorer overall survival compared with patients with tumors with negative Msi1 expression (P = 0.0187).
A: Immunoprecipitation-Western blotting demonstrates that the Msi1 antibody specifically immunoprecipitates Msi1 versus that of the prebleed serum. B: Summary plot shows the cutoff value for the RIP-chip data using an adjusted P ≤ 1 × 10⁷ and a fold change of ≥3. Dots in red represent mRNAs that are preferentially associated with Msi1.
Validation of RIP-chip data using RIP-PCR. RIP was performed using a Msi1-specific antibody and IgG isotype antibody control. Bound RNA was extracted and amplified. Quantitative RT-PCR was used to analyze Msi1 target mRNAs, and the data were normalized to the IgG isotype immunoprecipitation.