

Abstract
Renal glutamine synthetase catalyzes the reaction of NH4+ with glutamate, forming glutamine and decreasing the ammonia available for net acid excretion. The purpose of the present study was to determine glutamine synthetase's specific cellular expression in the mouse kidney and its regulation by hypokalemia, a common cause of altered renal ammonia metabolism. Glutamine synthetase mRNA and protein were present in the renal cortex and in both the outer and inner stripes of the outer medulla. Immunohistochemistry showed glutamine synthetase expression throughout the entire proximal tubule and in nonproximal tubule cells. Double immunolabel with cell-specific markers demonstrated glutamine synthetase expression in type A intercalated cells, non-A, non-B intercalated cells, and distal convoluted tubule cells, but not in principal cells, type B intercalated cells, or connecting segment cells. Hypokalemia induced by feeding a nominally K+-free diet for 12 days decreased glutamine synthetase expression throughout the entire proximal tubule and in the distal convoluted tubule and simultaneously increased glutamine synthetase expression in type A intercalated cells in both the cortical and outer medullary collecting duct. We conclude that glutamine synthetase is widely and specifically expressed in renal epithelial cells and that the regulation of expression differs in specific cell populations. Glutamine synthetase is likely to mediate an important role in renal ammonia metabolism.
Keywords: acid-base, ammonia, immunohistochemistry, intercalated cell, proximal tubule
renal ammonia1 metabolism comprises a major mechanism through which acid-base homeostasis is maintained. Increases in ammonia metabolism and urinary excretion are the primary mechanisms through which net acid excretion increases in response to metabolic acidosis (2, 20, 21). In chronic kidney disease, increased single nephron ammonia metabolism enables the maintenance of acid-base homeostasis until advanced chronic kidney disease is present (18), and the maintenance of acid-base homeostasis in chronic kidney disease is important for slowing the progression of renal impairment and for maintaining skeletal muscle mass (8, 12). Accordingly, understanding the molecular mechanisms underlying renal ammonia metabolism are of significant physiological and pathophysiological importance.
Renal ammonia metabolism is typically viewed as involving integrated functions of proximal tubule ammoniagenesis and epithelial cell ammonia transport. Ammoniagenesis involves cellular glutamine uptake and metabolism through an enzymatic process involving phosphate-dependent glutaminase (PDG), glutamate dehydrogenase, and phosphoenolpyruvate carboxykinase (PEPCK), ultimately resulting in the production of 2 NH4+ and 2 HCO3− molecules (28, 31, 33). NH4+ is secreted preferentially across the apical plasma membrane by a mechanism that appears to involve Na+/H+ exchanger (NHE)3-mediated Na+/NH4+ exchange and parallel H+ and NH3 secretion (25, 32, 33). Ammonia then undergoes regulated transport by renal epithelial cells, involving the transport of both NH3 and NH4+ by specific proteins, including Na+-K+-Cl− cotransporter 2, NHE4, Na+-K+-ATPase, and Rh glycoprotein B and C (Rhbg and Rhcg, respectively) (32, 33). This integrated interaction of intrarenal ammonia production and transport facilitates highly regulated renal ammonia metabolism and excretion.
However, in addition to the production and transport of ammonia, the kidney also can assimilate ammonia into larger molecules. In particular, the kidney expresses the enzyme glutamine synthetase, which catalyzes the following reaction: glutamate + NH4+ + ATP → glutamine + ADP + Pi + H+. By producing H+ as an integral component of this reaction process, there is neutralization, from an acid-base perspective, of the HCO3− produced during ammoniagenesis, and, by “consuming” NH4+, this reaction decreases the ammonia available for urinary excretion as a component of net acid excretion. Glutamine synthetase activity and expression are regulated by several conditions that alter renal ammonia metabolism, including metabolic acidosis, hypokalemia, and genetic deletion of renal ammonia transporters (2, 6, 20, 22). However, the specific cellular distribution of glutamine synthetase in the mammalian kidney has been incompletely examined. Moreover, whether regulation of glutamine synthetase expression is tubule or cell specific has not been previously studied.
Because of the potential importance of glutamine synthetase in renal ammonia metabolism, the initial purpose of the present study was to determine the specific cellular distribution of glutamine synthetase in the mouse kidney. We examined glutamine synthetase protein and mRNA expression using RT-PCR, immunoblot analyses, and immunohistochemistry. Because our study demonstrated glutamine synthetase expression in both proximal tubule and distal epithelial sites, we also determined whether the regulation of glutamine synthetase expression varied in different epithelial cells. We used a model of hypokalemia that caused increased ammonia excretion without metabolic acidosis, examined mice fed either a control diet or K+-free diet for 12 days, and determined cell-specific changes in glutamine synthetase expression.
METHODS
Animals.
C57Bl/6 mice bred in the University of Florida College of Medicine Cancer and Genetics Transgenic Animal Core Facility were used for these experiments. All animal protocols were approved by the University of Florida College of Medicine and the North Florida/South Georgia Veterans Health System Institutional Animal Care and Use Committees.
Antibodies.
We used two antibodies against glutamine synthetase: 1) a rabbit polyclonal antibody (catalog no. AB73593, Abcam, Cambridge, MA) and 2) a mouse monoclonal antibody (catalog no. MAB302, EMD Millipore, Billerica, MA). For double-labeling immunohistochemistry, we used rabbit polyclonal antibodies against rat anion exchanger 1 (AE1; Alpha Diagnostic, San Antonio, TX), the a4 subunit of H+-ATPase (a gift from Dr. Fiona Karet, Cambridge Institute for Medical Research, Cambridge, UK), and the thiazide-sensitive Na+-Cl− cotransporter (NCC; a gift from Dr. David Ellison, Oregon Health Sciences University, Portland, OR).
Animal models.
To examine the effect of dietary K+ deficiency, mice were fed powdered semisynthetic K+-free diet (TD.88239, Harlan Teklad, Madison, WI) to produce hypokalemia, as we have previously reported (1, 22). Control animals were fed K+ control diet (1.0% K+, TD.88238, Harlan Teklad). Diets were obtained in a powdered state and mixed with water at a ratio of 6 g per 1 ml to produce semisolid food. Control animals were fed K+ control diet for 14 days; K+-deficient animals were fed the K+ control diet for 2 days followed by the K+-free diet for 12 days.
Tissue preparation for immunohistochemistry.
Mice were anesthetized with inhalant isoflurane. Kidneys were preserved by an in vivo cardiac perfusion with PBS (pH 7.4) followed by periodate-lysine-2% paraformaldehyde, cut transversely into several 2- to 4-mm-thick slices, and then immersed ∼24 h at 4°C in the same fixative. Kidney samples from each animal were embedded in polyester wax [polyethylene glycol 400 distearate (Polysciences, Warrington, PA) and 10% 1-hexadecanol], and 3-μm-thick sections were cut and mounted on triple chrome-alum-gelatin-coated glass slides.
Immunohistochemistry.
Immunolocalization was accomplished using previously described immunoperoxidase procedures (1, 14, 17, 18, 20–22). Briefly, sections were dewaxed in ethanol, rehydrated, heated in Trilogy (Cell Marque, Rocklin, CA) to 88°C for 30 min and then to 96°C for 30 min, cooled for 30 min, and rinsed in PBS. Endogenous peroxidase activity was blocked by incubating the sections in 3% H2O2 in distilled water for 45 min. Sections were blocked for 15 min with Serum-Free Protein Block (DakoCytomation) and then incubated at 4°C overnight with primary antibody. Sections were washed in PBS and incubated for 30 min with polymer-linked, peroxidase-conjugated goat anti-rabbit IgG (MACH2, Biocare Medical, Concord, CA), washed again with PBS, and then exposed to diaminobenzidine (DAB) for 5 min. Sections were washed in distilled water, dehydrated with xylene, mounted, and observed by light microscopy. Comparisons of labeling were made only between sections of the same thickness from the same immunohistochemistry experiment. Sections were examined on a Leica DM2000 microscope and photographed using a Leica DFC425 digital camera and Leica DFC Twain Software and LAS application suite (Leica Microsystems, Buffalo Grove, IL). Color correction was performed using Adobe Photoshop software (Adobe Systems, San Jose, CA).
Negative controls.
Each immunohistochemistry experiment included a section that was exposed to the immunolabeling procedure without the primary antibody to assure that the label was due to primary antibody binding only. In addition, to verify that the immunolabeling was due to binding of the primary antibody to the specific antigenic target, we performed peptide-blocking experiments, including sections labeled with the rabbit anti-glutamine synthetase antibody and additional sections labeled using the rabbit anti-glutamine synthetase antibody after preincubation with a 20-fold excess of the antigenic peptide (ab73591, Abcam). For all sections, the primary antibody was diluted 1:25,000; sections were labeled in the same experiment under identical conditions, other than in the presence or absence of the antigenic peptide in the primary antibody solution.
Double-immunolabeling procedure.
Double immunolabeling was done using sequential immunoperoxidase procedures as previously described (1, 14, 21, 22). Briefly, tissue sections were labeled with the first primary antibody following the procedure described above. After the DAB reaction, sections were washed in PBS and then blocked using 3% H2O2 in methanol. The above procedure was repeated using a second primary antibody and Vector SG (Vector Laboratories, Burlingame, CA) for the peroxidase substrate, which produces a blue reaction product easily distinguished from the DAB brown reaction product. Sections were then washed with glass distilled water, dehydrated with xylene, mounted with Permount, and observed by light microscopy.
Quantitative analysis of immunohistochemistry.
Glutamine synthetase immunoreactivity in proximal tubule, distal convoluted tubule (DCT), and intercalated cells was quantified in bright-field light micrographs. Proximal tubule segments and individual intercalated cells were studied in 3-μm sections labeled under identical conditions in the same immunolabeling experiment using the rabbit anti-glutamine synthetase antibody diluted 1:25,000. The specific proximal tubule segments measured were: the first proximal convoluted tubule (PCT), defined as PCT segments continuous with Bowman's capsule; the proximal straight tubule (PST) in the medullary ray, adjacent and parallel to cortical thick ascending limbs; and the PST in the outer stripe of the outer medulla (OMo). DCTs were measured in 3-μm sections double labeled for glutamine synthetase and AE1 and were identified by the morphological features typical of the DCT, that is, a tubule located in the cortical labyrinth containing a homogenous population of tall epithelial cells with at least 1/3 of the total cell height between the cell nucleus and basement membrane and no brush border.
For quanitifying immunolabel and cell height in proximal tubule and DCT cells, we used previously described quantitative methods (18). Briefly, high-resolution digital micrographs were taken of randomly selected fields of the renal cortex and OMo using a Nikon E600 microscope equipped with a DXM1200F digital camera and ACT-1 software (Nikon). Images to be compared were collected during the same photomicroscopy session under identical imaging conditions and using no image enhancement techniques. Using ImageJ software [version 1.34j, National Institutes of Health (NIH)], we measured pixel intensity across a line drawn from the tubule lumen through an individual cell, outside of the cell nucleus. To avoid selection bias, the cell to be measured and placement of the reference line were determined using a grid overlay in ImageJ. These data were then analyzed using custom-written software; total cellular expression was determined by integrating net pixel intensity across the entire cell. Cell height was determined as the distance in pixels between the apical and basolateral edges of the cells and converted to micrometers. A minimum of 15 individual cells from at least 5 photomicrographs were analyzed. Data from all cells examined of a given type were averaged to yield a single data point per animal for statistical analysis.
For individual intercalated cells, we measured individual cell profile area and immunolabel intensity in the entire cell profile. Using ImageJ software (version 1.34j, NIH) and a Bamboo CTH-460 pen tablet (Wacom, Vancouver, WA), individual collecting duct cells expressing glutamine synthetase immunolabel were identified and carefully outlined. Pixel intensity and number of pixels within the outlined area were then analyzed using custom-written macros executed in Microsoft Excel 2010. Background intensity was determined and subtracted from individual pixel intensity to determine glutamine synthetase-specific intensity. We then integrated glutamine synthetase-specific pixel intensity across the entire cell to determine total cell-specific immunolabel expression. Cell area was determined as the number of pixels within the outlined region and converted to area using calibrated measurement of pixels per micrometer. In preliminary experiments, the interindividual measurement variability of both immunolabel expression and cell area was <5%. In all measurements, the individual performing the microscopy and quantifying the results was blinded as to the treatment group of each animal. Each value reported reflects the mean of measurements of at least 20 intercalated cells that were selected by random systematic sampling of each kidney region analyzed. Data from all cells from a given tubule segment, i.e., the cortical collecting duct (CCD), were averaged for each animal; pooled data from each animal were used for statistical analysis.
Protein and mRNA isolation.
Animals were anesthetized with inhalant isoflurane, and kidneys were rinsed by in vivo cardiac perfusion with PBS (pH 7.4). Kidneys were rapidly removed and dissected on a cold stage for protein isolation. The outer cortex, OMo, and inner stripe of the outer medulla (OMi) were dissected. For mRNA isolation, the whole cortex and OMi were dissected. For OMi dissection, a margin of the inner stripe was left between the outer stripe and the collected portion of the inner stripe to eliminate contamination of OMi samples with proximal tubule cells. Samples for protein isolation were immediately frozen in liquid nitrogen, and samples for RNA isolation were immersed in RNAlater (Qiagen, Valencia, CA) and stored at 4°C for 24 h; both were then stored frozen at −70°C until used. For protein, tissues were homogenized in Tissue Protein Extraction Reagent (Pierce Biotechnology, Rockford, IL) using microtube pestles (USA Scientific, Ocala, FL), and protein was extracted according to the manufacturer's recommended procedures. An aliquot was obtained for protein determination using a BCA assay, and the remainder was stored frozen at −70°C until used. Total RNA was extracted using the RNeasy Mini Kit (Qiagen) and stored in a −70°C freezer until used.
Immunoblot procedure.
Ten micrograms of renal protein were electrophoresed on 10% PAGE ReadyGel (Bio-Rad, Hercules, CA). Gels were then transferred electrophoretically to nitrocellulose membranes, blocked with 5 g/dl nonfat dry milk diluted in Blotto buffer (50 mM Tris, 150 mM NaCl, 5 mM Na2EDTA, and 0.05% Tween 20; pH 7.6), and incubated at 4°C overnight with primary antibody in nonfat dry milk. Loading and transfer equivalence were assessed with Ponceau S staining. After being washed, membranes were exposed to secondary antibody, goat anti-rabbit IgG (Millipore, Billerica, MA) or goat anti-mouse IgG (Upstate, Temecula, CA), conjugated to horseradish peroxidase at a dilution of 1:5,000. Sites of antibody-antigen reaction were visualized using enhanced chemiluminescence (SuperSignal West Pico Substrate, Pierce) and a Kodak Image Station 440CF digital imaging system. Band density was quantified using Kodak 1D (version 5.0) software (Kodak Scientific Imaging, New Haven, CT). Band density was normalized so that mean density in the same region (cortex or outer medulla) in control tissues was 100.0. Absence of saturation was confirmed by examining pixel intensity distribution in all immunoblots.
RT-PCR procedure.
Tissue was placed in RNALater (Qiagen) and stored at −70°C until RNA was isolated using the RNeasy Protect Mini Kit (Qiagen). cDNA was generated from RNA in the presence and absence of reverse transcriptase using the SuperScript III First-Strand Synthesis System for RT-PCR (Invitrogen) and random primers. To amplify mouse glutamine synthetase, we used the forward primer 5′-CTGATGGATGGCCCTACTGT-3′ and reverse primer 5′-CAACTTTCCCGGTACTGCAT-3′, which yields a product of 258 bp. PCR amplification of cDNA was performed using GoTaq Hot Start Polymerase (Promega, Madison, WI), an annealing temperature of 58°C, an extension time of 1 min, and 36 cycles. Amplified products were separated using electrophoresis and detected on a Kodak Image Station 440CF digital imaging system.
Statistics.
Results are presented as means ± SE; n refers to the numbers of animal studied. Statistical analyses were performed using an unpaired Student's t-test. P values of <0.05 were taken as statistically significant.
RESULTS
Glutamine synthetase expression in the normal mouse kidney.
We examined protein and mRNA expression using RT-PCR and immunoblot analysis of samples dissected from specific regions of the kidney. Immunoblot analysis demonstrated glutamine synthetase protein expression in the outer cortex, OMo, and OMi (Fig. 1A). RT-PCR showed that glutamine synthetase mRNA was present in both the cortex and OMi; no amplification was observed in the absence of reverse transcriptase, indicating that genomic DNA was not amplified (Fig. 1B). Glutamine synthetase expression in the outer cortex and OMo is consistent with expression in the entire proximal tubule. The finding of glutamine synthetase protein and mRNA expression in the OMi, however, where proximal tubule segments are not present, indicates the presence of glutamine synthetase in nonproximal tubule cells.
Fig. 1.

Glutamine synthetase (GS) protein and mRNA expression in different regions of the mouse kidney. A: GS protein expression by immunoblot analysis. A 45-kDa product was present in samples from the outer cortex, outer stripe of the outer medulla (OMo), and inner stripe of the outer medulla (OMi). B: results of RT-PCR amplification of mRNA obtained from the cortex and OMi. Amplification of a 258-bp product consistent with GS mRNA expression was observed using samples from the cortex and OMi when reverse transcriptase was performed (+rt) but not in the absence of reverse transcriptase (−rt). Thus, GS mRNA and protein are widely expressed in the mouse kidney and are present in sites in which proximal tubule cells are not present, specifically the OMi.
Single immunolabeling for glutamine synthetase.
We used immunohistochemistry with two different anti-glutamine synthetase antibodies to determine glutamine synthetase's specific cellular expression. Identical results were seen with the two antibodies. Glutamine synthetase immunoreactivity was present in PCTs throughout the cortex and in PSTs in the cortex and OMo (Fig. 2). PCT cells, in general, had intense glutamine synthetase immunoreactivity, although some PCT profiles had less intense immunostaining. The earliest portion of the PCT, identified by continuity with Bowman's capsule, frequently had relatively weak or heterogeneous glutamine synthetase staining. Glutamine synthetase immunostaining was distributed throughout the cell cytoplasm, with fainter staining of the brush border.
Fig. 2.

GS immunolabel in the mouse kidney. Top: low-power micrographs of normal mouse kidneys demonstrating GS immunolabel using two different primary antibodies against GS, mouse monoclonal antibody (left) and rabbit polyclonal antibody (right). Results were virtually identical with the two antibodies, with expression evident in the majority of epithelial cells in the cortex and OMo and in a small subpopulation of cells in the OMi. Bottom: higher-power micrographs of the cortex and outer medulla. In the cortex, strong immunolabel was present in the majority of tubules, which are composed of cells that have an apical brush border and are identifiable as proximal tubules. In a subpopulation of tubules, there was heterogeneous GS immunolabel, with intense expression in a subpopulation of cells. In the OMo, strong immunolabel in proximal straight tubules (PSTs) was evident. In addition, throughout the outer medulla, a subpopulation of collecting duct cells expressed strong GS immunolabel.
In addition to the proximal tubule, we also observed glutamine synthetase immunolabeling in a subpopulation of cells in the connecting segment and collecting duct segments from the initial collecting tubule through the initial inner medullary collecting duct (Fig. 3). The prevalence and morphology of labeled collecting duct cells suggested they were intercalated cells. Immunostaining was also evident in DCTs; the thick ascending limbs of Henle's loop were not labeled.
Fig. 3.

GS expression in the collecting duct. High-power micrographs of GS immunolabel in the cortex, OMo, OMi, and initial portion of the inner medulla showed strong immunolabel in a subpopulation of cells (arrows) in the initial collecting tubule and cortical collecting duct (CCD) in the cortex and throughout the medullary collecting duct. The number and morphology of these cells, with apical bulging into the lumen, suggest that they are intercalated cells. Labeled proximal tubules (*) in the cortex and OMo were also evident. All experiments were performed using the rabbit polyclonal antibody.
To confirm the specificity of the glutamine synthetase immunolabel observed, we performed several types of control experiments. First, experiments in which the primary antibody was omitted from the immunohistochemistry protocol uniformly resulted in no significant immunolabel being detected (data not shown). Second, as previously noted, we used two different antibodies directed against glutamine synthetase protein and observed identical results. Finally, we preincubated the rabbit anti-glutamine synthetase antibody with the immunizing peptide. Figure 4 shows representative results. Immunolabel reactivity was completely eliminated or dramatically reduced in all epithelial cells in which immunolabel was observed when antibody alone was used. These findings confirm the specificity of the immunoreactivity observed with these antibodies.
Fig. 4.

Effect of immunizing antigen preincubation with antibody on immunolabel. Mouse kidney sections underwent immunohistochemistry using either rabbit anti-GS primary antibody alone or primary antibody preadsorbed with a 20× excess of the antigenic peptide. Left: representative images from the cortex, OMo, and OMi from kidneys labeled with primary antibody alone. Right: representative images of the corresponding regions from kidneys labeled with primary antibody preadsorbed with excess immunizing peptide. Immunolabeling was virtually eliminated by peptide blocking. Kidneys were photographed using DIC optics to avoid the need for counterstaining to identify cellular profiles. PT, proximal tubule segments; DCT, distal convoluted tubule segments; CD, collecting duct segments. Arrows identify intercalated cells.
Double immunolabeling: glutamine synthetase with AE1, H+-ATPase, and NCC.
To specifically identify the distal tubule segments and individual collecting duct cell types with glutamine synthetase immunoreactivity, we performed a series of double-label immunohistochemistry experiments using anti-glutamine synthetase antibodies and antibodies that identify specific intercalated cell subtypes (AE1 and H+-ATPase) and the DCT (NCC).
We began by using double-immunolabel of glutamine synthetase with AE1, the anion exchanger expressed exclusively in type A intercalated cells. In the collecting duct, including the CCD, outer medullary collecting duct (OMCD), and inner medullary collecting duct (IMCD), all glutamine synthetase-positive cells expressed basolateral AE1 (Figs. 5 and 6). However, in the connecting segment and initial collecting tubule, there were both AE1-positive and AE1-negative cells that expressed glutamine synthetase (Fig. 5). In addition, there were cells with the appearance of intercalated cells that were glutamine synthetase negative. These observations indicate that in the CCD through the IMCD, only type A intercalated cells express glutamine synthetase; principal cells and type B intercalated cells have no detectable glutamine synthetase expression. However, in the connecting tubule (CNT) and initial collecting tubule (iCT), both type A intercalated cells and a population of AE1-negative cells with the morphological appearance of intercalated cells expressed glutamine synthetase immunoreactivity.
Fig. 5.

GS and anion exchanger 1 (AE1) double label in the medulla. Left: low-power micrographs of the OMo, OMi, and initial inner medulla (IMi) of mouse kidneys labeled for GS (brown) and AE1 (blue) using immunohistochemistry. Right: selected areas (boxes) at higher magnification. There was a 1:1 correlation between GS immunolabel and basolateral AE1 immunolabel expression (arrows) in the outer stripe of the outer medullary collecting duct, inner stripe of the outer medullary collecting duct, and inner stripe of the inner medullary collecting duct, indicating that GS is expressed in type A intercalated cells throughout the medullary collecting duct. GS expression was also evident in PST segments (*). No significant GS immunolabel was evident in other cells in the collecting duct or in the thick ascending limbs TAL.
Fig. 6.

GS and AE1 double label in the cortex. A: low-power micrograph of GS (brown) and AE1 (blue) immunolabel in the mouse cortex. B and C: selected areas (boxes) at higher magnification. In the connecting tubule (CNT; B), all cells with basolateral AE1 immunolabel expressed GS (arrows). In addition, there was a population of GS-positive cells that did not express detectable AE1 (arrowheads). In the CCD (C), all GS-positive cells expressed basolateral AE1 (arrows). In addition, there was a subpopulation of CCD cells with the morphological appearance of intercalated cells that did not express detectable GS immunolabel (white arrow).
We used double labeling of glutamine synthetase with H+-ATPase to further characterize the glutamine synthetase-positive cells in cortical segments. From the CNT through the IMCD, all glutamine synthetase-positive cells had intense apical H+-ATPase immunoreactivity (Fig. 7), indicating that all glutamine synthetase-positive cells were intercalated cells. Type B intercalated cells, identified by basolateral H+-ATPase, were present in the iCT and CCD and had no detectable glutamine synthetase (Fig. 7), indicating that type B intercalated cells do not express detectable glutamine synthetase protein. The finding that all glutamine synthetase-positive cells in the CNT express apical H+-ATPase indicates that the AE1-negative, glutamine synthetase-positive cells are non-A, non-B intercalated cells.
Fig. 7.

Double immunolabel of GS with H+-ATPase or with Na+-Cl− cotransporter (NCC). A: high-power micrograph of a CCD with double immunolabel for GS (blue) and H+-ATPase (brown). Only cells with apical H+-ATPase immunolabel, i.e., type A intercalated cells, expressed GS immunolabel (arrowheads). CCD cells with apical and basolateral H+-ATPase, i.e., type B intercalated cells, did not express detectable GS immunolabel (arrows). Principal cells, which have little to no detectable H+-ATPase label, did not express detectable GS immunolabel. B: high-power micrograph of GS (blue) and H+-ATPase (brown) double immunolabel in a DCT to CNT transition. In the CNT, all GS-positive cells had strong apical H+-ATPase immunolabel (arrowheads). CNT cells, i.e., those cells in the CNT that lack strong apical H+-ATPase immunolabel, did not have detectable GS immunolabel (white arrows). However, DCT cells, identified here by morphological criteria, did have GS immunolabel (black arrows). C: double immunolabel of GS (blue) with the DCT-specific transporter NCC (brown). DCT cells, which had apical NCC immunolabel, expressed GS immunolabel (arrows), but at lower levels than the majority of PTs. In the adjacent CNT, intercalated cells with GS immunolabel (black arrowheads) and CNT cells, which lack significant GS expression (white arrows), were present.
We then used double immunolabel of glutamine synthetase with NCC, the NaCl cotransporter expressed solely in DCT cells, to confirm the identity of the nonproximal tubule, noncollecting duct profiles in the cortex that expressed glutamine synthetase. These experiments demonstrated moderate glutamine synthetase immunoreactivity in cells with apical NCC immunolabel, confirming our observations from the single-immunolabeling experiments showing that DCT cells express glutamine synthetase (Fig. 7).
Effect of dietary K+ restriction.
In view of the observation of glutamine synthetase in multiple distinct renal epithelial cell types, we sought to determine whether glutamine synthetase expression was regulated similarly or differently in different cell populations. We chose a model of hypokalemia induced by a K+-free diet for 12 days, which we have recently characterized (1, 22). This model results in increased renal ammonia excretion associated with activation of PDG and PEPCK, enzymes involved in proximal tubule ammoniagenesis, yet no acid-base disturbance, at least in the mouse in this model in our laboratory (1, 22).
Immunohistochemistry demonstrated dramatic changes in glutamine synthetase expression. At low magnification, overall glutamine synthetase immunolabel in the cortex and OMo from hypokalemic mice was greatly reduced compared with mice that received control diet (Fig. 8). This decrease is consistent with our recent report (1) using this identical model showing decreased total renal glutamine synthetase expression in renal homogenates in response to hypokalemia. The overall decrease in these regions observed at low magnification was due to a marked decrease in immunolabel in both PCTs and PSTs throughout the cortex and OMo (Fig. 8). The decrease in label intensity appeared to be greater in cortical proximal tubules than in OMo proximal tubules.
Fig. 8.

Immunohistochemistry showing the effect of hypokalemia on GS expression in PTs. Left: control kidney; right: hypokalemic kidney. Top: low-power micrographs of GS immunolabel in control and hypokalemic kidneys. A dramatic decrease in GS immunolabel in the cortex and OMo, regions where proximal tubules predominate, was evident. Middle top, middle bottom, and bottom: higher-power micrographs of GS immunolabel in proximal convoluted tubules (PCT) in the cortex and PSTs in the cortex and OMo of control and hypokalemic mice. A marked and widespread decrease in GS expression in response to hypokalemia was evident in PCTs and PSTs. Control and hypokalemia tissues were preserved, embedded, and immunolabeled in the same experiments using identical procedures and were visualized and photographed in the same session using the same microscope and camera settings.
To confirm and quantify these qualitative observations of decreased glutamine synthetase expression in the proximal tubule, we performed digital quantitative analysis of the immunohistochemistry. Quantitative analyses of the immunolabel in the initial PCT, the cortical PST in the medullary ray, and the PST in the OMo demonstrated a significant decrease in glutamine synthetase immunolabeling in each of these segments during hypokalemia (Fig. 9). Compared with control conditions, hypokalemia decreased glutamine synthetase label intensity by 39 ± 4% in the initial PCT, 44 ± 3% in the cortical PST, and 33 ± 6% in the PST in the OMo (n = 4 hypokalemic kidneys and 4 control kidneys for each comparison, P < 0.01 for each). Label intensity in the DCT was also significantly reduced during hypokalemia to 43% below control values (n = 4 hypokalemic kidneys and 4 control kidneys for each comparison, P < 0.05).
Fig. 9.

Quantitative analyses of GS immunohistochemistry in the PT. A: mean PT cell expression. B: cell height. Quantitation of GS immunolabel in three segments of the PT demonstrated a significant decrease in GS immunoreactivity in each of these tubule segments after 12 days of K+-free diet. The segments analyzed were the portion of the PCT continuous with Bowman's capsule (1st PCT), the PST in the medullary ray (cortical PST), and the PST in the OMo (OM PST). n = 4 hypokalemic kidneys and 4 control kidneys for each comparison. *P < 0.05.
The response of intercalated cells in the CCD and OMCD differed from the response of the proximal tubule. Immunohistochemistry showed increased glutamine synthetase expression in a subpopulation of cells in the CCD and OMCD, segments where only type A intercalated cells express glutamine synthetase in the normal mouse kidney. Both the number and morphology of glutamine synthetase-positive cells in the collecting duct of hypokalemic mice suggested that they were type A intercalated cells, i.e., that the collecting duct cell types expressing glutamine synthetase did not change with hypokalemia. To confirm this, we performed double immunolabeling of glutamine synthetase with AE1. Consistent with findings in animals on normal rodent chow, all collecting duct cells with glutamine synthetase immunolabel also expressed basolateral AE1 immunolabel, and vice versa (Fig. 10). Thus, hypokalemia did not change the type of collecting duct cells that express glutamine synthetase, but it does appear to result in a substantial increase in intercalated cell glutamine synthetase expression.
Fig. 10.
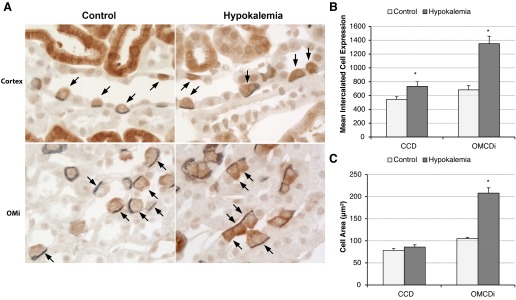
Immunohistochemistry and quantitative analyses demonstrating that hypokalemia increases type A intercalated cell size and GS expression. A: double immunolabel of GS (brown) with AE1 (blue) in collecting ducts of control and hypokalemic mice. In both control (left) and hypokalemic (right) kidneys, there was a one-to-one correlation between GS expression and AE1 expression, identifying GS-positive cells as type A intercalated cells. In response to hypokalemia, intercalated cells in both the CCD (top) and OMCDi (bottom) appeared to be hypertrophied and exhibited increased GS immunolabel. B: quantitative analysis of GS immunolabel intensity (in arbitrary units) in individual intercalated cells in the CCD and OMCDi. Hypokalemia induced significant increases in GS expression in type A intercalated cells in both the CCD and OMCDi. C: quantitative analysis of the type A intercalated cell profile area. Hypokalemia induced a significant increase in the OMCDi intercalated cell profile area. n = 4 hypokalemic kidneys and 4 control kidneys for each comparison. *P < 0.05.
To confirm the qualitative observation of increased glutamine synthetase expression in intercalated cells in the CCD and OMCD, we modified our previous method of digital quantitative immunohistochemistry (18) to enable the quantification of total immunolabel intensity in single cells. This technique also enabled simultaneous assessment of cell profile area. Using this approach, we confirmed that hypokalemia increased intercalated cell glutamine synthetase immunolabel expression significantly in both the CCD and inner stripe of the OMCD (OMCDi; Fig. 10). Intercalated cell size also significantly increased in OMi intercalated cells (Fig. 10), consistent with previous observations in the rat kidney (11, 15). Since only type A intercalated cells in the CCD and OMCD expressed glutamine synthetase, these findings demonstrate increased per cell expression in CCD and OMCDi type A intercalated cells in response to hypokalemia. In the OMCDi, the increased per cell expression paralleled increased cell size, such that mean glutamine synthetase expression adjusted for cell area did not change significantly (P = not significant).
To confirm this finding, we assessed total glutamine synthetase protein in the OMi, a site where the only renal epithelial cells expressing glutamine synthetase are OMCDi type A intercalated cells. Immunoblot analysis showed that glutamine synthetase band density was not significantly changed by hypokalemia, indicating that the abundance of glutamine synthetase relative to other inner stripe proteins was unchanged (Fig. 11). Since hypokalemia causes hypertrophy, and consequently increased total protein expression, in the OMi (11, 14), the finding of no change in glutamine synthetase immunoblot density in the inner stripe indicates that glutamine synthetase expression parallels total protein expression and thus that absolute glutamine synthetase expression is increased in this region. Thus, glutamine synthetase expression in response to hypokalemia is regulated differently in the proximal tubule, where expression is decreased, and in type A intercalated cells in the CCD and OMCD, where total expression is increased.
Fig. 11.

Immunoblot analysis of GS expression in the OMi in response to hypokalemia. Top: GS expression in the OMi of control and hypokalemic mice. Bottom: quantitative analysis. Hypokalemia did not significantly alter GS expression relative to total protein expression [n = 3 in each group, P = not significant (NS) by t-test]. Since hypokalemia induced hypertrophy and concomitantly increased total protein expression in the OMi, these results indicate increased total GS expression.
In the iCT and CNT in K+-deficient mice, as in K+ control mice, only cells with the appearance and incidence of intercalated cells expressed glutamine synthetase, and some glutamine synthetase-positive cells in these segments were AE1 positive and others were AE1 negative. No change in the number of labeled cells was evident with K+ deficiency, and cells with the morphological appearance of CNT cells and principal cells remained glutamine synthetase negative. Thus, in the iCT and CNT of hypokalemic mice, both type A and non-A, non-B intercalated cells had glutamine synthetase immunoreactivity; there was no apparent change in the cell types expressing detectable glutamine synthetase immunoreactivity compared with K+ control kidneys.
DISCUSSION
Renal ammonia metabolism and excretion are critical components of the renal maintenance of systemic acid-base balance. Most previous studies of renal ammonia metabolism have focused on the regulation of ammoniagenesis and renal epithelial cell ammonia transport, whereas the present study focused on a third component of renal ammonia metabolism, the reaction of ammonia with glutamate to form glutamine, a reaction that produces H+ and reduces intrarenal ammonia and thereby decreases the ammonia available for urinary excretion. The results of the present study show that glutamine synthetase is expressed widely in the mouse kidney, throughout the entire proximal tubule, in type A intercalated cells, in non-A, non-B intercalated cells, and in DCT cells. The regulation of expression in different cell types is specific, with hypokalemia decreasing expression throughout the entire proximal tubule and increasing expression in type A intercalated cells in the collecting duct. This widespread expression of glutamine synthetase combined with cell-specific regulation has important implications for our understanding of renal ammonia metabolism.
The first major finding in the persent study was that glutamine synthetase is widely expressed throughout the entire proximal tubule. We showed high levels of glutamine synthetase protein expression in the outer cortex, OMo, and OMi and showed that glutamine synthetase mRNA is also expressed in the OMi as well as renal cortex, findings indicating expression in more than just the PST. We verified, using immunohistochemistry, that high levels of glutamine synthetase immunolabel are present throughout the entire proximal tubule, from PCT cells adjacent to Bowman's capsule to the PST in the OMo. Thus, the mouse proximal tubule, in addition to being able to produce ammonia, also assimilates ammonia, combining it with glutamate to form glutamine. Because this process releases H+ (10), it counterbalances the HCO3− produced in the process of ammoniagenesis, thereby blunting net bicarbonate generation.
Previous studies of rat, rabbit, and mouse kidneys have reported different results regarding glutamine synthetase's expression in the kidney. In studies (4, 26) in the rat kidney, glutamine synthetase activity and protein were found exclusively in the PST in the OMo and inner cortex. A study (4) in the rabbit identified glutamine synthetase activity in both the PCT and PST and in “distal straight tubules,” older terminology for thick ascending limbs of Henle's loop. Studies (19, 24) in the mouse kidney identified glutamine synthetase mRNA expression in the renal cortex but did not determine cell-specific expression. Another study (29) of mouse kidneys showed glutamine synthetase immunoreactivity throughout the entire proximal tubule, which is consistent with the present study. However, the earlier study (29) did not report finding glutamine synthetase in other renal epithelial cell types.
The second major finding in the present study is that glutamine synthetase was expressed in type A and non-A, non-B intercalated cells but not in type B intercalated cells. Both type A and non-A, non-B intercalated cells express the ammonia transporters Rhbg and Rhcg (13, 17, 27, 30), and several studies have demonstrated that Rhbg and Rhcg in intercalated cells are necessary for normal renal ammonia excretion (2, 3, 20, 21) and that Rhcg is required for normal rates of collecting duct ammonia transport (3). Glutamine synthetase expression in type A and non-A, non-B intercalated cells suggests that these cells not only secrete ammonia via Rhbg and Rhcg but that they also contain mechanisms that regulate the amount of intracellular ammonia available for secretion. The absence of detectable glutamine synthetase expression in the type B intercalated cells suggest a greatly diminished role, relative to type A intercalated cells and non-A, non-B intercalated cells, in ammonia metabolism, which parallels the lack of expression of either Rhbg or Rhcg, and is consistent with the role of the type B intercalated cell in HCO3− secretion and Cl− reabsorption and not in urine acidification or ammonia metabolism.
We also identified glutamine synthetase expression in the DCT. The amount of glutamine synthetase expression, at least as estimable from immunolabel intensity, was substantially less than observed in the majority of proximal tubules. The specific role of the DCT in renal ammonia metabolism is incompletely understood. However, given that a mathematical modeling study (34) proposed that the DCT is likely to reabsorb rather than to secrete ammonia, the presence of glutamine synthetase in this site, and the observation in the present study that hypokalemia decreases DCT glutamine synthetase expression, support the possibility that glutamine synthetase catalyzes the assimilation of reabsorbed ammonia with glutamate to form glutamine and thereby contributes to regulation of renal ammonia excretion.
The third major finding in the present study was that glutamine synthetase expression is regulated differently in different epithelial cells in the mouse kidney, at least in response to hypokalemia. Decreased expression in the proximal tubule appears to be a component of a generalized response of these cells to increase net ammoniagenesis in response to hypokalemia. There is increased expression of the glutamine transporter SN1/SNAT3 and of the major enzymes involved in ammoniagenesis, including phosphate-dependent glutaminase, glutamate dehydrogenase, and phosphoenolpyruvate carboxykinase (1, 5, 16, 22). Thus, decreased glutamine synthetase expression, by decreasing the proximal tubule capacity for recycling NH4+ back to glutamine, contributes to, and likely augments, hypokalemia's stimulation of proximal tubule net ammoniagenesis. In particular, changes in proximal tubule net ammoniagenesis are quantitatively greater and occur more rapidly than the changes in ammoniagenic enzyme expression (9). The findings that glutamine synthetase is present throughout the entire proximal tubule (present study) and that its expression and/or activity in the proximal tubule can be regulated by physiological stimuli, such as hypokalemia (present study) and metabolic acidosis (2, 6, 7, 23), suggest that changes in proximal tubule glutamine synthetase expression and activity are critical components of the proximal tubule response to conditions that alter net ammoniagenesis.
Glutamine synthetase expression in type A intercalated cells in the CCD and OMCD increased in response to hypokalemia, which contrasts to the findings in the proximal tubule. During hypokalemia, type A intercalated cell expression of the ammonia transporters Rhbg and Rhcg is enhanced, suggesting increased ammonia transport by intercalated cells (14, 22). Interestingly, the site of greatest increase in Rhbg and Rhcg expression is the basolateral plasma membrane, suggesting a preferential increase in basolateral ammonia uptake (14, 22). Increased glutamine synthetase activity, by accelerating the NH4+ reaction with glutamate to form glutamine, would reduce the intracellular ammonia available for secretion across the apical membrane. Physiologically, this might limit net collecting duct ammonia secretion and thereby limit the development of metabolic alkalosis that could otherwise develop with very high levels of ammonia excretion. Finally, the difference in the cellular response to dietary K+ deficiency with respect to glutamine synthetase expression suggests not only that the role of glutamine synthetase in hypokalemia differs in proximal tubule and type A intercalated cells but also that the regulatory mechanisms controlling glutamine synthetase expression are specific for these epithelial cells.
In summary, the present study demonstrates important new findings with regard to the role of glutamine synthetase in renal ammonia metabolism. First, glutamine synthetase expression is much wider than previously recognized, including the entire proximal tubule, DCT, and type A and non-A, non-B intercalated cells in the collecting duct and CNT. Second, glutamine synthetase expression is regulated, but the regulation differs in different epithelial cells in the kidney, with substantial decreases in the proximal tubule and DCT response to hypokalemia and a simultaneous increase in expression in acid-secreting intercalated cells. These novel observations indicate that renal glutamine synthetase likely plays an important and integrated role in the regulation of renal ammonia metabolism.
GRANTS
This work was supported by National Institute of Diabetes and Digestive and Kidney Diseases Grant DK-045788 and by Department of Veterans Affairs Merit Review Grant 1I01BX000818.
DISCLOSURES
No conflicts of interest, financial or otherwise, are declared by the author(s).
AUTHOR CONTRIBUTIONS
Author contributions: J.W.V. and I.D.W. conception and design of research; J.W.V., D.C., H.-W.L., and M.E.H. performed experiments; J.W.V. and D.C. analyzed data; J.W.V., M.E.H., and I.D.W. interpreted results of experiments; J.W.V., M.E.H., and I.D.W. prepared figures; J.W.V. drafted manuscript; J.W.V., D.C., H.-W.L., M.E.H., and I.D.W. edited and revised manuscript; J.W.V., H.-W.L., M.E.H., and I.D.W. approved final version of manuscript.
Footnotes
The term “ammonia” is used in this report to refer to the combination of both molecular species NH3 and NH4+. When referring specifically to either of these molecular forms of ammonia, we state specifically either “NH3” or “NH4+.”
REFERENCES
- 1.Bishop JM, Lee HW, Handlogten ME, Han KH, Verlander JW, Weiner ID. Intercalated cell-specific Rh B glycoprotein deletion diminishes renal ammonia excretion response to hypokalemia. Am J Physiol Renal Physiol 304: F422–F431, 2013 [DOI] [PMC free article] [PubMed] [Google Scholar]
- 2.Bishop JM, Verlander JW, Lee HW, Nelson RD, Weiner AJ, Handlogten ME, Weiner ID. Role of the Rhesus glycoprotein, Rh B glycoprotein, in renal ammonia excretion. Am J Physiol Renal Physiol 299: F1065–F1077, 2010 [DOI] [PMC free article] [PubMed] [Google Scholar]
- 3.Biver S, Belge H, Bourgeois S, Van Vooren P, Nowik M, Scohy S, Houillier P, Szpirer J, Szpirer C, Wagner CA, Devuyst O, Marini AM. A role for Rhesus factor Rhcg in renal ammonium excretion and male fertility. Nature 456: 339–343, 2008 [DOI] [PubMed] [Google Scholar]
- 4.Burch HB, Choi S, McCarthy WZ, Wong PY, Lowry OH. The location of glutamine synthetase within the rat and rabbit nephron. Biochem Biophys Res Commun 82: 498–505, 1978 [DOI] [PubMed] [Google Scholar]
- 5.Busque SM, Wagner CA. Potassium restriction, high protein intake, and metabolic acidosis increase expression of the glutamine transporter SNAT3 (Slc38a3) in mouse kidney. Am J Physiol Renal Physiol 297: F440–F450, 2009 [DOI] [PubMed] [Google Scholar]
- 6.Conjard A, Komaty O, Delage H, Boghossian M, Martin M, Ferrier B, Baverel G. Inhibition of glutamine synthetase in the mouse kidney: a novel mechanism of adaptation to metabolic acidosis. J Biol Chem 278: 38159–38166, 2003 [DOI] [PubMed] [Google Scholar]
- 7.Damian AC, Pitts RF. Rates of glutaminase I and glutamine synthetase reactions in rat kidney in vivo. Am J Physiol 218: 1249–1255, 1970 [DOI] [PubMed] [Google Scholar]
- 8.de Brito-Ashurst I, Varagunam M, Raftery MJ, Yaqoob MM. Bicarbonate supplementation slows progression of CKD and improves nutritional status. J Am Soc Nephrol 20: 2075–2084, 2009 [DOI] [PMC free article] [PubMed] [Google Scholar]
- 9.DiGiovanni SR, Madsen KM, Luther AD, Knepper MA. Dissociation of ammoniagenic enzyme adaptation in rat S1 proximal tubules and ammonium excretion response. Am J Physiol Renal Fluid Electrolyte Physiol 267: F407–F414, 1994 [DOI] [PubMed] [Google Scholar]
- 10.Eisenberg D, Gill HS, Pfluegl GM, Rotstein SH. Structure-function relationships of glutamine synthetases. Biochim Biophys Acta 1477: 122–145, 2000 [DOI] [PubMed] [Google Scholar]
- 11.Elger M, Bankir L, Kriz W. Morphometric analysis of kidney hypertrophy in rats after chronic potassium depletion. Am J Physiol Renal Fluid Electrolyte Physiol 262: F656–F667, 1992 [DOI] [PubMed] [Google Scholar]
- 12.Goraya N, Wesson DE. Acid-base status and progression of chronic kidney disease. Curr Opin Nephrol Hypertens 21: 552–556, 2012 [DOI] [PubMed] [Google Scholar]
- 13.Han KH, Croker BP, Clapp WL, Werner D, Sahni M, Kim J, Kim HY, Handlogten ME, Weiner ID. Expression of the ammonia transporter, Rh C glycoprotein, in normal and neoplastic human kidney. J Am Soc Nephrol 17: 2670–2679, 2006 [DOI] [PMC free article] [PubMed] [Google Scholar]
- 14.Han KH, Lee HW, Handlogten ME, Bishop JM, Levi M, Kim J, Verlander JW, Weiner ID. Effect of hypokalemia on renal expression of the ammonia transporter family members, Rh B glycoprotein and Rh C glycoprotein, in the rat kidney. Am J Physiol Renal Physiol 301: F823–F832, 2011 [DOI] [PMC free article] [PubMed] [Google Scholar]
- 15.Hansen GP, Tisher CC, Robinson RR. Response of the collecting duct to disturbances of acid-base and potassium balance. Kidney Int 17: 326–337, 1980 [DOI] [PubMed] [Google Scholar]
- 16.Hossain SA, Chaudhry FA, Zahedi K, Siddiqui F, Amlal H. Cellular and molecular basis of increased ammoniagenesis in potassium deprivation. Am J Physiol Renal Physiol 301: F969–F978, 2011 [DOI] [PubMed] [Google Scholar]
- 17.Kim HY, Verlander JW, Bishop JM, Cain BD, Han KH, Igarashi P, Lee HW, Handlogten ME, Weiner ID. Basolateral expression of the ammonia transporter family member, Rh C glycoprotein, in the mouse kidney. Am J Physiol Renal Physiol 296: F545–F555, 2009 [DOI] [PMC free article] [PubMed] [Google Scholar]
- 18.Kim HY, Baylis C, Verlander JW, Han KH, Reungjui S, Handlogten ME, Weiner ID. Effect of reduced renal mass on renal ammonia transporter family, Rh C glycoprotein and Rh B glycoprotein, expression. Am J Physiol Renal Physiol 293: F1238–F1247, 2007 [DOI] [PubMed] [Google Scholar]
- 19.Kuo CF, Darnell JE., Jr Mouse glutamine synthetase is encoded by a single gene that can be expressed in a localized fashion. J Mol Biol 208: 45–56, 1989 [DOI] [PubMed] [Google Scholar]
- 20.Lee HW, Verlander JW, Bishop JM, Igarashi P, Handlogten ME, Weiner ID. Collecting duct-specific Rh C glycoprotein deletion alters basal and acidosis-stimulated renal ammonia excretion. Am J Physiol Renal Physiol 296: F1364–F1375, 2009 [DOI] [PMC free article] [PubMed] [Google Scholar]
- 21.Lee HW, Verlander JW, Bishop JM, Nelson RD, Handlogten ME, Weiner ID. Effect of intercalated cell-specific Rh C glycoprotein deletion on basal and metabolic acidosis-stimulated renal ammonia excretion. Am J Physiol Renal Physiol 299: F369–F379, 2010 [DOI] [PMC free article] [PubMed] [Google Scholar]
- 22.Lee HW, Verlander JW, Bishop JM, Handlogten ME, Han KH, Weiner ID. Renal ammonia excretion in response to hypokalemia: effects of collecting duct-specific Rh C glycoprotein deletion. Am J Physiol Renal Physiol 304: F410–F421, 2013 [DOI] [PMC free article] [PubMed] [Google Scholar]
- 23.Lemieux G, Baverel G, Vinay P, Wadoux P. Glutamine synthetase and glutamyltransferase in the kidney of man, dog, and rat. Am J Physiol 231: 1068–1073, 1976 [DOI] [PubMed] [Google Scholar]
- 24.Lie-Venema H, de Boer PA, Moorman AF, Lamers WH. Role of the 5′ enhancer of the glutamine synthetase gene in its organ-specific expression. Biochem J 323: 611–619, 1997 [DOI] [PMC free article] [PubMed] [Google Scholar]
- 25.Nagami GT. Ammonia production and secretion by isolated perfused proximal tubule segments. Miner Electrolyte Metab 16: 259–263, 1991 [PubMed] [Google Scholar]
- 26.Schoolwerth AC, deBoer PA, Moorman AF, Lamers WH. Changes in mRNAs for enzymes of glutamine metabolism in kidney and liver during ammonium chloride acidosis. Am J Physiol Renal Fluid Electrolyte Physiol 267: F400–F406, 1994 [DOI] [PubMed] [Google Scholar]
- 27.Seshadri RM, Klein JD, Smith T, Sands JM, Handlogten ME, Verlander JW, Weiner ID. Changes in the subcellular distribution of the ammonia transporter Rhcg, in response to chronic metabolic acidosis. Am J Physiol Renal Physiol 290: F1443–F1452, 2006 [DOI] [PubMed] [Google Scholar]
- 28.Taylor L, Curthoys NP. Glutamine metabolism: role in acid-base balance. Biochem Mol Biol Educ 32: 291–304, 2004 [DOI] [PubMed] [Google Scholar]
- 29.van Straaten HW, He Y, van Duist MM, Labruyere WT, Vermeulen JL, van Dijk PJ, Ruijter JM, Lamers WH, Hakvoort TB. Cellular concentrations of glutamine synthetase in murine organs. Biochem Cell Biol 84: 215–231, 2006 [DOI] [PubMed] [Google Scholar]
- 30.Verlander JW, Miller RT, Frank AE, Royaux IE, Kim YH, Weiner ID. Localization of the ammonium transporter proteins, Rh B glycoprotein and Rh C glycoprotein, in the mouse kidney. Am J Physiol Renal Physiol 284: F323–F337, 2003 [DOI] [PubMed] [Google Scholar]
- 31.Wagner CA. Metabolic acidosis: new insights from mouse models. Curr Opin Nephrol Hypertens 16: 471–476, 2007 [DOI] [PubMed] [Google Scholar]
- 32.Weiner ID, Hamm LL. Molecular mechanisms of renal ammonia transport. Annu Rev Physiol 69: 317–340, 2007 [DOI] [PMC free article] [PubMed] [Google Scholar]
- 33.Weiner ID, Verlander JW. Role of NH3 and NH4+ transporters in renal acid-base transport. Am J Physiol Renal Physiol 300: F11–F23, 2011 [DOI] [PMC free article] [PubMed] [Google Scholar]
- 34.Weinstein AM. A mathematical model of distal nephron acidification: diuretic effects. Am J Physiol Renal Physiol 295: F1353–F1364, 2008 [DOI] [PMC free article] [PubMed] [Google Scholar]