

Abstract
The epithelial Na+ channel (ENaC) in the distal nephron constitutes the rate-limiting step for renal sodium reabsorption. Aldosterone increases tubular sodium absorption in large part by increasing αENaC transcription in collecting duct principal cells. We previously reported that Af9 binds to +78/+92 of αENaC and recruits Dot1a to repress basal and aldosterone-sensitive αENaC transcription in mouse inner medullary collecting duct (mIMCD)3 cells. Despite this epigenetic repression, basal αENaC transcription is still evident and physiologically necessary, indicating basal operation of positive regulators. In the present study, we identified Sp1 as one such regulator. Gel shift and antibody competition assays using a +208/+240 probe revealed DNA-Sp1-containing complexes in mIMCD3 cells. Mutation of the +222/+229 element abrogated Sp1 binding in vitro and in promoter-reporter constructs stably expressed in mIMCD3 cells. Compared with the wild-type promoter, an αENaC promoter-luciferase construct with +222/+229 mutations exhibited much lower activity and impaired trans-activation in Sp1 overexpression experiments. Conversely, Sp1 knockdown inhibited endogenous αENaC mRNA and the activity of the wild-type αENaC promoter but not the mutated construct. Aldosterone triggered Sp1 recruitment to the αENaC promoter, which was required for maximal induction of αENaC promoter activity and was blocked by spironolactone. Sequential chromatin immunoprecipitation assays and functional tests of +78/+92 and +222/+229 αENaC promoter mutants indicated that while Sp1, Dot1a, and Af9 co-occupy the αENaC promoter, the Sp1 effects are functionally independent from Dot1a and Af9. In summary, Sp1 binding to a cis-element at +222/+229 represents the first identified constitutive driver of αENaC transcription, and it contributes to maximal aldosterone trans-activation of αENaC.
Keywords: epigenetic, chromatin, transcription factor, gene expression
epithelial na+ channel (ENaC) is expressed in the apical membrane of salt-absorbing epithelia of kidney, distal colon, and lung where it constitutes the rate-limiting step in active Na+ and fluid absorption. In the renal collecting duct (CD), ENaC expressed in the apical membrane in concert with the basolateral Na+-K+-ATPase mediates Na+ reabsorption, and thereby contributes importantly to the control of extracellular fluid volume and blood pressure (4). ENaC consists of α-, β-, and γ-subunits, which are encoded by the Scnn1a (“αENaC” in this report), Scnn1b, and Scnn1c genes. Of these genes, αENaC appears to be critical to overall salt balance, as evidenced by the finding that targeted inactivation of αENaC in the connecting tubule (CNT)/CD of mice results in severe renal salt wasting characteristic of a pseudohypoaldosteronism type I phenotype (6). Moreover, αENaC also appears to be rate-limiting for aldosterone induction of ENaC activity in the CD, since aldosterone administration or hyperaldosteronism induced by a low-Na+ diet increases αENaC gene transcription, without increasing β- or γ-subunit expression or αENaC mRNA turnover (14).
Although it is known that ENaC functional activity is strictly dependent on the level of αENaC expression in the CD principal cells (14), only limited information exists regarding the specific mechanisms governing its transcriptional regulation. Under basal conditions, αENaC gene transcription is active, but constrained. It can be induced by aldosterone and other stimuli, including the immediate early gene Sgk1 and the circadian regulatory protein casein kinase (CK)1δ/ε (8), even in the absence of steroids (7). While it has long been known that aldosterone stimulates αENaC transcription in CD cells (14) and that part of this response is mediated through the action of aldosterone, liganded to the mineralocorticoid receptor (MR), acting at a glucocorticoid-responsive element (GRE) at −811 of the αENaC gene (11), MR-independent effects have also been described. Notably, mice with CNT/CD-specific knockout of the MR did not develop the severe salt-wasting phenotype (19) observed with αENaC knockout in these same segments (6). Indeed, we discovered epigenetic repression/derepression pathways in mouse inner medullary collecting duct (mIMCD)3 cells controlling a major component of basal and aldosterone-sensitive αENaC gene transcription, which involves combinatorial interactions of histone methyltransferase Dot1a with either Sirt1 (26) or Af9 (27–29). Af9 binds +78/+92 in the R3 subregion (−57/+438) of the αENaC promoter and recruits Dot1a to this position to basally repress promoter αENaC transcription in mIMCD3 cells (30). Aldosterone relieves this repression by dispersing the Dot1a-Af9 complex from the αENaC promoter, prompting histone H3 Lys79 hypomethylation, thereby favoring a chromatin configuration that induces αENaC transcription (27–29). As proof of principle, mice with CNT/CD-specific targeted inactivation of Dot1a were found to exhibit greater αENaC mRNA levels compared with controls (30).
Despite the basal constraints of Dot1a-Af9 on the αENaC promoter, basal αENaC transcription is nonetheless evident and, indeed, functionally necessary for physiologic control of salt and body fluid volume balance. Thus, positive regulatory elements that drive basal transcription of the αENaC gene in CD principal cells must exist. The proximal αENaC gene control region lacks TATA and CAAT boxes, but does contain GC-rich sequences proximal to the transcription start site that could serve as binding sites for Specificity protein (Sp)-1, a member of the Sp/Krüppel-like factor (KLF) transcription factors (Sp/KLF factors hereafter). Accordingly, the present study was designed to examine three questions. First, what factor(s) drives, albeit in a constrained manner, αENaC transcription to meet normal ion transport demands in the CD? Second, how does this basal “driver” integrate with the Dot1a-Af9 basal repression mechanism? Third, does this basal driver contribute to aldosterone induction of the αENaC gene? We discovered that Sp1 binding to a +222/+229 cis-element of the αENaC promoter contributes significantly as a basal driver of αENaC, acting independently from and overcoming the Dot1a-Af9 repressor complex. In addition, aldosterone further enhances Sp1 occupancy of the αENaC promoter; this is required for full induction of promoter activity and is blocked by the MR antagonist spironolactone.
MATERIALS AND METHODS
Reagents and plasmids.
Aldosterone was from Sigma (St. Louis, MO). The SYBR GreenER qPCR SuperMix Universal and Lipofectamine 2000 reagent were purchased from Invitrogen (Carlsbad, CA). The LightShift Chemiluminescent EMSA kit was form Pierce (Rockford, IL). Several plasmids have been previously described (27–29): pGL3-basic-1.3ENaCα contains the murine αENaC promoter fused to the gene-encoding firefly luciferase; pcDNA3.1-Zeo-1.3ENaCα-Luc contains the 1.3-kb ENaCα promoter and luciferase-coding cassette from pGL3-basic-1.3ENaCα subcloned into pcDNA3.1-Zeo; pcDNA3.1-Zeo-1.3ENaCαΔAf9+78/+92-Luc harbors point mutations in the Af9 element between +78 and +92; pFLAG-Af9 and pEGFP-Dot1a are expression plasmids encoding epitope-tagged Af9 and Dot1a. A new construct, pcDNA3.1-Zeo-1.3ENaCα-Luc (WT) or pcDNA3.1-Zeo-1.3ENaCαΔSp1+222/+229-Luc (Δ+222/+229), which contains point mutations in the Sp1 element between +222 and +229 (Fig. 1), was generated by the Quick Change Site-directed Mutagenesis Kit (Stratagene, Santa Clara, CA), according to the manufacturer's protocols. DNA-sequencing analysis verified all mutations. The Sp1 expression plasmid pBS-Sp1 was from Addgene (Cambridge, MA). Antibodies directed against Sp1 (07–645, Millipore), Sp3 (07–107, Millipore), Af9 (70R-8261, Fitzgerald), Dot1L (EB06356, Everest Biotech), and P84/THOC1 (sc-136426, Santa Cruz Biotechnology) were purchased from commercial vendors.
Fig. 1.
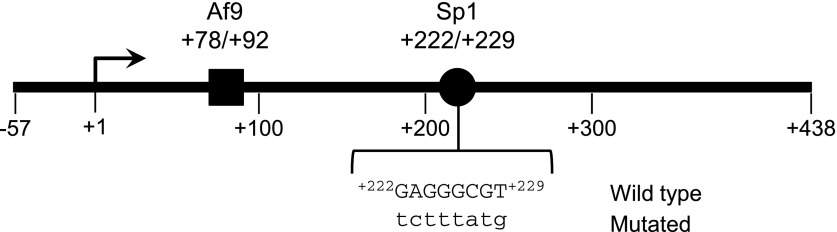
Map of the R3 subregion of the αENaC 5′-flanking region. The nucleotide positions of the Sp1 and Af9 elements are schematized. The wild-type and mutated +222/+229 sequences used for EMSA and trans-activation assays are also indicated.
mIMCD3 cell culture, aldosterone treatment, transient and stable transfections, and luciferase assays.
Culture of mIMCD3 cells, aldosterone treatment, transient and stable transfections, and luciferase assays of promoter activity were performed as described (28, 29). mIMCD3 cells were cultured at 37°C in a 5% CO2 environment in DMEM/F-12 plus 10% fetal bovine serum. For aldosterone treatment experiments, the cells were cultured in medium of the same composition, except containing 10% charcoal-stripped fetal bovine serum for at least 24 h, before 1 nM or 1 μM aldosterone or 0.01% ethanol was added as vehicle control. Throughout the text, except as indicated, 1 μM aldosterone was used. Cell lines stably transfected with pcDNA3.1-Zeo-1.3ENaCα-Luc and pcDNA3.1-Zeo-1.3αENaCΔAf9+78/+92-Luc (30) have been characterized. Additional stable cell lines were generated by transfecting mIMCD3 cells with pcDNA3.1-Zeo-1.3αENaCΔSp1+222/+229-Luc, followed by clonal selection under Zeocin treatment. Promoter activities were assayed using the Dual-Luciferase Reporter Assay System (Promega, Madison, WI) and were normalized to cell protein content. siRNA knockdown was performed using the Lipofectamine 2000 reagent (Life Technologies, Grand Island, NY) and control (sc-37007, Santa Cruz Biotechnology) and Sp1-specific (sc-29488, Santa Cruz Biotechnology) siRNAs by methods previously described (30).
EMSA and antibody competition assays.
A double-strand Sp1 oligomer corresponding to nucleotides +208 to +240 of the αENaC promoter (wild-type: 5′-GTCAGCTGGGCCAAGAGGGCGTGAAAGCCGGAGA-3′; mutation: 5′-GTCAGCTGGGCCAAtctttatgGAAAGCCGGAGA-3′) was 3′ end-labeled with biotin using the Biotin 3′ End DNA labeling kit (Pierce). For antibody competition assays, 0.2–2.0 μg of rabbit polyclonal antibodies against Sp1, Sp3, or nonimmune IgG were used. After being transferred to nylon membranes, biotin-labeled DNA was detected by using LightShift Chemiluminescent EMSA kit (Pierce) according to the manufacturer's instructions.
Chromatin immunoprecipitation/qPCR, re-chromatin immunoprecipitation/qPCR, and RT-qPCR.
Chromatin immunoprecipitation (ChIP)/qPCR and re-ChIP/qPCR were performed and analyzed essentially as previously described (27, 29) using the ChiP-IT Express Enzymatic Kit and Re-ChIP-IT kit (Active Motif), except that antibodies directed against Sp1, Af9, and Dot1a were used and only the R3 subregion (−57 to +438) of the αENaC promoter was examined. Briefly, mIMCD3 cells were fixed with formaldehyde, harvested, and chromatin was enzymatically sheared according to the manufacturer's protocol. Chromatin immune precipitates were isolated on protein G magnetic beads using 2 μg of Sp1, Af9, or Dot1a antibodies or 2 μg IgG. These antibody amounts were determined to be optimal in pilot titration experiments. After being washed, the chromatin immune precipitates were eluted, reverse cross-linked, and subjected to agarose gel analysis and qPCR. For re-ChIP, chromatin immune precipitates from the first ChIP were desalted over columns, incubated with the protein G magnetic beads and second antibody or IgG, and processed as above. ChIPs were normalized to input DNA and the IgG control. RT-qPCR to measure αENaC and GAPDH mRNA levels in mIMCD3 cells utilized methods and primers as previously described (16).
Immunoblots.
Cytoplasmic and nuclear extracts from mIMCD3 cells were prepared using the Nuclear/Cytosol Fractionation Kit (BioVision) according to the manufacturer's manual. Samples (40 μg) of nuclear and cytoplasmic protein extracts were resolved by SDS-PAGE, and the proteins were electrophoretically transferred to polyvinylidene difluoride membranes (Hybond ECL; Amersham). The blots were probed with antibodies against Sp1 or P84/THOC1 (as a housekeeping nuclear protein) at 0.2 μg/ml overnight at 4°C. The blots were washed extensively with a solution containing 50 mM Tris, pH 8.0, 138 mM NaCl, 2.7 mM KCl, and 0.05% Tween 20. The antigen-antibody complexes were detected by the enhanced chemiluminescence protocol using horseradish peroxidase-conjugated donkey anti-rabbit IgG or anti-mouse IgG as secondary antibody.
Data analysis.
Quantitative data are expressed as means ± SE and were analyzed for statistical significance by one-way ANOVA or Student's t-test as appropriate. P values <0.05 were taken as significant.
RESULTS
Sp1 binds to the αENaC +222/+229 element.
Analysis of the murine αENaC promoter region using the Transcription Element Search System (http://www.cbil.upenn.edu/tess) revealed that +222/+229 conforms to an Sp1 consensus sequence as in Fig. 1. We previously demonstrated that Sp1 is basally expressed in mIMCD3 cells (25). To determine whether endogenous Sp1 binds to the +222/+229 cis-element of αENaC, EMSAs with mIMCD3 cell nuclear extracts and a wild-type oligomer corresponding to +208/+240 or a mutant +208/+240 oligomer, in which +222/+229 was mutated (Fig. 1), were performed. As seen in Fig. 2A, three DNA-protein complexes were formed using mIMCD3 nuclear extracts with the +208/+240 oligomer. The abundance of complex A was consistently abrogated by addition of a 40-fold molar excess of unlabeled wild-type +208/+240 oligomer but not by the mutant +208/+240 oligomer (Fig. 2A), indicating that complex A represents a +222/+229-specific DNA-protein complex. The two lower migrating, nonspecific complexes were not altered by unlabeled wild-type oligomer. In antibody interference assays, antibody against Sp1 almost completely eliminated complex A, with no appreciable changes in the abundance of the other complexes (Fig. 2B). Nonimmune IgG (as a control) and antibody against Sp3 were without effect on any of the DNA-protein complexes (Fig. 2B). These results are consistent with an effect of anti-Sp1 antibody to disrupt the DNA-protein complex A. Collectively, these EMSA and antibody interference data indicate that endogenous Sp1 is involved primarily in the formation of the specific DNA-protein complex A. Since complex A was not entirely abolished, it is possible that additional proteins contribute in a minor way to this DNA-protein complex.
Fig. 2.

Sp1 protein binds to +222/+229 of the αENaC promoter. A: EMSA in which a biotin-labeled duplex probe corresponding to +208 to +240 of the mouse αENaC promoter was incubated with 10 μg of mouse inner medullary collecting duct (mIMCD)3 cell nuclear extracts alone (lane 1) or in the presence of a 40-fold molar excess of wild-type unlabeled probe (lane 2) or mutant unlabeled probe (lane 3). Gel is representative of 4 experiments. B: antibody interference assays were performed using 2 μg of nonimmune IgG or rabbit polyclonal antibodies against Sp1 or Sp3 (as a specificity control). Sp1 antibody decreased formation of complex A, whereas Sp3 antibody had no effect. Gel is representative of 4 experiments. C: mutations of the +222/+229 site as in Fig. 1 were introduced into pcDNA3.1-Zeo-1.3ENaCα-Luc to create pcDNA3.1-Zeo-1.3ENaCαΔSp1+222/+229-Luc as described under materials and methods. Stable mIMCD3 cell lines harboring the pcDNA3.1-Zeo-1.3ENaCα-Luc (WT) or pcDNA3.1-Zeo-1.3ENaCαΔSp1+222/+229-Luc (Δ+222/+229) constructs were established. Chromatin immunoprecipitation (ChIP)/qPCR experiments with anti-Sp1 antibody and primers to amplify the R3 subregion were conducted. The value for the final amplicon/input DNA obtained from the WT cells was set as 1, and that of the Δ+222/+229 was normalized to it. Error bars indicate ± SE. *P < 0.05 vs. WT; n = 3.
To establish the importance of the +222/+229 site to Sp1 binding in the context of chromatin, mIMCD3 cell lines stably expressing pcDNA3.1-Zeocin-1.3ENaCα-Luc (“WT”) or pcDNA3.1-Zeo-1.3ENaCαΔSp1+222/+229-Luc (“ΔSp1+222/+229”) were established and subjected to ChIP/qPCR with anti-Sp1 antibody (or IgG as a negative control) and primers designed to amplify the R3 subregion of the αENaC promoter. As seen in Fig. 2C, the ΔSp1+222/+229 promoter exhibited greatly reduced enrichment of Sp1 compared with the WT promoter. The fact that some residual Sp1 binding was retained despite the ΔSp1+222/+229 mutation suggests that another Sp1 sequence may reside in the rest of the 1.3-kb gene control region included in the promoter reporter construct.
+222/+229 Sp1 element positively regulates basal and aldosterone-stimulated αENaC promoter activity.
To determine the functional relevance of the +222/+229 Sp1 element, we tested the basal luciferase activity of the WT and ΔSp1+222/+229 mIMCD3 cell lines (as used in Fig. 2C). The results (Fig. 3) revealed robust activity of the WT promoter, whereas the activity for the ΔSp1+222/+229 promoter was ∼40% lower (Fig. 3), indicating the functional importance of the mutated element in basal αENaC promoter function. To determine directly whether Sp1 trans-activates the αENaC promoter via binding to the +222/+229 site, the WT and ΔSp1+222/+229 cell lines were transiently transfected with an Sp1 expression (“pBS-Sp1”) plasmid or its empty parental vector and then treated with vehicle or aldosterone. The total amounts of DNA transfected were held constant. We previously demonstrated that this protocol reproducibly increases Sp1 expression by sixfold in mIMCD3 cells (Fig. 2B in Ref. 25). As shown in the histogram of reporter gene activity in Fig. 4A, Sp1 overexpression trans-activated basal and aldosterone-stimulated activities of the WT promoter-reporter by 42 and 34%, respectively, but not those of the ΔSp1+222/+229 promoter-reporter.
Fig. 3.

Mutation of the +222/+229 Sp1 binding site in the αENaC gene inhibits promoter activity. The stable mIMCD3 cell lines harboring the pcDNA3.1-Zeo-1.3ENaCα-Luc (WT) or pcDNA3.1-Zeo-1.3ENaCαΔSp1+222/+229-Luc (Δ+222/+229) constructs established in Fig. 2 were assayed for luciferase activities and normalized to cell protein content. The value obtained for WT-transfected cells was set to 1. The values shown are the mean of triplicate determinations or 4 independent experiments. Error bars indicate ± SE. *P < 0.05 vs. WT.
Fig. 4.

Sp1 trans-activates αENaC via the +222/+229 Sp1 element. A: stable mIMCD3 cell lines harboring the pcDNA3.1-Zeo-1.3ENaCα-Luc (WT) or pcDNA3.1-Zeo-1.3ENaCαΔSp1+222/+229-Luc (ΔSp1+222/+229) constructs in Fig. 2 were transiently transfected with an Sp1 expression vector or its gutless vector. After 24 h, the cells were treated with vehicle or aldosterone for 24 h, and then the firefly activities were measured and normalized to cell protein content. The value obtained for vehicle-treated, empty vector-transfected cells harboring pcDNA3.1-Zeo-1.3ENaCα-Luc (WT) was set to 1, and the other conditions were normalized to it. The values shown are the mean of triplicate determinations or 4 independent experiments. Error bars indicate ± SE. *P < 0.05 vs. vehicle-treated, empty vector-transfected WT controls. **P < 0.05 vs. aldosterone-treated, empty vector-transfected WT controls. B: pcDNA3.1-Zeo-1.3ENaCα-Luc (WT) and pcDNA3.1-Zeo-1.3ENaCαΔSp1+222/+229-Luc (ΔSp1+222/+229) cell lines were transiently transfected with control siRNA or Sp1-specific siRNA. After 24 h, the cells were treated with vehicle or aldosterone for 24 h, and then the firefly activities were measured and normalized to cell protein content. The value obtained for control siRNA-transfected cells harboring pcDNA3.1-Zeo-1.3ENaCα-Luc (WT) was set to 1, and the other conditions were normalized to it. The values shown are the mean of triplicate determinations of 3 independent experiments. Error bars indicate ± SE. *P < 0.05 vs. vehicle-treated, control siRNA-transfected. **P < 0.05 vs. aldosterone-treated, control siRNA-transfected.
Since endogenous Sp1 is basally expressed at high levels in mIMCD3 cells (25), these Sp1 overexpression experiments may not represent the full impact of Sp1 on basal αENaC transcription. Accordingly, we used RNA interference to test the impact of endogenous Sp1 depletion on the basal activity of pcDNA3.1-Zeocin-1.3ENaCα-Luc (“WT”) and of pcDNA3.1-Zeo-1.3ENaCαΔSp1+222/+229-Luc (“ΔSp1+222/+229”). We previously showed that this siRNA protocol results in a 70% reduction in Sp1 nuclear protein compared with mIMCD3 cells transfected with an equimolar amount of negative control siRNA (Fig. 3A in Ref. 25). Consistent with our hypothesis that Sp1 trans-activates the WT promoter via the +222/+229 element, basal and aldosterone-stimulated pcDNA3.1-Zeocin-1.3ENaCα-Luc activities were 59 and 53% lower, respectively, in the cells transfected with Sp1 siRNA compared with the control-transfected cells (Fig. 4B). In contrast, Sp1 silencing did not significantly affect the activity of the pcDNA3.1-Zeo-1.3ENaCαΔSp1+222/+229-Luc construct under basal or aldosterone-treated conditions (Fig. 4B), consistent with the fact that the ChIP/qPCR results showed dramatic impairment of Sp1 binding to this promoter template (Fig. 2C). In agreement with the promoter activity data, cells transfected with Sp1 siRNA also exhibited basal and aldosterone-stimulated endogenous αENaC mRNA levels that were 50 and 30% lower, respectively, than cells transfected with negative control siRNA (Fig. 5).
Fig. 5.

Sp1 knockdown reduces αENaC mRNA expression in mIMCD3 cells. The cells were transfected with control siRNA or Sp1-specific siRNA. After 24 h, the cells were treated with vehicle or aldosterone for 24 h, and then total RNA was harvested, and αENaC and GAPDH mRNA levels were measured by qRT-PCR. The normalized ENaCα/GAPDH mRNA levels are presented. *P < 0.05 vs. vehicle-treated, control siRNA-transfected. **P < 0.05 vs. aldosterone-treated, control siRNA-transfected; n = 3.
Sp1 regulation of αENaC is independent of that mediated by Dot1a/Af9.
Since one potential explanation for the stimulatory effects of Sp1 on basal αENaC transcription might be that Sp1 antagonizes binding of Af9 to the R3 subregion of the αENaC promoter, we performed sequential ChIP experiments with antibodies to Af9 or Sp1 (or IgG as a negative control) and αENaC primers targeting the R3 subregion to determine whether they co-occupy the promoter in mIMCD3 cells. The chromatin immunoprecipitates with the Af9 antibody were reimmunoprecipitated with antibodies specific for Sp1 or IgG. Reciprocal sequential ChIP/qPCR (Sp1 ChIP followed by Af9 or IgG re-ChIP) was also performed. Agarose gel analysis of the ChIP and re-ChIP samples produced with the antibodies yielded the expected PCR product, whereas the IgG samples exhibited negligible signal (Fig. 6A). qPCR analysis of reverse cross-linked DNAs from the second round of immunoprecipitates, normalized to background IgG, confirmed enrichment of Af9 or Sp1 in the re-ChIP samples (Fig. 6B). The quantitative differences between the two reciprocal sequential ChIPs (Fig. 6B) likely represent differences in the stability of the Af9 vs. Sp1 antibodies with chromatin throughout the procedure. Collectively, these results indicate that Sp1 and Af9 co-occupy the R3 subregion of the αENaC promoter.
Fig. 6.

Sequential ChIP analysis showing co-occupancy of Af9 and Sp1 at the R3 (−57/+438) subregion of the αENaC promoter. Chromatin from mIMCD3 cells was sequentially immunoprecipitated with the Af9 antibody or IgG (“First ChIP”), followed by re-ChIP with anti-Sp1 antibody or IgG (as a negative control). Reciprocal ChIP with Sp1 or IgG, followed by re-ChIP with Af9 or IgG, was also performed. Precipitated R3 subregion segments were detected using agarose gels (A: representative of 3 independent experiments) and quantified by qPCR (B: n = 3). Relative chromatin enrichment was calculated as described in materials and methods.
We next tested whether Af9 can bind to the +222/+229 Sp1 element. Immunopurified FLAG-Af9 (30) was used in EMSA with the +208/+240 oligomers as in Fig. 2A. Despite exhaustive attempts using a variety of binding conditions, we could not detect a sequence-specific gel shift with FLAG-Af9 (n = 5, not shown). Similarly, we tested whether Sp1 might bind to the neighboring +78/+92 Af9 element by determining whether the Sp1 antibody could supershift or inhibit the Af9-DNA complex using the Af9 oligomer +74/+107 we previously used (30). There was no change in the migration or abundance of the Af9-DNA protein complexes (n = 3, not shown). We conclude that an interaction of Af9 with the +222/+229 Sp1 site or of Sp1 with the +78/+92 Af9 element does not occur under these conditions. We then questioned whether Sp1 might partner with Af9 through protein-protein interactions. We performed coimmunoprecipitation experiments in which immunoprecipitation of mIMCD3 nuclear extracts with anti-Sp1 antibody was followed by immunoblotting with anti-Af9 antibody. Reciprocal coimmunoprecipitations were performed (n = 3). We also performed GST pull-down experiments with GST-Af9 to capture Sp1 from mIMCD3 cell lysates (n = 4, not shown). With either method, no definitive evidence of Sp1-Af9 protein-protein interaction was observed.
We also performed ChIP/qPCR assays using the mIMCD3 cell lines stably expressing the wild-type and Sp1 +222/+229 mutant promoter-reporter constructs to determine whether impaired Sp1 binding to the mutant promoter affects Af9 or Dot1a enrichment in chromatin associated with the R3 subregion. As seen in Fig. 7, A and B, no significant differences in Af9 or Dot1 occupancy, respectively, were observed between the wild-type and Sp1 +222/+229 mutant templates. Consistent with these ChIP/qPCR results, the activity of stably expressed pcDNA3.1-Zeo-1.3ENaCαΔSp1+222/+229-Luc was comparable in cells transiently transfected with pEGFP-mDot1a or empty vector-transfected cells (Fig. 7C). We previously demonstrated that pEGFP-mDot1a transfection reproducibly yields Dot1a protein overexpression in mIMCD3 cells (Fig. 6 in Ref. 27). Moreover, the activity of the Af9 +78/+92 binding site mutant pcDNA3.1-Zeo-1.3ENaCαΔAf9+78/+92-Luc was virtually identical in cells transfected with empty vector or the Sp1 expression plasmid pBS-Sp1 (Fig. 7D). The collective results indicate that Sp1 and Af9 bind and function independently through their respective cis-elements in the αENaC R3 subregion and that the effects of Sp1 are functionally independent of those exerted by the Dot1a/Af9 complex.
Fig. 7.
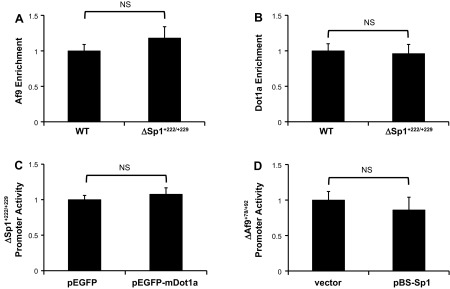
Reciprocal effects of Sp1 and Dot1a/Af9 on αENaC promoter occupancy and activity are independent. A: chromatin from mIMCD3 cells stably transfected with pcDNA3.1-Zeo-1.3ENaCα-Luc (WT) or the Sp1 binding site mutant pcDNA3.1-Zeo-1.3ENaCαΔSp1+222/+229-Luc (ΔSp1+222/+229) was immunoprecipitated with the Af9 antibody or IgG. Precipitated R3 subregion segments were quantified by qPCR (n = 3). The value for Af9-IP amplicon/input DNA obtained from pcDNA3.1-Zeo-1.3ENaCα-Luc (WT) was set to 1, and the value from pcDNA3.1-Zeo-1.3ENaCαΔSp1+222/+229-Luc (ΔSp1+222/+229) was normalized to it. The values shown are the mean of triplicate determinations of 3 independent experiments. Error bars indicate ± SE. No statistically significant differences between group means were detected. B: chromatin from mIMCD3 cells stably transfected with pcDNA3.1-Zeo-1.3ENaCα-Luc (WT) or the Sp1 binding site mutant pcDNA3.1-Zeo-1.3ENaCαΔSp1+222/+229-Luc (ΔSp1+222/+229) was immunoprecipitated with the Dot1a antibody or IgG. Precipitated R3 subregion segments were quantified by qPCR (n = 3). The value for Dot1a-IP amplicon/input DNA obtained from pcDNA3.1-Zeo-1.3ENaCα-Luc (WT) was set to 1, and the value from pcDNA3.1-Zeo-1.3ENaCαΔSp1+222/+229-Luc (ΔSp1+222/+229) was normalized to it. The values shown are the mean of triplicate determinations of 3 independent experiments. Error bars indicate ± SE. No statistically significant differences between group means were detected. C: mIMCD3 cells stably transfected with pcDNA3.1-Zeo-1.3ENaCα-Luc (WT) or the Sp1 binding site mutant pcDNA3.1-Zeo-1.3ENaCαΔSp1+222/+229-Luc (ΔSp1+222/+229) were transiently transfected with a EGFP-mDot1a expression vector or EGFP vector. After 24 h, the firefly activities were measured and normalized to cell protein content. The value obtained for EGFP-transfected cells was set to 1, and that of the pEGFP-mDOt1a-transfected cells was normalized to it. The values shown are the mean of triplicate determinations of 3 independent experiments. Error bars indicate ± SE. No statistically significant differences between group means were detected. D: mIMCD3 cells stably transfected with pcDNA3.1-Zeo-1.3ENaCα-Luc (WT) or the Af9 binding site mutant pcDNA3.1-Zeo-1.3ENaCαΔAf9+78/+92 were transiently transfected with empty vector or the Sp1 expression vector pBS-Sp1. After 24 h, the firefly activities were measured and normalized to cell protein content. The value obtained for vector-transfected cells was set to 1, and that of the pBS-Sp1-transfected cells was normalized to it. The values shown are the mean of triplicate determinations of 3 independent experiments. Error bars indicate ± SE. No statistically significant differences between group means were detected.
Aldosterone promotes Sp1 occupancy of the αENaC promoter.
Whereas the pcDNA3.1-Zeo-1.3ENaCαΔSp1+222/+229-Luc construct exhibited a fold-increase in aldosterone-stimulated promoter activity in the Sp1 trans-activation and knockdown experiments that was comparable with the WT promoter-reporter construct, the absolute magnitude of induction of the mutated construct was significantly less than that of the WT construct (Fig. 4, A and B). Accordingly, we tested whether aldosterone (1 nM or 1 μM) induced additional Sp1 occupation of the αENaC promoter beyond basal levels. We performed ChIP/qPCR analysis of Sp1 occupancy at the αENaC R3 subregion following vehicle or aldosterone treatment of mIMCD3 cells for 2 h. We selected this time point because in previous ChIP/qPCR time course studies, we demonstrated that aldosterone triggered RNA pol II occupancy (together with significant decreases in both Af9 occupancy and associated Dot1a-mediated histone H3 trimethylated K79) beginning at 2 h of aldosterone treatment in mIMCD3 cells (30). Consistent with the fact that the GRE resides outside R3, we also did not observe MR occupancy of the αENaC R3 subregion in those studies (30). As seen in Fig. 8A, 1 μM (but not 1 nM) aldosterone treatment resulted in a significant increase in Sp1 occupation of the R3 subregion at 2 h, an effect that was blocked by the MR antagonist spironolactone. Immunoblots of nuclear extracts showed no significant differences in Sp1 nuclear abundance between vehicle- and 1-μM aldosterone-treated mIMCD3 cells (Fig. 8B), indicating that the additional recruitment of Sp1 occurred from a nascent pool of Sp1 protein.
Fig. 8.

Aldosterone promotes Sp1 recruitment to the R3 (−57/+438) subregion of the αENaC promoter without altering Sp1 protein levels. A: mIMCD3 cells were cultured in DMEM/F12 plus 10% charcoal-stripped serum and then treated with vehicle, 1 μM aldosterone, 1 μM spironolactone, or 1 μM aldosterone and 1 μM spironolactone for 2 h as indicated. The cells were harvested and chromatin was prepared. ChIP/qPCR assays (n = 3) with the anti-Sp1 antibody and primers to amplify the R3 subregion. The value for the final amplicon/input DNA obtained from the vehicle-treated cells was set as 1, and the aldosterone treatment values were normalized to it. Error bars indicate ± SE. *P < 0.05 vs. corresponding vehicle control. B: immunoblots of nuclear and cytoplasmic extracts from the vehicle- and aldosterone-treated cells were probed with antibodies directed against Sp1 or P84 (as a nuclear protein marker). Densitometric analysis was performed and the Sp1/P84 ratio was calculated. The value for vehicle-treated cells was set as 1, and the aldosterone treatment values were normalized to it (n = 3).
DISCUSSION
An integrated genetic-epigenetic model of αENaC gene regulation requires knowledge of the action of constitutive and inducible transcription factors, constitutive and inducible chromatin-modifying enzymes, and their interplay. Our analysis of the αENaC 5′-flanking region previously revealed that the R3 subregion (Fig. 1) is the major site for aldosterone-sensitive and MR-independent epigenetic control of αENaC transcription by Dot1a in mIMCD3 cells and contains a functional Af9 cis-element at +78/+92 that nucleates this effect. In this study, we build on this earlier work by demonstrating in mIMCD3 cells that Sp1 is required as a basal trans-activator of the αENaC gene by binding to an Sp1 element at +222/+229 of the αENaC proximal promoter. Several lines of evidence suggest that the action of Sp1 at +222/+229 is independent of the repressive effects of the neighboring Dot1a-Af9 complex: 1) Sp1 and Af9 did not interact in coimmunoprecipitation assays or GST pull-down assays (not shown); 2) FLAG-Af9 did not bind the +222/+229 element in gel shift assays (not shown); 3) mutation of the Sp1 element at +222/+229 did not alter Af9 (Fig. 7A) or Dot1a (Fig. 7B) occupancy at the R3 subregion compared with the wild-type αENaC promoter; 4) Dot1a overexpression did not alter the activity of the Sp1 +222/+229 mutant αENaC promoter (Fig. 7C); and 5) Sp1 overexpression did not alter the activity of the Af9 +78/+92 mutant αENaC promoter (Fig. 7D). Finally, we discovered, unexpectedly, that aldosterone triggers further increases in Sp1 occupation of the R3 subregion of the αENaC promoter (Fig. 8A) without increasing nuclear levels of Sp1 (Fig. 8B) and that this response is blocked by the MR antagonist spironolactone (Fig. 8A) and is required to achieve the maximal magnitude of αENaC transcriptional induction (Fig. 4, A and B).
The effect of Sp1 on the αENaC promoter in mIMCD3 cells was likely direct and mediated principally by DNA binding, since mutation of the +222/+229 element disrupted the Sp1 DNA-binding activity in vitro (Fig. 2A) and in the context of chromatin in intact cells (Fig. 2C), impaired basal αENaC promoter activity when introduced into the promoter-reporter plasmid (Fig. 3), abrogated Sp1-mediated trans-activation of the αENaC promoter in overexpression experiments (Fig. 4A), and rendered the αENaC promoter completely unresponsive to the inhibitory effects of Sp1 siRNA (Fig. 4B). The binding of Sp1 to this region was specific since the formation of the complex A was inhibited by the addition of an excess of unlabeled sequence, but not by an excess of unlabeled sequence in which the +222/+229 element was mutated (Fig. 2A). The fact that Sp1 antibody did not completely abolish complex A suggests that other proteins may contribute to a small degree to the complex. We do not believe that Af9, Sp3, or Sp4 are present in the complex, since we did not detect an effect of Af9 or Sp3 antibodies to alter the abundance or mobility of complex A, and we previously demonstrated that Sp4 is not expressed in mIMCD3 cells (25).
In addition to the liganded MR (11), another inducible stimulus of αENaC transcription—the circadian clock protein Period 1 (Per1)—has been described. Mice with global knockout of the circadian clock protein Per1 exhibit αENaC levels in the inner medulla and increased urinary sodium excretion compared with wild-type control mice (10). siRNA knockdown of Per1 resulted in lower levels of αENaC mRNA in mIMCD3 cells (10). Although transient cotransfection of Per1 with a human αENaC promoter-luciferase construct in these mIMCD3 cells did enhance the basal αENaC promoter activity (10), other evidence suggests that the effects of Per1 are triggered by inducible circadian regulatory networks. For example, in a qualitative assay of nascent transcription, no effect of Per1 knockdown on the basal expression of endogenous αENaC hnRNA was evident in two of three replicates in mIMCD3 cells (Fig. 6A in Ref. 10), although an effect was evident in the mpkCCDC14 cell line (9). Further studies in the mpkCCDC14 cell line revealed that 1) under basal conditions, Per1 binds only weakly to each of four E-boxes in the αENaC promoter under basal conditions in DNA affinity precipitation assays (9) and 2) the effect of Per1 to enhance αENaC mRNA levels was dependent on the action of the circadian regulatory protein CK1δ/ε (8) to trigger Per1 nuclear entry and Per1 interaction with the circadian protein Clock (9, 17). Thus, while Per1 may contribute to the known circadian variation in αENaC gene expression (10), it apparently does not account for the large component of basal αENaC transcription that is not subject to circadian control (10) but required for basal salt and body fluid volume homeostasis. Rigorous studies controlling for circadian influences to analyze any potential interaction of Per1 with the basal transcriptional machinery of αENaC in CD cells will be required.
In previous work, we demonstrated that the MR blocker spironolactone only partially inhibited aldosterone induction of αENaC promoter activity (26), suggesting MR-dependent and -independent effects of aldosterone on αENaC transcription in mIMCD3 cells, and consistent with findings that mice with CNT/CD-specific knockout of the MR exhibited reduced, but still evident, αENaC expression compared with wild-type mice (19). In the present study, we found that spironolactone completely abolished the aldosterone induction of Sp1 binding to the αENaC (Fig. 8), suggesting that this aldosterone-induced Sp1 occupancy is MR-dependent. We did not observe this effect with 1 nM aldosterone, indicating that this may be relevant only in states of aldosterone excess. Since the known GRE at −811 to which the liganded MR binds (11) is remote from the Sp1 site, and no MR occupancy is evident in the R3 subregion of the αENaC promoter in aldosterone-treated mIMCD3 cells (30), DNA-looping in chromatin may be responsible for the MR dependence of the Sp1 effect in aldosterone induction of αENaC transcription. Precise regulation of gene transcription often requires such interactions between spatially remote cis-acting regulatory sequences with the looping out of the intervening DNA. Further studies with chromosome conformation capture and ChIP-loop methods will be required to test this hypothesis.
It is now clear that aldosterone induces αENaC transcription by orchestrating a complex series of transcriptional events that includes both classical trans-activation and epigenetic derepression mechanisms. Aldosterone trans-activation of αENaC is mediated principally by the action of the liganded MR binding to a GRE at −811 of the αENaC promoter, but also includes the actions of Per1 binding to an E-box at −689 (17, 20) and MR-dependent Sp1 binding to its cognate element as described in the present report. The epigenetic mechanism, which we previously characterized, involves dispersal of a Dot1a-Af9 from the +78/+92 Af9 element of the αENaC promoter, Sgk1-dependent phosphorylation of Af9 with disruption of the Dot1a-Af9 complex (29), and consequent histone H3K79 hypomethylation (30). These aldosterone-dependent trans-activation and epigenetic derepression mechanisms appear to be coincident based on time course experiments, but independent. For example, in contrast to the ability of aldosterone to downregulate expression levels of Dot1a (27), Af9 (27), and Sirt1 (26) in mIMCD3 cells to make these repressors less abundant and available to the αENaC promoter, aldosterone upregulates Per1 expression in CD cells (10), but does not affect the expression level of Sp1 in mIMCD3 cells (Fig. 7), instead triggering Sp1 recruitment to the αENaC promoter. Moreover, while Sp1 has been shown to trans-activate the Sgk promoter in some experimental conditions (1), and phosphorylation regulates Sp1 trafficking (24), Sgk1 is not known to phosphorylate and regulate Sp1.
Sp1 regulates the expression of numerous genes that have GC-rich, typically TATA-less promoters (24), including αENaC. In such TATA-less and/or GC-rich promoters, Sp1 binds its target DNA sequence via three tandem zinc finger motifs in its COOH terminus and may nucleate recruitment of other transcription factors or cofactors, such as TATA-binding protein-associated factors, which then engage other components of the transcriptional machinery such as transcription factor IID to initiate transcription (15). Despite its ubiquitous expression, numerous studies, including those of Sp1 knockout mice (24), indicate that Sp1 often functions in a cell type-, stimulus-, and gene-specific manner. Various cell-specific binding partners, chromatin modifiers, and signaling events dictate this specificity. For example, Sp1 trans-activates the genes encoding filtrin (18) and podocalyxin (5) specifically in podocytes. Sp1 is critically involved in epithelial-mesenchymal transition transcriptional networks (22), control of circadian clock genes (13), and tops the list of promoter-enhancer modules involved in differentiation of human stem cells (12). As other examples, Sp1 is part of the TNF-α enhanceosome (21), controls a variety of estrogen-inducible genes (23), and the glucocorticoid responsiveness of the AT1b receptor gene (2). Additionally, posttranslational modifications, such as phosphorylation, glycosylation, ubiquitinylation, acetylation, ribosylation, and SUMOylation, affect Sp1 regulation of target genes in various cell types (3). Whether specific posttranslational modifications account for the aldosterone-induced recruitment of additional, nascent Sp1 to +222/+229 of αENaC in mIMCD3 cells (Fig. 8A) remains open for investigation, but since this Sp1 recruitment occurred in the absence of detectable changes nuclear Sp1 protein abundance (Fig. 8B), a posttranslational signaling event seems plausible. Given that the major regulators of basal (Dot1a, Af9, and Sp1), and circadian (Per1) αENaC transcription are also expressed in cell types in which αENaC is not expressed, discovery and characterization of the cell-specific determinants for αENaC transcription in CD principal cells are very important. Further studies are required to address this question.
The present results do not address the effects of Sp1 on ENaC activity, the key physiologic response. Despite our efforts with collaborators who are experts in ENaC channel activity measurements, we have been frustrated in our attempts to reproducibly and directly measure ENaC activity in mIMCD3 cells subjected to experimental manipulation of transfections (for overexpression or knockdown of regulatory components) and culturing in charcoal-stripped serum for aldosterone induction: the results have been highly variable owing to the fragility of the cells. Thus, we could not test whether Sp1 overexpression or knockdown altered ENaC activity. We do know, however, that the ∼50% reduction in basal αENaC mRNA levels that we observed with Sp1 knockdown in this report (Fig. 5) is equivalent to that achieved with Dot1a overexpression in mIMCD3 cells (Fig. 4A in Ref. 16). The Dot1a-overexpressing mIMCD3 cells exhibited benzamil-sensitive intracellular Na+ concentrations (as an index of ENaC-mediated Na+ transport and as measured by changes in the signal of the intracellular fluorescence of sodium-binding benzofuran isophthalate-acetoxymethyl ester in single-cell fluorescence imaging) that were less than half of vector-transfected controls (Fig. 8E in Ref. 16). Thus, to the extent that equivalent αENaC mRNA levels can be extrapolated to ENaC activity, the Sp1 effects observed here are likely to be physiologically relevant.
In summary, we demonstrated that Sp1 binding to +222/+229 of αENaC independently offsets Dot1a-Af9-mediated epigenetic repression to foster basal αENaC transcription in CD cells. Moreover, aldosterone-mediated, MR-dependent enrichment of Sp1 at this element is required for maximal aldosterone induction of the gene. These results should enable a better understanding of how the balance of these opposing functions is altered during other states of altered αENaC transcription and in other epithelia.
GRANTS
This work was supported by National Institutes of Health Grant R01 DK075065 to B. C. Kone.
DISCLOSURES
No conflicts of interest, financial or otherwise, are declared by the author(s).
AUTHOR CONTRIBUTIONS
Author contributions: Z.Y., Q.K., and B.C.K. conception and design of research; Z.Y. and Q.K. performed experiments; Z.Y., Q.K., and B.C.K. analyzed data; Z.Y., Q.K., and B.C.K. interpreted results of experiments; Z.Y., Q.K., and B.C.K. prepared figures; Z.Y., Q.K., and B.C.K. edited and revised manuscript; Z.Y., Q.K., and B.C.K. approved final version of manuscript; B.C.K. drafted manuscript.
REFERENCES
- 1.Alliston TN, Maiyar AC, Buse P, Firestone GL, Richards JS. Follicle stimulating hormone-regulated expression of serum/glucocorticoid-inducible kinase in rat ovarian granulosa cells: a functional role for the Sp1 family in promoter activity. Mol Endocrinol 11: 1934–1949, 1997 [DOI] [PubMed] [Google Scholar]
- 2.Bogdarina IG, King PJ, Clark AJ. Characterization of the angiotensin (AT1b) receptor promoter and its regulation by glucocorticoids. J Mol Endocrinol 43: 73–80, 2009 [DOI] [PMC free article] [PubMed] [Google Scholar]
- 3.Bouwman P, Philipsen S. Regulation of the activity of Sp1-related transcription factors. Mol Cell Endocrinol 195: 27–38, 2002 [DOI] [PubMed] [Google Scholar]
- 4.Bubien JK. Epithelial Na+ channel (ENaC), hormones, hypertension. J Biol Chem 285: 23527–23531, 2010 [DOI] [PMC free article] [PubMed] [Google Scholar]
- 5.Butta N, Larrucea S, Alonso S, Rodriguez RB, Arias-Salgado EG, Ayuso MS, Gonzalez-Manchon C, Parrilla R. Role of transcription factor Sp1 and CpG methylation on the regulation of the human podocalyxin gene promoter. BMC Mol Biol 7: 17, 2006 [DOI] [PMC free article] [PubMed] [Google Scholar]
- 6.Christensen BM, Perrier R, Wang Q, Zuber AM, Maillard M, Mordasini D, Malsure S, Ronzaud C, Stehle JC, Rossier BC, Hummler E. Sodium and potassium balance depends on alphaENaC expression in connecting tubule. J Am Soc Nephrol 21: 1942–1951, 2010 [DOI] [PMC free article] [PubMed] [Google Scholar]
- 7.Debonneville C, Flores SY, Kamynina E, Plant PJ, Tauxe C, Thomas MA, Munster C, Chraibi A, Pratt JH, Horisberger JD, Pearce D, Loffing J, Staub O. Phosphorylation of Nedd4–2 by Sgk1 regulates epithelial Na+ channel cell surface expression. EMBO J 20: 7052–7059, 2001 [DOI] [PMC free article] [PubMed] [Google Scholar]
- 8.Etchegaray JP, Machida KK, Noton E, Constance CM, Dallmann R, Di Napoli MN, DeBruyne JP, Lambert CM, Yu EA, Reppert SM, Weaver DR. Casein kinase 1 delta regulates the pace of the mammalian circadian clock. Mol Cell Biol 29: 3853–3866, 2009 [DOI] [PMC free article] [PubMed] [Google Scholar]
- 9.Gumz ML, Cheng KY, Lynch IJ, Stow LR, Greenlee MM, Cain BD, Wingo CS. Regulation of alphaENaC expression by the circadian clock protein Period 1 in mpkCCD(c14) cells. Biochim Biophys Acta 1799: 622–629, 2010 [DOI] [PMC free article] [PubMed] [Google Scholar]
- 10.Gumz ML, Stow LR, Lynch IJ, Greenlee MM, Rudin A, Cain BD, Weaver DR, Wingo CS. The circadian clock protein Period 1 regulates expression of the renal epithelial sodium channel in mice. J Clin Invest 119: 2423–2434, 2009 [DOI] [PMC free article] [PubMed] [Google Scholar]
- 11.Kohler S, Pradervand S, Verdumo C, Merillat AM, Bens M, Vandewalle A, Beermann F, Hummler E. Analysis of the mouse Scnn1a promoter in cortical collecting duct cells and in transgenic mice. Biochim Biophys Acta 1519: 106–110, 2001 [DOI] [PubMed] [Google Scholar]
- 12.Kranz AL, Eils R, Konig R. Enhancers regulate progression of development in mammalian cells. Nucleic Acids Res 39: 8689–8702, 2011 [DOI] [PMC free article] [PubMed] [Google Scholar]
- 13.Mendez-Ferrer S, Lucas D, Battista M, Frenette PS. Haematopoietic stem cell release is regulated by circadian oscillations. Nature 452: 442–447, 2008 [DOI] [PubMed] [Google Scholar]
- 14.Mick VE, Itani OA, Loftus RW, Husted RF, Schmidt TJ, Thomas CP. The alpha-subunit of the epithelial sodium channel is an aldosterone-induced transcript in mammalian collecting ducts, and this transcriptional response is mediated via distinct cis-elements in the 5′-flanking region of the gene. Mol Endocrinol 15: 575–588, 2001 [DOI] [PubMed] [Google Scholar]
- 15.Pang RT, Lee LT, Ng SS, Yung WH, Chow BK. CpG methylation and transcription factors Sp1 and Sp3 regulate the expression of the human secretin receptor gene. Mol Endocrinol 18: 471–483, 2004 [DOI] [PubMed] [Google Scholar]
- 16.Reisenauer MR, Wang SW, Xia Y, Zhang W. Dot1a contains three nuclear localization signals and regulates the epithelial Na+ channel (ENaC) at multiple levels. Am J Physiol Renal Physiol 299: F63–F76, 2010 [DOI] [PMC free article] [PubMed] [Google Scholar]
- 17.Richards J, Greenlee MM, Jeffers LA, Cheng KY, Guo L, Eaton DC, Gumz ML. Inhibition of alphaENaC expression and ENaC activity following blockade of the circadian clock-regulatory kinases CK1delta/δ/ε. Am J Physiol Renal Physiol 303: F918–F927, 2012 [DOI] [PMC free article] [PubMed] [Google Scholar]
- 18.Ristola M, Arpiainen S, Saleem MA, Mathieson PW, Welsh GI, Lehtonen S, Holthofer H. Regulation of Neph3 gene in podocytes–key roles of transcription factors NF-kappaB and Sp1. BMC Mol Biol 10: 83, 2009 [DOI] [PMC free article] [PubMed] [Google Scholar]
- 19.Ronzaud C, Loffing J, Bleich M, Gretz N, Grone HJ, Schutz G, Berger S. Impairment of sodium balance in mice deficient in renal principal cell mineralocorticoid receptor. J Am Soc Nephrol 18: 1679–1687, 2007 [DOI] [PubMed] [Google Scholar]
- 20.Stow LR, Richards J, Cheng KY, Lynch IJ, Jeffers LA, Greenlee MM, Cain BD, Wingo CS, Gumz ML. The circadian protein period 1 contributes to blood pressure control and coordinately regulates renal sodium transport genes. Hypertension 59: 1151–1156, 2012 [DOI] [PMC free article] [PubMed] [Google Scholar]
- 21.Tsytsykova AV, Goldfeld AE. Inducer-specific enhanceosome formation controls tumor necrosis factor alpha gene expression in T lymphocytes. Mol Cell Biol 22: 2620–2631, 2002 [DOI] [PMC free article] [PubMed] [Google Scholar]
- 22.Venkov C, Plieth D, Ni T, Karmaker A, Bian A, George AL, Jr, Neilson EG. Transcriptional networks in epithelial-mesenchymal transition. PLos One 6: e25354, 2011 [DOI] [PMC free article] [PubMed] [Google Scholar]
- 23.Vivar OI, Zhao X, Saunier EF, Griffin C, Mayba OS, Tagliaferri M, Cohen I, Speed TP, Leitman DC. Estrogen receptor beta binds to and regulates three distinct classes of target genes. J Biol Chem 285: 22059–22066, 2010 [DOI] [PMC free article] [PubMed] [Google Scholar]
- 24.Wierstra I. Sp1: emerging roles–beyond constitutive activation of TATA-less housekeeping genes. Biochem Biophys Res Commun 372: 1–13, 2008 [DOI] [PubMed] [Google Scholar]
- 25.Yu Z, Li M, Zhang D, Xu W, Kone BC. Sp1 trans-activates the murine H+-K+-ATPase alpha(2)-subunit gene. Am J Physiol Renal Physiol 297: F63–F70, 2009 [DOI] [PMC free article] [PubMed] [Google Scholar]
- 26.Zhang D, Li S, Cruz P, Kone BC. Sirtuin 1 functionally and physically interacts with disruptor of telomeric silencing-1 to regulate alpha-ENaC transcription in collecting duct. J Biol Chem 284: 20917–20926, 2009 [DOI] [PMC free article] [PubMed] [Google Scholar]
- 27.Zhang W, Xia X, Jalal DI, Kuncewicz T, Xu W, Lesage GD, Kone BC. Aldosterone-sensitive repression of ENaCα transcription by a histone H3 lysine-79 methyltransferase. Am J Physiol Cell Physiol 290: C936–C946, 2006 [DOI] [PMC free article] [PubMed] [Google Scholar]
- 28.Zhang W, Xia X, Reisenauer MR, Hemenway CS, Kone BC. Dot1a-AF9 complex mediates histone H3 Lys-79 hypermethylation and repression of ENaCalpha in an aldosterone-sensitive manner. J Biol Chem 281: 18059–18068, 2006 [DOI] [PMC free article] [PubMed] [Google Scholar]
- 29.Zhang W, Xia X, Reisenauer MR, Rieg T, Lang F, Kuhl D, Vallon V, Kone BC. Aldosterone-induced Sgk1 relieves Dot1a-Af9-mediated transcriptional repression of epithelial Na+ channel alpha. J Clin Invest 117: 773–783, 2007 [DOI] [PMC free article] [PubMed] [Google Scholar]
- 30.Zhang W, Yu Z, Wu H, Chen L, Kong Q, Kone BC. An Af9 cis-element directly targets Dot1a to mediate transcriptional repression of the αENaC gene. Am J Physiol Renal Physiol 304: F367–F375, 2013 [DOI] [PMC free article] [PubMed] [Google Scholar]