

Abstract
Salt reabsorption is the major energy-requiring process in the kidney, and AMP-activated protein kinase (AMPK) is an important regulator of cellular metabolism. Mice with targeted deletion of the β1-subunit of AMPK (AMPK-β1−/− mice) had significantly increased urinary Na+ excretion on a normal salt diet. This was associated with reduced expression of the β-subunit of the epithelial Na+ channel (ENaC) and increased subapical tubular expression of kidney-specific Na+-K+-2Cl− cotransporter 2 (NKCC2) in the medullary thick ascending limb of Henle. AMPK-β1−/− mice fed a salt-deficient diet were able to conserve Na+, but renin secretion increased 180% compared with control mice. Cyclooxygenase-2 mRNA also increased in the kidney cortex, indicating greater signaling through the macula densa tubular salt-sensing pathway. To determine whether the increase in renin secretion was due to a change in regulation of fatty acid metabolism by AMPK, mice with a mutation of the inhibitory AMPK phosphosite in acetyl-CoA carboxylase 1 [ACC1-knockin (KI)S79A mice] were examined. ACC1-KIS79A mice on a normal salt diet had no increase in salt loss or renin secretion, and expression of NKCC2, Na+-Cl− cotransporter, and ENaC-β were similar to those in control mice. When mice were placed on a salt-deficient diet, however, renin secretion and cortical expression of cyclooxygenase-2 mRNA increased significantly in ACC1-KIS79A mice compared with control mice. In summary, our data suggest that renin synthesis and secretion are regulated by AMPK and coupled to metabolism by phosphorylation of ACC1.
Keywords: acetyl-CoA carboxylase 1, AMP-activated protein kinase, renin
amp-activated protein kinase (AMPK) is a heterotrimeric (α-, β-, and γ-subunits) kinase that is responsive to changes in intracellular ATP, ADP, and AMP levels. AMPK functions as a “cellular fuel gauge” or energy sensor, and its level of activation reflects the adenine charge in the cell (30, 45, 56). Generally, AMPK has been studied in the context of cellular energy metabolism, appetite, and energy disorders such as diabetes and obesity (19, 24, 30). Activation of AMPK requires phosphorylation of Thr172 on the α-subunit by one of at least two upstream kinases, liver kinase B1 (62) and Ca2+/calmodulin-dependent kinase kinase-β (26, 27, 61). When activated, AMPK phosphorylates a number of downstream targets whose overall effect is to inhibit energy-consuming pathways and increase energy production (56, 59). The regulation of metabolism is critical to the maintenance of organ function. In skeletal muscle, for example, exercise leads to the activation of AMPK, which can then phosphorylate substrates to increase the energy supply (56). Among the best-described effects of AMPK is the activation of fatty acid oxidation through the phosphorylation of acetyl-CoA carboxylase (ACC). ACC converts acetyl-CoA in the cellular cytoplasm to malonyl-CoA, an inhibitor of carnitine palmitoyltransferase-1 (for reviews, see Refs. 51 and 56). Carnitine palmitoyltransferase-1 controls the entry of fatty acids into the mitochondria, so that high levels of malonyl-CoA reduce fatty acid oxidation within the mitochondria. Phosphorylation of ACC by AMPK inhibits enzyme activity, resulting in less malonyl-CoA, more entry of fatty acyl-CoA into the mitochondria, and more fatty acid oxidation. ACC has two isozymes, ACC1 and ACC2, with >80% homology (7, 60). In skeletal and cardiac muscle, fatty acid oxidation is regulated by ACC2, which possesses an NH2-terminal extension containing a mitochondrial localization domain. The liver expresses both isoforms of ACC (28), whereas the kidney expresses mainly ACC1 (42).
The metabolism of the kidney has been studied extensively over the years. In the better-oxygenated cortex, fatty acid oxidation is an important energy source, whereas glycolysis and anaerobic metabolism are more important in the medulla (12, 34). Salt reabsorption is an energy-requiring process, consuming upwards of 70% of the energy requirements of the kidney (5, 31). Whittam (60) first demonstrated evidence for a functional coupling between cation transport and cellular respiration in cells. The biochemical basis was later considered to be an accumulation of ADP and Pi due to ATP hydrolysis by basolateral Na+-K+-ATPase, which then acted as a stimulus to mitochondrial oxidative metabolism (for a review, see Ref. 5).
There is substantial heterogeneity along the renal tubule in the rate of salt reabsorption. The greatest expression of Na+-K+-ATPase and the highest concentrations of mitochondria occur in the thick ascending limb of the loop of Henle (TAL), the distal convoluted tubule, and the proximal convoluted tubule (54). Although the proximal tubule reabsorbs most of the solute load, rates of solute transport are highest in the medullary TAL (MTAL), where Na+-K+-2Cl− cotransporter 2 (NKCC2) is the major salt cotransporter (54). NKCC2 also has another role in the kidney cortex, where it acts as the luminal sensor for tubular salt concentrations at the macula densa, providing one of the major controls of renin secretion and glomerular blood flow, signaling through a number of molecules, including PGE2, adenosine, nitric oxide, and ATP (53).
We (43) have previously reported that AMPK coprecipitates with NKCC2 in the rat kidney and phosphorylates it in vitro. AMPK also regulates distal epithelial Na+ channel (ENaC) through phosphorylation of Nedd4-2 (4, 9) and a phosphoinositide-dependent mechanism (38). We anticipated, therefore, that AMPK might be involved in salt homeostasis in the kidney, coupling energy availability and the major “work” of the kidney, salt reabsorption. In this study, we used mice with either targeted deletion of the β1-subunit of AMPK (AMPK-β1−/− mice) or a point mutation of the AMPK phosphosite in ACC1 [ACC1-knockin (KI)S79A] to study the role of AMPK and fatty acid metabolism in salt reabsorption and renin secretion by the kidney.
MATERIALS AND METHODS
Antibodies.
Antibodies directed against AMPK-α1, AMPK-α2, AMPK phospho-Thr172, and ACC1 phospho-Ser79 have previously been described (20, 42, 55). Rabbit antibodies against NKCC2, Na+-Cl− cotransporter (NCC), and the β-subunit of ENaC (ENaC-β) were obtained from StressMarq Biosciences. Rabbit monoclonal antibody against ACC was purchased from Cell Signaling Technology. Goat anti-NCC antibody was purchased from Santa Cruz Biotechnology. Goat antibody directed against the mouse renin-1 antibody was purchased from R&D Systems. Rabbit polyclonal antibodies against NKCC1 phospho-Thr212/217 and NCC phospho-Thr58 were produced using published amino acid sequences for immunization and affinity purification (15, 50). Western blot analysis was used to validate the anti-NKCC1 antibody using lysates from human embryonic kidney-293 cells transfected with expression plasmids containing Thr212 and Thr217 mutants. Antibodies against these phosphosites in NKCC1 also react with NKCC2 (22). The specificity of the anti-NKCC and anti-NCC phosphospecific antibody was further validated by Western blot analysis using NKCC2 and NCC immunoprecipitated from whole mouse kidney lysates and treated with λ-phosphatase (New England Biolabs).
Animals.
Mice were maintained under specific pathogen-free conditions, and all procedures were carried out in accordance with regulations set by the Austin Health Animal Ethics Committee.
The generation and characterization of AMPK-β1−/− have been previously reported (13). Mice with a serine to alanine KI mutation of the Ser79 AMPK phosphosite in ACC1 (ACC1-KIS79A mice) were generated as previously described. Both mouse strains were generated and maintained on a C57BL/6 background. All mice were genotyped at the age of 3 wk by PCR using DNA from tail biopsies. Wild-type (WT) and genetically modified mice were age matched in all experiments, and control mice were littermates in all instances.
Systolic blood pressure measurements were performed twice daily by tail-cuff plethysmography. Mice were trained for an initial period of 7 consecutive days, and measurements were subsequently collected twice daily during the dietary intervention and for an additional 7 days postdiet.
Activation of renin synthesis and secretion.
Acute stimulation of renin due to hypotension, sympathetic nervous system activation, and reduced Na+ delivery to the distal tubule were modelled pharmacologically by intraperitoneal injections of hydralazine (1 mg/kg), isoprenaline (2 μg), and furosemide (40 mg/kg), respectively, as previously described (33). Control mice received an equivalent volume of PBS. Thirty minutes after injection, mice were anesthetized with ketamine and xylazine for eye bleeding before euthanization by cervical dislocation.
For chronic stimulation of the renin pathway, mice received a salt-deficient diet for 7 days before euthanization. Diets were obtained from ICN Pharmaceuticals and consisted of standard chow containing 0.3% (wt/wt) NaCl as a normal salt diet and as a Na+-deficient diet (0% NaCl, diet 960363, ICN Pharmaceuticals). Mice had free access to water.
Biochemical analysis of plasma and urine.
Blood was collected from the orbital sinus, and plasma was recovered by centrifugation. Urine was collected with timed urine collection in metabolic cages. Samples were collected from mice either on a normal salt diet or after 7 days on the Na+-deficient diet. Serum and urine samples were analyzed by IDEXX Laboratories (Melbourne, Victoria, Australia), an International Organization for Standardization- and National Association for Testing Authorities-accredited laboratory providing a specialist veterinary laboratory service, using a multichannel autoanalyzer. Plasma renin concentrations (PRCs) were measured by an enzyme kinetic assay using sheep serum as the angiotensinogen source and subsequent measurements of ANG I by radioimmunoassay (41, 57). The plasma aldosterone concentration was measured using a commercial radioimmunoassay (Siemens Healthcare Diagnostics TKAL2 Coat-a-Count, Tarrytown, NY). The assays for renin and aldosterone were performed by ProSearch (Malvern, Victoria, Australia).
Western blot analysis.
Kidneys were excised rapidly and snap frozen in liquid nitrogen as previously described (42). Lysates were prepared using a glass on glass Dounce homogenizer in lysis buffer [containing 50 mM Tris·HCl (pH 7.5), 1 mM EGTA, 1 mM EDTA, 50 mM sodium fluoride, 5 mM sodium pyrophosphate, 1 mM sodium orthovanadate, 1% (wt/vol) Nonidet P-40, 0.27 M sucrose, and 0.1% (vol/vol) 2-mercaptoethanol]. Homogenates were centrifuged at 16,000 g for 20 min at 4°C, and the protein concentration in the supernatants was measured using the Bradford method (Bio-Rad protein assay kit). Homogenates were stored at −80°C until required.
Samples were separated by SDS-PAGE and electrically transferred to a polyvinylidenedifluoride membrane (Immobilon-P, Millipore, Bedford, MA) at 30 V overnight. The membrane was blocked in 10% BSA in Tris-buffered saline (TBS) for 1 h and then incubated in primary antibody. The optimal antibody concentration and duration of incubation were determined for each antibody. After a wash in TBS-0.05% Tween 20, the membrane was incubated for 30 min in FITC-conjugated secondary antibody (Dako, Glostrup, Denmark). Antibody complexes were detected with anti-FITC POD (Roche Diagnostics, Basil, Switzerland), and immunoreactive proteins were detected by enhanced chemiluminescence with the Western Lightning system (Perkin-Elmer). If the membrane was to be probed with another primary antibody, antibody bound to the membrane was stripped by an incubation in Reblot stripping solution (Chemicon) for 15 min. Quantification of Western blots was performed by densitometry with analysis using ImageJ software [National Institutes of Health (NIH), Bethesda, MD].
Immunofluorescence microscopy of mouse kidneys.
For NKCC2, NKCC2 phospho-Thr100/105, NCC, Tamm-Horsfall protein (THP), and renin, tissue was perfusion fixed with 4% paraformaldehyde (BDH), processed, and embedded in paraffin. Four-micrometer sections were blocked with 10% BSA in TBS before incubation with the primary antibody. Alexa Fluor 488- or 594-conjugated secondary antibodies (Invitrogen, Life Technologies) were applied, and sections were visualised on a Zeiss 510 Meta Scanning Confocal Microscope (Zeiss, Jena, Germany). Laser scanning confocal images of renin were gathered and superimposed on the transmissive light image generated to demonstrate renal structure. Renin staining was quantified by analysis of fluorescence intensity and area using ImageJ software (NIH). Ten fields of view per mouse were analyzed, and the average fluorescence per mouse was calculated. Statistics were then performed on n = 5 mice/group. For images of ENaC-β, freshly harvested kidneys were cut into 5-mm slices, fixed using 4% paraformaldehyde, and processed as previously described (23, 37). Tissues were embedded in Tissue Tek OCT (Sakura, Torrance, CA). Four-micrometer cryosections were collected on poly-l-lysine-coated slides and rehydrated in PBS followed by 1% SDS in the PBS antigen retrieval step (6). After being washed, sections were blocked in BSA and then incubated with a 1:100 dilution of ENaC-β antibody (Stressmarq) followed by two 5-min washes in high-salt PBS (2.7% NaCl) and one normal-strength PBS wash. Slides were then incubated with a secondary goat anti-rabbit antibody coupled to FITC (1:100, Jackson ImmunoResearch Labs, West Grove, PA) for 1 h at room temperature. After being washed, slides were mounted with Vectashield (Vector Laboratories, Burlingame, CA) and imaged using a Leica TSC confocal microscope (Leica Microsystems, Heidelberg, Germany).
Real time quantitative RT-PCR.
Total RNA was purified from whole mouse kidney samples using TRIzol reagent (Invitrogen) in accordance with the manufacturer's instructions. RNA quality and quantity were determined using spectrophotometry and reverse transcribed using the high-capacity cDNA reverse transcription kit (Applied Biosystems, Foster City, CA). Real-time PCR used the following primers: preprorenin, 5′-ATGAAGGGGGTGTCTGTGGGG-3′ and 5′-ATGCGGGGAGGGTGGGCACCT-3′; cyclooxygenase (Cox)-2, 5′-CCGTGGGGAATGTATGAGCA-3′ and 5′-CCAGGTCCTCGCTTATGATCTG-3′; ACC1, 5′-GAAGCCACAGTGAAATCTCG-3′ and 5′-GATGGTTTGGCCTTTCACAT-3′; ACC2, 5′-TGTTCTCGGCCTCTCTTCAC-3′ and 5′-GAGGCTGCATTGAACACAAG-3′; β-actin (housekeeping gene), 5′-CGGGATCCCCGCCCTAGGCACCAGGGTG-3′ and 5′-GGAATTAGGCTGGGGTGTTGAAGGTCTCAAA-3′; and 18S (housekeeping gene), 5′-AGTCCCTGCCCTTTGTACACA-3′ and 5′-GATCCGAGGGCCTCACTAAAC-3′. Real-time PCR was performed on a Stratagene MX-3000 with the Solis BiodyneEvagreen master mix (Tartu, Estonia) according to the manufacturer's instructions. Primer efficiency was measured using standard dilution, and the Pfaffl method (48) was used to calculate relative expression. Results are expressed as fold expression relative to WT mice that received a normal salt diet.
Statistics.
Statistics were performed using Instat version 3.05 (GraphPadSoftware, San Diego, CA). Data are presented as means ± SD. Multiple group means were compared by ANOVA followed by a post hoc test. Comparison of means from two groups was performed by an unpaired t-test. P values of <0.05 were considered significant.
RESULTS
Reduced renal AMPK activity and increased urinary Na+ in AMPK-β1−/− mice.
We (42) have recently reported that kidneys from AMPK-β1−/− mice have no detectable expression of the AMPK β1-subunit and low-level expression of the AMPK β2-subunit, which was similar to WT mice. In AMPK-β1−/− mice on a normal diet, activated AMPK was clearly reduced in AMPK-β1−/− mice as determined by Western blot analysis for phospho-Thr172 and by 60% using the SAMS kinase assay for immunoprecipitates of the α1-subunit. No change in AMPK activity was measured for immunoprecipitates of the AMPK α2-subunit (Fig. 1, A and B). Under normal conditions, both the α1- and α2-catalytic subunits were expressed in the mouse kidney, with measurable basal AMPK-α1 and AMPK-α2 activity (Fig. 1, A and B). Kidneys from AMPK-β1−/− mice appeared normal macroscopically but were slightly smaller than those from WT mice (P = 0.01; Table 1). Microscopically, there was patchy vacuolation seen in proximal convoluted tubules from AMPK-β1−/− mice.
Fig. 1.
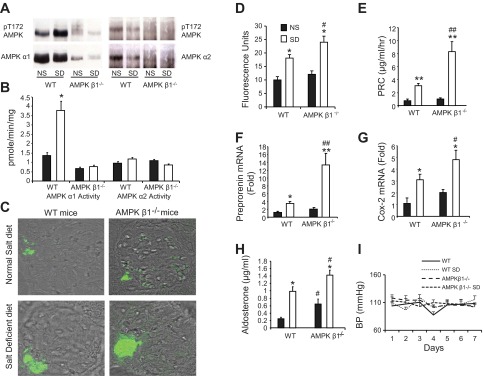
Renin response in AMP-activated protein kinase (AMPK) β1-subunit knockout (AMPK-β1−/−) mice that received a salt-deficient diet (SD). Knockout mice and wild-type (WT) control littermates were fed a normal diet (ND) or SD for 7 days. A: representive Western blots for phosphorylated (p)Thr172 (pT172) from kidney cortical lysates immunoprecipitated for either AMPK α1- or α2-catalytic subunits. B: AMPK activity assay performed on kidney cortical lysates. C: representative confocal microscopy images of immunofluorescence labeling of renin expression in AMPK-β1−/− and WT control littermates fed the ND and SD. D: quantitation of total fluorescence of renin expression. n = 5 (10 images from each kidney). E: plasma renin concentrations (PRC). n = 11. F: preprorenin mRNA measured using real-time PCR and expressed as fold changes relative to WT mice fed the ND. n = 11. G: cyclooxygenase (Cox)-2 mRNA measured using real-time PCR and expressed as fold changes relative to WT mice fed the ND. n = 11. H: plasma aldosterone concentration in mice fed the ND and SD. n = 11. I: systolic blood pressure (BP) measured by the tail-cuff technique. n = 7–15. *P < 0.05 and **P < 0.001 for mice on the SD compared with the ND; #P < 0.05 and ##P < 0.001 for AMPK-β1−/− mice compared with WT mice on the same diet.
Table 1.
Physical data and serum and urine measurements in WT and AMPK-β1−/− mice
| WT Mice | AMPK β1−/− Mice | Number of Animals | P Value | |
|---|---|---|---|---|
| Body weight, g | 26.6 ± 3.8 | 24.0 ± 2.8 | 20 | 0.084 |
| Food consumption, mg·g body wt−1·day−1 | 164.6 ± 43.6 | 178.5 ± 27.9 | 10 | 0.330 |
| Urine output. ml/day | 1.82 ± 0.72 | 2.16 ± 0.61 | 20 | 0.421 |
| Creatinine clearance, ml·min−1·m−2 | 19.6 ± 2.3 | 25.2 ± 4.1 | 4 | 0.136 |
| Kidney weight, mg/g body wt | 9.0 ± 1.0 | 8.1 ± 0.8 | 13 (WT) and 19 (AMPK-β1−/−) | 0.010 |
| Serum measurements | ||||
| Na+, mmol/l | 174.0 ± 16.4 | 166.4 ± 14.3 | 11 | 0.930 |
| K+, mmol/l | 7.1 ± 1.6 | 6.1 ± 1.7 | 11 | 0.892 |
| Cl−, mmol/l | 109.1 ± 3.6 | 108.5 ± 4.6 | 11 | 0.861 |
| PO43−, mmol/l | 3.2 ± 0.57 | 3.2 ± 0.57 | 11 | 0.892 |
| Creatinine, mmol/l | 0.029 ± 0.00 | 0.029 ± 0.00 | 11 | 0.872 |
| Urine measurements | ||||
| Creatinine mmol/l | 2.60 ± 1.17 | 2.34 ± 1.03 | 17 | 0.559 |
| Ratio of mmol/mmol Creatinine | ||||
| Na+ | 39.7 ± 15.7 | 55.1 ± 29.7 | 17 | 0.039 |
| K+ | 38.6 ± 17.7 | 43.8 ± 22.0 | 17 | 0.420 |
| Cl− | 47.1 ± 16.5 | 57.1 ± 20.4 | 17 | 0.285 |
| Ca2+ | 0.50 ± 0.27 | 0.48 ± 0.28 | 17 | 0.757 |
| Mg2+ | 5.22 ± 1.04 | 4.24 ± 1.44 | 9 | 0.136 |
| PO43− | 15.1 ± 9.73 | 19.1 ± 11.1 | 17 | 0.257 |
| Urea | 235.4 ± 40.7 | 230.7 ± 61.1 | 17 | 0.855 |
Values are means ± SD. WT, wild type; AMPK-β1−/−, AMP-activated protein kinase-β1 knockout.
When mice received a normal salt diet, AMPK-β1−/− mice had significantly increased urinary Na+ excretion compared with WT mice, as determined by the urine Na+-to-creatinine ratio (P = 0.039; Table 1). There were no differences in other parameters such as serum electrolytes, urine volume, or body weight. Although AMPK-β1−/− mice have been reported to consume less food than WT mice (13), in the present study using mice maintained in a different animal house, food intake was comparable (Table 1).
Response of AMPK-β1−/− mice to a salt-deficient diet.
To determine the ability of the kidneys of AMPK-β1−/− mice to conserve Na+ and regulate renin, mice were placed on a salt-deficient diet for 7 days. After 2 days on the diet, both groups of mice showed a dramatic reduction in Na+ excretion (Table 2). At the end of the 7-day dietary period, there was too little urine produced to assay Na+ excretion in either group. Serum measurements, however, were similar in both groups (Table 2). After 7 days on the diet, AMPK activity in WT mice, as detected by the SAMS kinase assay from immunoprecipitates with an antibody against the AMPK α1-subunit, was increased by 230%. No change was observed in AMPK α2-subunit activity (Fig. 1B). This was also reflected in the Western blot analysis for AMPK phospho-Thr172 (Fig. 1A).
Table 2.
Serum and urine measurements in WT and AMPK-β1−/− mice fed a Na+-deficient diet
| WT Mice | AMPK β1−/− Mice | Number of Animals | P Value | |
|---|---|---|---|---|
| Serum measurements after 7 days | ||||
| Na+, mmol/l | 168.9 ± 18.0 | 171.4 ± 14.4 | 11 | 0.256 |
| K+, mmol/l | 6.7 ± 1.7 | 7.4 ± 2.7 | 11 | 0.198 |
| Cl−, mmol/l | 106.5 ± 7.5 | 104.5 ± 5.3 | 11 | 0.158 |
| PO43−, mmol/l | 3.13 ± 0.74 | 2.8 ± 1.2 | 11 | 0.086 |
| Creatinine, mmol/l | 0.028 ± 0.00 | 0.029 ± 0.00 | 11 | 0.495 |
| Urine measurements after 2 days | ||||
| Creatinine, mmol/l | 2.81 ± 0.86 | 2.45 ± 1.35 | 10 | 0.472 |
| Ratio of mmol/mmol creatinine | ||||
| Na+ | 4.49 ± 1.04 | 5.58 ± 2.92 | 10 | 0.341 |
| K+ | 25.6 ± 7.3 | 34.6 ± 12.7 | 10 | 0.062 |
| Cl− | 6.73 ± 1.98 | 10.4 ± 1.7 | 10 | 0.478 |
| Ca2+ | 0.42 ± 0.27 | 0.37 ± 0.13 | 10 | 0.596 |
| Mg2+ | 2.45 ± 0.40 | 1.83 ± 0.98 | 7 | 0.189 |
| PO43− | 24.1 ± 13.7 | 31.1 ± 10.3 | 10 | 0.203 |
| Urea | 265.5 ± 63.3 | 275.2 ± 26.8 | 10 | 0.758 |
Values are means ± SD.
Renin synthesis and secretion in AMPK-β1−/− mice.
PRC and cortical intrarenal preprorenin mRNA were comparable in AMPK-β1−/− and WT mice on a normal salt diet (Fig. 1, E and F). There were no detectable changes in basal renin expression by quantification of indirect immunofluorescence labeling (Fig. 1, C and D). Plasma aldosterone concentrations were significantly higher in AMPK-β1−/− mice (P < 0.05; Fig. 1H). There were no significant differences in Cox-2 mRNA in the kidney cortex (Fig. 1G) or in systolic blood pressure (Fig. 1I) between WT and AMPK-β1−/− mice on a normal salt diet.
In mice on salt-deficient diets, there was a 180% increase in PRC (Fig. 1E) and a 280% increase in preprorenin mRNA within the kidney cortex of AMPK-β1−/− mice compared with WT control mice (P < 0.001 for AMPK-β1−/− vs. WT mice on a salt-deficient diet; Fig. 1F). This increased renin response was associated with increased indirect immunofluorescence labeling for renin protein at the juxtaglomerular apparatus (P < 0.05 for the difference between renin immunofluorescence between AMPK-β1−/− and WT mice on a salt-deficient diet; Fig. 1, C and D). Qualitatively, the increased renin immunofluorescence at the juxtaglomerular apparatus was contributed to by both an increased intensity of staining and an increased staining area, consistent with juxtaglomerular cell recruitment (Fig. 1C). Plasma aldosterone levels were increased in all mice that received the salt-deficient diet compared with control groups that received normal salt diets (Fig. 1H). In addition, aldosterone levels were significantly greater in AMPK-β1−/− mice that received either diet than in their respective WT control mice (P < 0.05). Cox-2 mRNA expression was increased in the cortex of both WT and AMPK-β1−/− mice on a salt-deficient diet compared with mice from the same strain that received a normal salt diet (Fig. 1G), consistent with activation of the renin secretion pathway due to low tubular salt concentrations at the level of the macula densa. Cox-2 mRNA was 55% higher in AMPK-β1−/− mice that received a salt-deficient diet than in WT mice on the same diet (P < 0.05), but there were no differences between the two strains when mice received a normal salt diet. Despite the differences in renin and aldosterone secretion, no significant differences in systolic blood pressure were observed in mice (Fig. 1I).
Acute experiments were then performed to determine whether there was a specific pathway for the stimulation of renin release that could be identified in AMPK-β1−/− mice. Administration of furosemide and hydralazine to AMPK-β1−/− mice was associated with a significant increase in PRC compared with treated WT mice (P = 0.005 and 0.048, respectively). There were no significant differences for mice that received isoprenaline, although the response was very variable (Fig. 2).
Fig. 2.

PRC in AMPK-β1−/− mice in response to furosemide, hydralazine, and isoprenaline. AMPK-β1−/− mice (open bars) and WT control mice (solid bars) were intraperitoneally injected with furosemide, hydralazine, isoprenaline, or vehicle, and PRC was measured after 30 min. n = 8–11 mice/group. *P < 0.05 compared with WT control mice under the same treatment conditions.
Expression of distal salt transporters in AMPK-β1−/− mice and WT control mice.
In a study (36) of humans with single gene mutations, genes expressed in the distal segments of the nephron, such as NKCC2, NCC, and ENaC, were most strongly associated with salt loss. We therefore restricted our study to distal Na+ transporters and channels to determine whether expression of NKCC2, NCC, or ENaC-β was altered in AMPK-β1−/− mice.
When we examined NKCC2, there were no differences in the expression of the 160-kDa monomeric form in WT mice that received a salt-deficient diet compared with WT mice that received a normal salt diet or between WT and AMPK-β1−/− mice (Fig. 3, A and D). Immunofluorescence microscopy with NKCC2-specific rabbit polyclonal antibody raised against the NH2-terminus (SPC 401D, Stressmarq Biosciences) demonstrated, however, increased subapical expression of NKCC2 in the MTAL of AMPK-β1−/− mice but not WT mice on a normal salt diet (Fig. 3B).The subapical distribution was restricted to the medulla, with normal apical staining present in the cortex and at the macula densa as identified by THP-negative, NKCC2-positive staining (Fig. 4A). Additionally, this appearance was not seen in mice that received a salt-deficient diet. Interestingly, despite the apparent reduction in the apical expression of NKCC2 in the MTAL, phosphorylation of NKCC2 on Thr100/105 was increased in all mice that received a salt-deficient diet (Fig. 3, A and C). Immunofluorscent staining for NKCC2 phospho-Thr100/105 at the macula densa showed no differences between WT and AMPK-β1−/− mice (Fig. 4B). Phosphorylation at these sites is associated with increased cotransporter activity (21, 49).
Fig. 3.
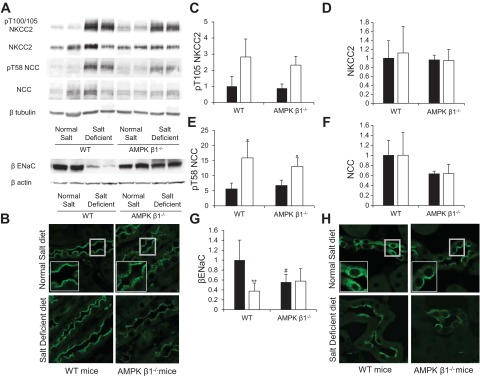
Expression, localization, and phosphorylation of distal Na+ transporters in AMPK-β1−/− mice. AMPK β1−/− mice and littermate control mice were fed the ND or SD for 7 days. A: Western blot analysis of kidney protein lysates. B: immunofluorescence microscopy of kidney sections showing increased subapical expression of Na+-K+-2Cl− cotransporter 2 (NKCC2; SPC-401D antibody) in AMPK-β1−/− mice on the ND compared with WT control mice. C–G: densitometry of Western blots from mice on the ND (solid bars) and SD (open bars). n = 5–10. C: pThr105 (pT105) of NKCC2. D: NKCC2. E: pThr58 (pT58) of the Na+-Cl−1 cotransporter (NCC). F: NCC. G: β-subunit of the epithelial Na+ channel (ENaC). *P < 0.05 and **P < 0.001 for mice on the SD compared with mice from the same strain on the SD; #P < 0.05 for AMPK-β1−/− mice relative to WT mice on the same diet. H: immunofluorescence microscopy of kidney sections showing increased subapical expression of β-ENaC in AMPK-β1−/− mice on the ND compared with WT control mice.
Fig. 4.
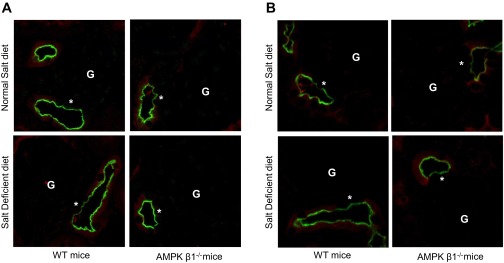
NKCC2 expression and phosphorylation at the macula densa. Sections from AMPK-β1−/− mice or WT control mice fed the ND or SD for 7 days were costained for NKCC2 (A) or NKCC2 pThr100/105 (B) (green) and for Tamm-Horsfall protein (THP; red). Macula densa cells (*) were identified as NKCC2-positive, THP-negative cells juxtaposed to a glomerulus (G).
Expression of NCC in AMPK-β1−/− mice by Western blot analysis on normal and salt-deficient diets was not significantly different from WT mice (P = 0.056 for the difference between the means of the four groups by ANOVA; Fig. 3, A and F). Phosphorylation of NCC was significantly increased in response to the salt-deficient diet in both WT and AMPK-β1−/− mice (Fig. 3, A and E). Phosphorylation of NCC at Thr58 is associated with increased cotransporter activity (50). Confocal immunofluorescence microscopy showed no differences in the apical expression of NCC between WT and AMPK-β1−/− mice (data not shown).
In terms of ENaC-β expression, there was a significant decrease in AMPK-β1−/− mice that received a normal-salt diet compared with WT mice (Fig. 3, A and G). WT mice on the salt-deficient diet had reduced ENaC-β (Fig. 3, A and G), as previously reported in rats that received a low-salt diet in one study (39) but not in another (17). This decrease was not observed in AMPK-β1−/− mice on the salt-deficient diet. Confocal immunofluorescence microscopy revealed that ENaC-β had a more apical distribution in kidney principal cells of AMPK-β1−/− mice than in control WT mice (Fig. 3H). Salt-deprived WT mice demonstrated very strong apical staining for ENaC-β, and some, but not all, of the tubules from salt-deprived AMPK-β1−/− mice had increased apical staining for ENaC-β (Fig. 3H).
Identification of ACC1 as a substrate for AMPK in the kidney that is regulated by salt intake.
Although NKCC2 is required for the detection of luminal salt concentrations by the macula densa (46, 53), the increase in subapical NKCC2 seen in the MTAL was not observed at the macula densa, and NKCC2 expression was normal in AMPK-β1−/− mice fed a salt-deficient diet, which had increased renin. Furthermore, NKCC2 phosphorylation at the macula densa was not different between AMPK-β1−/− and WT mice (Fig. 4). It seemed likely, therefore, that another AMPK substrate besides NKCC2 was responsible for the increased renin seen in AMPK-β1−/− mice fed a salt-deficient diet.
In the course of these experiments, we noted that the AMPK inhibitory Ser79 site on ACC1 was phosphorylated in the kidney, and this was increased in mice that received a salt-deficient diet (Fig. 5A). The mouse kidney expresses minimal ACC2 (Fig. 5, B and C) relative to other organs, such as the heart, where it is a major regulator of fatty acid oxidation. Since fatty acid oxidation is an important energy source in the kidney (5), it seems reasonable that phosphorylation of ACC1 on Ser79 by AMPK both reduces fatty acid synthesis and increases fatty acid oxidation. We (44) have previously reported that fatty acid oxidation increases with ACC1 phosphorylation in bovine aortic endothelial cells. Phosphorylation of ACC1 Ser79 was reduced but not eliminated in AMPK-β1−/− mice, possibly due to residual AMPK-β2 (Fig. 5A). These mice would be predicted to have reduced generation of ATP from fatty acid metabolism.
Fig. 5.

Acetyl-CoA carboxylase 1 (ACC1) phosphorylation in mice that received the SD. A: Western blots of kidney lysates from AMPK-β1−/− mice or littermate control mice on the ND or SD for 7 days and the corresponding densitometric analysis (n = 6). Lysates were standardized by equal protein loading as measured by the Bradford protein assay. *P < 0.05 for mice on the SD compared with ND; #P < 0.05 for AMPK-β1−/− mice compared with WT mice on the equivalent diet. B: comparative expression levels of ACC1 and ACC2 by Western blot analysis of heart kidney and liver lysates from control mice. C: real-time PCR analysis of ACC1 and ACC2 expression from heart, kidney, and liver samples from control mice.
The renin pathway in ACC1-KIS79A mice.
To determine whether phosphorylation of ACC1 by AMPK was important in the generation of salt loss or hyperreninemia, we studied mice with a germline mutation of the Ser79 site in ACC1 (ACC1-KIS79A mice). AMPK activity in these mice was similar to WT littermates, and no histological abnormalities were identified in the kidneys (data not shown).
There was no increase in urinary salt loss in ACC1-KIS79A mice compared with their littermate controls (Table 3). However, when ACC1-KIS79A mice were exposed to a salt-deficient diet, there was a significant increase in both PRC (80% increase, P < 0.05)and preprorenin mRNA (70% increase, P < 0.05). In addition, there was a 48% increase in Cox-2 mRNA (P < 0.05) and an accompanying 30% increase in aldosterone (P < 0.05) in ACC1-KIS79A mice fed a salt-deficient diet compared with WT mice (Fig. 6, A–D). The increases were less than those previously observed in AMPK-β1−/− mice (Fig. 1, E–H). No differences in PRC, preprorenin mRNA, Cox-2 mRNA expression, or aldosterone were observed between ACC1-KIS79A and WT mice when both were fed normal salt diets (Fig. 6, A–D). Modification of ACC1 through mutation of Ser79 to alanine did not result in changes in ACC1 or ACC2 mRNA expression (data not shown).
Table 3.
Urine measurements in WT and ACC1-KIS79A mice fed a normal or Na+-deficient diet for 2 days
| WT Mice | ACC1-KIS79A Mice | Number of Animals | P Value | |
|---|---|---|---|---|
| Normal Na+ diet urine measurements, ratio of electrolytes/creatinine | ||||
| Na+ | 44.5 ± 15.1 | 45.9 ± 10.4 | 11 | 0.834 |
| K+ | 29.9 ± 8.0 | 39.6 ± 11.9 | 11 | 0.118 |
| Cl− | 28.5 ± 12.6 | 40.3 ± 14.9 | 11 | 0.182 |
| Ca2+ | 0.68 ± 0.37 | 0.81 ± 0.41 | 11 | 0.404 |
| Mg2+ | 4.80 ± 0.85 | 4.93 ± 0.86 | 11 | 0.357 |
| PO43− | 5.84 ± 3.22 | 8.48 ± 2.78 | 11 | 0.309 |
| Urea | 188.2 ± 46.0 | 229.7 ± 67.2 | 11 | 0.194 |
| Low-Na+ diet urine measurements, ratio of mmol/mmol creatinine | ||||
| Na+ | 3.06 ± 1.05 | 3.58 ± 1.46 | 7 | 0.281 |
| K+ | 22.4 ± 4.07 | 30.3 ± 8.79 | 7 | 0.532 |
| Cl− | 3.60 ± 1.17 | 4.90 ± 1.79 | 7 | 0.583 |
| Ca2+ | 0.27 ± 0.08 | 0.29 ± 0.10 | 7 | 0.976 |
| Mg2+ | 1.52 ± 0.88 | 2.74 ± 1.06 | 7 | 0.770 |
| PO43− | 14.8 ± 2.35 | 19.8 ± 3.79 | 7 | 0.566 |
| Urea | 204.3 ± 22.1 | 210.0 ± 28.7 | 7 | 0.724 |
Values are means ± SD. ACC1-KIS79A mice, mice with a point mutation of the inhibitory AMPK phosphosite in acetyl-CoA carboxylase 1.
Fig. 6.

Renin response in ACC1-knockin (KI)S79A mice that received the SD. ACC1-KIS79A and littermate control mice were fed the ND or SD for 7 days. A: PRC in ACC1-KIS79A and WT littermate control mice fed the ND and SD. B: preprorenin mRNA measured using real-time PCR and expressed as fold changes relative to WT mice fed the ND. C: Cox-2 mRNA measured using real-time PCR and expressed as fold changes relative to WT mice fed the ND. D: serum aldosterone levels (expressed in pg/ml). n = 11–15. *P < 0.05 and **P < 0.001 for mice on the SD compared with mice of the same strain on the ND; #P < 0.05 for ACC1-KIS79A mice compared with WT mice on the same diet.
Expression of distal salt transporters in ACC1-KIS79A mice and WT control mice.
Western blot analysis demonstrated a significant increase in the phosphorylation of NKCC2 (Fig. 7, A and B) in both ACC1-KIS79A mice and WT control mice that received salt-deficient diets, but there were no differences in the overall expression of NKCC2 (Fig. 7, A and C). Phosphorylation of NCC was similar (Fig. 7, A and D), but there was a significant increase in the expression of NCC in ACC1-KIS79A mice that received a salt-deficient diet (Fig. 6, A and E). There was also significantly less ENaC-β in ACC1-KIS79A mice (P < 0.05) than in WT mice that received a normal-salt diet (Fig. 7, A and F). Expression of ENaC-β was again significantly reduced in WT mice that received a salt-deficient diet compared with those on a normal salt diet (P < 0.01), and this also occurred in ACC1-KIS79A mice (P < 0.01; Fig. 6, A and F). There were no differences in the expression of ENaC-β between WT and ACC1-KIS79A mice on a salt-deficient diet. Immunofluorescence microscopy showed no differences in the pattern of expression of NKCC2, NCC, or ENaC-β between WT and ACC1-KIS79A mice (data not shown).
Fig. 7.

Expression and phosphorylation of distal Na+ transporters in ACC1-KIS79A mice. ACC1-KIS79A mice and littermate control mice were fed the ND or SD for 7 days. A: representative Western blots of whole kidney protein lysates from ACC1-KIS79A mice and littermate WT control mice that received the ND or SD. Phosphorylation of NKCC2 on Thr100/105 and NCC on Thr58 was determined using a phosphospecific antibody. B–F: densitometric analysis of Western blots of mice on the ND and SD. n = 4–7. *P < 0.05 and **P < 0.001 for mice on the SD relative to mice on the ND; #P < 0.05 for ACC1-KIS79A mice relative to WT mice on teh equivalent diet.
DISCUSSION
AMPK is a major controller of intracellular metabolism (56), so it was anticipated that AMPK-β1−/− mice would have a significant abnormality in renal salt reabsorption, as this is one of the major functions of the kidney (5, 31). Surprisingly, there was only a small increase in salt excretion in AMPK-β1−/− mice on a normal diet and no differences after 2 days of a salt-deficient diet, indicating that the mice were able to conserve salt.
In contrast to the relatively modest effect of AMPK on salt excretion, there was a more significant change in renin secretion under salt-deficient conditions. On a normal salt diet, AMPK-β1−/− mice showed no differences in PRC or serum K+ but, despite this, showed a significant increase in plasma aldosterone. The reason for this apparent discrepancy is unclear, but one possible explanation is that we did observe a nonsignificant trend in increased renin in AMPK-β1−/− mice that might explain the measurable difference in aldosterone with amplification of the signal. This is in contrast with previous work with AMPK-α1−/− mice, which exhibited no change in plasma renin but a significantly reduced aldosterone level under basal conditions and a mild K+ and Cl− wasting phenotype (2). It is surprising that the respective AMPK subunit knockouts have differing phenotypes in this respect and may be reflective of subunit specificity in different regions of the nephron. Also, in our hands, AMPK-β1−/− mice had a greater reduction in AMPK activity, as AMPK-α1−/− mice may have compensatory increase in AMPK-α2 activity.
Acute administration of hydralazine and furosemide caused an increase in PRC in AMPK-β1−/−mice compared with WT control mice that received the same stimulus. However, the increases compared with baseline values were similar in WT and AMPK-β1−/− mice that received all three drugs, so it seems unlikely that a specific pathway to acute renin secretion was affected by the absence of AMPK.
Explanations for the exaggerated renin release in AMPK-β1−/− mice include either a primary increase in macula densa signaling, as suggested by the increased Cox-2 expression, or a compensatory response to a primary problem of a salt loss. The finding that renin release was also exaggerated in ACC1-KIS79A mice in the absence of a salt-losing phenotype suggests that a primary defect in the AMPK-ACC pathway at the level of the macula densa is making a contribution to the observed hyperreninemia. Of note, the degree of increase in hyperreninemia in AMPK-β1−/− mice was greater than in ACC1-KIS79A mice, suggesting that the salt-losing tendency of AMPK-β1−/− mice is also likely to be contributing to the greater renin release. Interestingly, however, AMPK-β1−/− mice were able to conserve salt and maintain blood pressure under conditions of salt deficiency, demonstrating that under these conditions, they are able to overcome their salt-losing tendency.
Chronic administration of a salt-deficient diet, however, caused a marked increase in PRC, preprorenin mRNA in the kidney cortex, and plasma aldosterone concentrations. There was also increased expression of Cox-2 mRNA in the kidney cortex of AMPK-β1−/−mice, indicating increased activation of the macula densa-sensing mechanism for tubular salt concentration (25, 47, 52). Renin release at the juxtaglomerular apparatus can also be inhibited by adenosine or ATP; however, determining the local concentrations of these mediators in the whole kidney is technically very difficult and was not performed in this study. While an effect of AMPK deficiency on pathways inhibiting renin release is not excluded, this seems relatively unlikely as it is not consistent with any known action of AMPK. Overall, the likely explanation for the observed increase renin release is increased macula densa signaling, as evidenced by the increased cortical Cox-2 expression. Interestingly, it has been reported that AMPK modulates the Cox-2 response in inflammation and in cancer metastases (32, 63). In these settings, AMPK is a negative regulator of Cox-2 expression. It is possible, therefore, that in response to a salt-deficient diet, AMPK is required to “dampen” the Cox-2-mediated signaling in the macula densa. There are several other possible explanations for the relative increase in PRC seen in AMPK-β1−/− mice, including a change in the sensitivity of the macula densa salt-sensing mechanism. Initially, we considered that changes in the cotransporter activity of NKCC2 might contribute to the reduced sensitivity of salt sensing by the macula densa during periods of salt restriction. NKCC2 is critically involved in sensing tubular salt concentration (47, 53), and we (16) have previously reported that AMPK binds and phosphorylates the intracellular NH2-terminus of NKCC2. In a previous study (16) of NKCC2 and AMPK coexpression in Xenopus oocytes, however, AMPK had little effect on cotransporter activity. Of note, however, in the present study, we found that phosphorylation and expression of NKCC2 were unchanged in the whole kidney. Moreover, there were also no changes in the expression or phosphorylation of NKCC2 at the macula densa in AMPK-β1−/− mice that received a salt-deficient diet compared with WT mice. Overall, therefore, these data indicate the exaggerated renin response in AMPK-β1−/− mice was not attributable to defective NKCC2 activity at the macula densa.
A second potential mechanism for the reduced sensitivity of the salt-sensing mechanism at the macula densa is reduced activity of basolateral Na+-K+-ATPase. Inhibition of the activity of AMPK using compound C in Madin-Darby canine kidney cells has been reported to increase the endocytosis of Na+-K+-ATPase (3), which would be predicted to reduce secondary active transport of Na+, K+, and Cl− by NKCC2 and thus inhibit tubular salt sensing. A previous study (43) has shown that activated AMPK is expressed predominantly on the apical surface of the TAL and macula densa in the kidney, suggesting a greater effect on molecules on the apical surface of the cells, but this does not exclude a significant effect on basolateral Na+-K+-ATPase.
The moderate but significant increase in salt excretion by AMPK-β1−/− mice on a normal salt diet was associated with some alterations in expression of distal salt transporters that could explain the increased salt loss (36). Specifically, there was increased subapical expression of NKCC2 in the MTAL, and a significant reduction in the expression of ENaC-β in AMPK-β1−/− mice on a normal salt diet. The significance of the increased subapical expression of NKCC2 in the MTAL is uncertain, however, in view of the fact that no change in phospho-NKCC2 expression could be detected by Western blot analysis in AMPK-β1−/− kidneys. A possible explanation for this disparity is that the increased subapical NKCC2 expression was confined to the MTAL, whereas the Western blot data represent NKCC2 phosphorylation in all parts of the kidney.
With regard to ENaC, it was found that AMPK-β1−/− deficiency and a salt-deficient diet were associated with reduced total expression of the β-subunit of ENaC. These results need to be interpreted cautiously, as we also observed that both AMPK-β1−/− deficiency and a salt-deficient diet were associated with increased serum aldosterone, which is known to increase ENaC activity by multiple mechanisms, including the promotion of ENaC expression at the apical membrane of the principal cells (8). This implies that total ENaC-β expression is not a reliable measure of ENaC-mediated Na+ transport. We did observe, however, increased apical ENaC expression in AMPK-β1−/− mice under normal salt conditions and in AMPK-null and WT mice with salt deficiency.
Previous cellular studies have found that AMPK can inhibit ENaC through either increased interactions between Nedd4-2 and the β-subunit of ENaC (4, 9) or stimulation of phosphoinositide-dependent signaling (38). It is possible that the absence of AMPK in AMPK-β1−/− mice might have led to reduced Nedd4-2-regulated ubiquitination of ENaC and thereby contributed to the increased apical expression that was observed. The mechanism for the reduced total expression of the ENaC β-subunit in AMPK-β1−/− mice is currently unexplained but appears to be unrelated to the mechanisms of acute regulation of ENaC by AMPK identified previously. This is probably explained by an as-yet-unidentified effect of more chronic and continuous AMPK deficiency.
A primary increase in food intake in mice with a metabolic defect is another potential cause for the increased urinary Na+ excretion. In this study, however, there was no significant difference in food consumption or body weight by AMPK-β1−/− mice on a normal salt diet. We (13) previously reported that AMPK-β1−/− mice have reduced food intake and less weight gain compared with WT control mice on both chow and high-fat diets. It is not clear why there was a difference between the two studies, although the mice were housed at different locations. The data, therefore, support a reduction in renal salt reabsorption as the explanation for the increase in urinary Na+ excretion.
When placed on a salt-deficient diet, AMPK-β1−/−mice were able to reduce urinary Na+ excretion, maintaining normal serum Na+ and creatinine levels for up to 7 days after the initiation of the diet. Considering the differences in Na+ transporters observed in AMPK-β1−/− mice on a normal salt diet, the increased subapical expression of NKCC2 returned to normal in salt-deficient AMPK-β1−/−mice, and the reduction in ENaC expression compared with WT mice was also lost. Both of these abnormalities in AMPK-β1−/−mice could have contributed to the increased Na+ excretion in mice that received a normal salt diet. Why they resolved when the mice were switched to a salt-deficient diet is unknown but could be related to stress responses involving other kinases during salt restriction.
Salt restriction produced very strong phosphorylation of NKCC2 on the activating Thr100/105 phosphosites that was unaffected by the absence of AMPK. NCC expression did not change in salt-restricted mice, with a nonsignificant trend to reduced expression in the AMPK-β1−/−group. NCC was strongly phosphorylated on Thr58, indicating that the absence of AMPK does not affect NCC phosphorylation.
In ACC1-KIS79A mice, there were two notable differences compared with WT mice. As with AMPK-β1−/− mice, ENaC-β was reduced compared with WT mice when both received a normal salt diet. This did not, however, result in a salt-losing phenotype. There was no change in the pattern of expression of NKCC2, suggesting that this might be the most important abnormality leading to salt loss in AMPK-β1−/− mice. Second, NCC was increased in ACC1-KIS79A mice that received a salt-deficient diet compared with WT mice. There were no differences in the phosphorylation of NKCC2 or NCC in ACC1-KIS79A mice compared with WT mice.
One obvious question is whether these findings have any relevance to the pathogenesis of hypertension. It is striking that, despite the changes in renin and salt handling, there were no differences in systolic blood pressure between any of the groups of mice. AMPK-β1−/− mice did experience a change in the relationship between salt excretion and renin synthesis, such that renin was higher for a given level of salt excretion. Therefore, if AMPK activity in the kidney was reduced by diabetes or obesity, as has been previously reported (10, 11, 35), it would be predicted to increase renin synthesis relative to urinary Na+ excretion. This phenomenon could contribute to the observed increases in renin concentrations characteristic of diabetic nephropathy (1, 40) and obesity-related hypertension (14, 29, 58).
In summary, this study demonstrated that the loss of AMPK activity in AMPK-β1−/− mice was associated with salt loss and activation of the renin-angiotensin system when mice received a normal salt diet. In mice placed on a salt-deficient diet, a more pronounced increase was noted in renin synthesis, and this was attributable, in part, to a failure to phosphorylate the controller of fatty acid metabolism, ACC1, in ACC1-KIS79A mice. These data suggest there might exist previously unrecognized coupling between energy metabolism and renin secretion that involves AMPK. Further studies will be required to determine whether or not reduced renal AMPK activity contributes to the development of hyperreninemia in conditions of energy excess, such as obesity and type 2 diabetes.
GRANTS
This work was supported by project grants from the Australian National Health and Medical Research Council (to B. E. Kemp and D. A. Power), National Institute of Diabetes and Digestive and Kidney Diseases Grants P30-DK-079307 (to the Pittsburgh Center for Kidney Research) and R01-DK-075048 and R01-DK-084184 (to K. R. Hallows and N. M. Pastor-Soler), and an American Heart Association grant-in-aid (to N. M. Pastor-Soler). This work was also supported in part by the Victorian Government's Operational Infrastructure Support Program (to B. E. Kemp).
DISCLAIMERS
The funders of this work had no role in the study design, data collection and analysis, decision to publish, or preparation of the manuscript.
DISCLOSURES
No conflicts of interest, financial or otherwise, are declared by the author(s).
AUTHOR CONTRIBUTIONS
Author contributions: S.A.F., S.-W.C., P.F.M., K.R.H., B.E.K., and D.A.P. conception and design of research; S.A.F., S.-W.C., N.M.P.-S., H.L., M.R.D., N.C., M.K., K.G., J.L.M., K.M.D., B.J.V.D., and K.R.H. performed experiments; S.A.F., S.-W.C., N.M.P.-S., H.L., N.C., M.K., P.F.M., K.G., J.L.M., K.M.D., and K.R.H. analyzed data; S.A.F., S.-W.C., N.M.P.-S., H.L., N.C., M.K., P.F.M., K.G., K.R.H., and D.A.P. interpreted results of experiments; S.A.F., S.-W.C., and N.M.P.-S. prepared figures; S.A.F., S.-W.C., and D.A.P. drafted manuscript; S.A.F., S.-W.C., N.M.P.-S., P.F.M., K.M.D., K.R.H., B.E.K., and D.A.P. edited and revised manuscript; S.A.F., S.-W.C., N.M.P.-S., H.L., N.C., M.K., P.F.M., K.G., J.L.M., K.M.D., B.J.V.D., K.R.H., B.E.K., and D.A.P. approved final version of manuscript.
REFERENCES
- 1.Allen TJ, Cooper ME, Gilbert RE, Winikoff J, Skinni SL, Jerums G. Serum total renin is increased before microalbuminuria in diabetes. Kidney Int 50: 902–907, 1996 [DOI] [PubMed] [Google Scholar]
- 2.Almaca J, Kongsuphol P, Hieke B, Ousingsawat J, Viollet B, Schreiber R, Amaral MD, Kunzelmann K. AMPK controls epithelial Na+ channels through Nedd4-2 and causes an epithelial phenotype when mutated. Pflügers Arch 458: 713–721, 2009 [DOI] [PubMed] [Google Scholar]
- 3.Alves DS, Farr GA, Seo-Mayer P, Caplan MJ. AS160 associates with the Na+,K+-ATPase and mediates the adenosine monophosphate-stimulated protein kinase-dependent regulation of sodium pump surface expression. Mol Biol Cell 21: 4400–4408, 2010 [DOI] [PMC free article] [PubMed] [Google Scholar]
- 4.Bhalla V, Oyster NM, Fitch AC, Wijngaarden MA, Neumann D, Schlattner U, Pearce D, Hallows KR. AMP-activated kinase inhibits the epithelial Na+ channel through functional regulation of the ubiquitin ligase Nedd4-2. J Biol Chem 281: 26159–26169, 2006 [DOI] [PubMed] [Google Scholar]
- 5.Brenner BM, Rector FC. Brenner & Rector's the Kidney. Philadelphia, PA: Saunders, 2008 [Google Scholar]
- 6.Brown D, Lydon J, McLaughlin M, Stuart-Tilley A, Tyszkowski R, Alper S. Antigen retrieval in cryostat tissue sections and cultured cells by treatment with sodium dodecyl sulfate (SDS). Histochem Cell Biol 105: 261–267, 1996 [DOI] [PubMed] [Google Scholar]
- 7.Brownsey RW, Boone AN, Elliott JE, Kulpa JE, Lee WM. Regulation of acetyl-CoA carboxylase. Biochem Soc Trans 34: 223–227, 2006 [DOI] [PubMed] [Google Scholar]
- 8.Butterworth MB. Regulation of the epithelial sodium channel (ENaC) by membrane trafficking. Biochim Biophys Acta 1802: 1166–1177, 2010 [DOI] [PMC free article] [PubMed] [Google Scholar]
- 9.Carattino MD, Edinger RS, Grieser HJ, Wise R, Neumann D, Schlattner U, Johnson JP, Kleyman TR, Hallows KR. Epithelial sodium channel inhibition by AMP-activated protein kinase in oocytes and polarized renal epithelial cells. J Biol Chem 280: 17608–17616, 2005 [DOI] [PubMed] [Google Scholar]
- 10.Decleves AE, Mathew AV, Cunard R, Sharma K. AMPK mediates the initiation of kidney disease induced by a high-fat diet. J Am Soc Nephrol 22: 1846–1855, 2011 [DOI] [PMC free article] [PubMed] [Google Scholar]
- 11.Deji N, Kume S, Araki S, Isshiki K, Araki H, Chin-Kanasaki M, Tanaka Y, Nishiyama A, Koya D, Haneda M, Kashiwagi A, Maegawa H, Uzu T. Role of angiotensin II-mediated AMPK inactivation on obesity-related salt-sensitive hypertension. Biochem Biophys Res Commun 418: 559–564, 2012 [DOI] [PubMed] [Google Scholar]
- 12.Dickens F, Simer F. The metabolism of normal and tumour tissue: the respiratory quotient, and the relationship of respiration to glycolysis. Biochem J 24: 1301–1326, 1930 [DOI] [PMC free article] [PubMed] [Google Scholar]
- 13.Dzamko N, van Denderen BJ, Hevener AL, Jorgensen SB, Honeyman J, Galic S, Chen ZP, Watt MJ, Campbell DJ, Steinberg GR, Kemp BE. AMPK β1 deletion reduces appetite, preventing obesity and hepatic insulin resistance. J Biol Chem 285: 115–122, 2010 [DOI] [PMC free article] [PubMed] [Google Scholar]
- 14.Engeli S, Bohnke J, Gorzelniak K, Janke J, Schling P, Bader M, Luft FC, Sharma AM. Weight loss and the renin-angiotensin-aldosterone system. Hypertension 45: 356–362, 2005 [DOI] [PubMed] [Google Scholar]
- 15.Flemmer AW, Gimenez I, Dowd BF, Darman RB, Forbush B. Activation of the Na-K-Cl cotransporter NKCC1 detected with a phospho-specific antibody. J Biol Chem 277: 37551–37558, 2002 [DOI] [PubMed] [Google Scholar]
- 16.Fraser SA, Gimenez I, Cook N, Jennings I, Katerelos M, Katsis F, Levidiotis V, Kemp BE, Power DA. Regulation of the renal-specific Na+-K+-2Cl− co-transporter NKCC2 by AMP-activated protein kinase (AMPK). Biochem J 405: 85–93, 2007 [DOI] [PMC free article] [PubMed] [Google Scholar]
- 17.Frindt G, Palmer LG. Surface expression of sodium channels and transporters in rat kidney: effects of dietary sodium. Am J Physiol Renal Physiol 297: F1249–F1255, 2009 [DOI] [PMC free article] [PubMed] [Google Scholar]
- 19.Galic S, Fullerton MD, Schertzer JD, Sikkema S, Marcinko K, Walkley CR, Izon D, Honeyman J, Chen ZP, van Denderen BJ, Kemp BE, Steinberg GR. Hematopoietic AMPK β1 reduces mouse adipose tissue macrophage inflammation and insulin resistance in obesity. J Clin Invest 121: 4903–4915, 2011 [DOI] [PMC free article] [PubMed] [Google Scholar]
- 20.Gao G, Fernandez CS, Stapleton D, Auster AS, Widmer J, Dyck JR, Kemp BE, Witters LA. Non-catalytic β- and γ-subunit isoforms of the 5′-AMP-activated protein kinase. J Biol Chem 271: 8675–8681, 1996 [DOI] [PubMed] [Google Scholar]
- 21.Gimenez I, Forbush B. Regulatory phosphorylation sites in the NH2 terminus of the renal Na-K-Cl cotransporter (NKCC2). Am J Physiol Renal Physiol 289: F1341–F1345, 2005 [DOI] [PubMed] [Google Scholar]
- 22.Gimenez I, Forbush B. Short-term stimulation of the renal Na-K-Cl cotransporter (NKCC2) by vasopressin involves phosphorylation and membrane translocation of the protein. J Biol Chem 278: 26946–26951, 2003 [DOI] [PubMed] [Google Scholar]
- 23.Gong F, Alzamora R, Smolak C, Li H, Naveed S, Neumann D, Hallows KR, Pastor-Soler NM. Vacuolar H+-ATPase apical accumulation in kidney intercalated cells is regulated by PKA and AMP-activated protein kinase. Am J Physiol Renal Physiol 298: F1162–F1169, 2010 [DOI] [PMC free article] [PubMed] [Google Scholar]
- 24.Hardie DG. AMP-activated protein kinase: a cellular energy sensor with a key role in metabolic disorders and in cancer. Biochem Soc Trans 39: 1–13, 2011 [DOI] [PubMed] [Google Scholar]
- 25.Harris RC, Zhang MZ, Cheng HF. Cyclooxygenase-2 and the renal renin-angiotensin system. Acta Physiol Scand 181: 543–547, 2004 [DOI] [PubMed] [Google Scholar]
- 26.Hawley SA, Pan DA, Mustard KJ, Ross L, Bain J, Edelman AM, Frenguelli BG, Hardie DG. Calmodulin-dependent protein kinase kinase-β is an alternative upstream kinase for AMP-activated protein kinase. Cell Metab 2: 9–19, 2005 [DOI] [PubMed] [Google Scholar]
- 27.Hurley RL, Anderson KA, Franzone JM, Kemp BE, Means AR, Witters LA. The Ca2+/calmodulin-dependent protein kinase kinases are AMP-activated protein kinase kinases. J Biol Chem 280: 29060–29066, 2005 [DOI] [PubMed] [Google Scholar]
- 28.Iverson AJ, Bianchi A, Nordlund AC, Witters LA. Immunological analysis of acetyl-CoA carboxylase mass, tissue distribution and subunit composition. Biochem J 269: 365–371, 1990 [DOI] [PMC free article] [PubMed] [Google Scholar]
- 29.Jordan J, Engeli S, Boye SW, Le Breton S, Keefe DL. Direct renin inhibition with aliskiren in obese patients with arterial hypertension. Hypertension 49: 1047–1055, 2007 [DOI] [PubMed] [Google Scholar]
- 30.Kahn BB, Alquier T, Carling D, Hardie DG. AMP-activated protein kinase: ancient energy gauge provides clues to modern understanding of metabolism. Cell Metab 1: 15–25, 2005 [DOI] [PubMed] [Google Scholar]
- 31.Kiil F, Aukland K, Refsum HE. Renal sodium transport and oxygen consumption. Am J Physiol 201: 511–516, 1961 [DOI] [PubMed] [Google Scholar]
- 32.Kim HS, Kim MJ, Kim EJ, Yang Y, Lee MS, Lim JS. Berberine-induced AMPK activation inhibits the metastatic potential of melanoma cells via reduction of ERK activity and COX-2 protein expression. Biochem Pharmacol 83: 385–394, 2012 [DOI] [PubMed] [Google Scholar]
- 33.Kim SM, Mizel D, Huang YG, Briggs JP, Schnermann J. Adenosine as a mediator of macula densa-dependent inhibition of renin secretion. Am J Physiol Renal Physiol 290: F1016–F1023, 2006 [DOI] [PubMed] [Google Scholar]
- 34.Lee JB, Peterhm Effect of oxygen tension on glucose metabolism in rabbit kidney cortex and medulla. Am J Physiol 217: 1464–1471, 1969 [DOI] [PubMed] [Google Scholar]
- 35.Lee MJ, Feliers D, Mariappan MM, Sataranatarajan K, Mahimainathan L, Musi N, Foretz M, Viollet B, Weinberg JM, Choudhury GG, Kasinath BS. A role for AMP-activated protein kinase in diabetes-induced renal hypertrophy. Am J Physiol Renal Physiol 292: F617–F627, 2007 [DOI] [PubMed] [Google Scholar]
- 36.Lifton RP, Gharavi AG, Geller DS. Molecular mechanisms of human hypertension. Cell 104: 545–556, 2001 [DOI] [PubMed] [Google Scholar]
- 37.Liu W, Pastor-Soler NM, Schreck C, Zavilowitz B, Kleyman TR, Satlin LM. Luminal flow modulates H+-ATPase activity in the cortical collecting duct (CCD). Am J Physiol Renal Physiol 302: F205–F215, 2012 [DOI] [PMC free article] [PubMed] [Google Scholar]
- 38.Mace OJ, Woollhead AM, Baines DL. AICAR activates AMPK and alters PIP2 association with the epithelial sodium channel ENaC to inhibit Na+ transport in H441 lung epithelial cells. J Physiol 586: 4541–4557, 2008 [DOI] [PMC free article] [PubMed] [Google Scholar]
- 39.Masilamani S, Wang X, Kim GH, Brooks H, Nielsen J, Nielsen S, Nakamura K, Stokes JB, Knepper MA. Time course of renal Na-K-ATPase, NHE3, NKCC2, NCC, and ENaC abundance changes with dietary NaCl restriction. Am J Physiol Renal Physiol 283: F648–F657, 2002 [DOI] [PubMed] [Google Scholar]
- 40.Matinlauri IH, Ronnemaa T, Koskinen PJ, Aalto MA, Vukari JS, Irjala KM. Elevated serum total renin is insensitive in detecting incipient diabetic nephropathy. Diabetes Care 18: 1357–1361, 1995 [DOI] [PubMed] [Google Scholar]
- 41.Mendelsohn FA, Johnston CI. A radiochemical renin assay. Biochem J 121: 241–244, 1971 [DOI] [PMC free article] [PubMed] [Google Scholar]
- 42.Mount PF, Gleich K, Tam S, Fraser SA, Choy SW, Dwyer KM, Lu B, Denderen BV, Fingerle-Rowson G, Bucala R, Kemp BE, Power DA. The outcome of renal ischemia-reperfusion injury is unchanged in AMPK-β1 deficient mice. PLos One 7: e29887, 2012 [DOI] [PMC free article] [PubMed] [Google Scholar]
- 43.Mount PF, Hill RE, Fraser SA, Levidiotis V, Katsis F, Kemp BE, Power DA. Acute renal ischemia rapidly activates the energy sensor AMPK but does not increase phosphorylation of eNOS-Ser1177. Am J Physiol Renal Physiol 289: F1103–F1115, 2005 [DOI] [PubMed] [Google Scholar]
- 44.Mount PF, Lane N, Venkatesan S, Steinberg GR, Fraser SA, Kemp BE, Power DA. Bradykinin stimulates endothelial cell fatty acid oxidation by CaMKK-dependent activation of AMPK. Atherosclerosis 200: 28–36, 2008 [DOI] [PubMed] [Google Scholar]
- 45.Oakhill JS, Steel R, Chen ZP, Scott JW, Ling N, Tam S, Kemp BE. AMPK is a direct adenylate charge-regulated protein kinase. Science 332: 1433–1435, 2011 [DOI] [PubMed] [Google Scholar]
- 46.Oppermann M, Mizel D, Huang G, Li C, Deng C, Theilig F, Bachmann S, Briggs J, Schnermann J, Castrop H. Macula densa control of renin secretion and preglomerular resistance in mice with selective deletion of the B isoform of the Na,K,2Cl co-transporter. J Am Soc Nephrol 17: 2143–2152, 2006 [DOI] [PubMed] [Google Scholar]
- 47.Peti-Peterdi J, Harris RC. Macula densa sensing and signaling mechanisms of renin release. J Am Soc Nephrol 21: 1093–1096, 2010 [DOI] [PMC free article] [PubMed] [Google Scholar]
- 48.Pfaffl MW. A new mathematical model for relative quantification in real-time RT-PCR. Nucleic Acids Res 29: e45, 2001 [DOI] [PMC free article] [PubMed] [Google Scholar]
- 49.Ponce-Coria J, San-Cristobal P, Kahle KT, Vazquez N, Pacheco-Alvarez D, de Los Heros P, Juarez P, Munoz E, Michel G, Bobadilla NA, Gimenez I, Lifton RP, Hebert SC, Gamba G. Regulation of NKCC2 by a chloride-sensing mechanism involving the WNK3 and SPAK kinases. Proc Natl Acad Sci USA 105: 8458–8463, 2008 [DOI] [PMC free article] [PubMed] [Google Scholar]
- 50.Richardson C, Rafiqi FH, Karlsson HK, Moleleki N, Vandewalle A, Campbell DG, Morrice NA, Alessi DR. Activation of the thiazide-sensitive Na+-Cl− cotransporter by the WNK-regulated kinases SPAK and OSR1. J Cell Sci 121: 675–684, 2008 [DOI] [PubMed] [Google Scholar]
- 51.Saha AK, Ruderman NB. Malonyl-CoA and AMP-activated protein kinase: an expanding partnership. Mol Cell Biochem 253: 65–70, 2003 [DOI] [PubMed] [Google Scholar]
- 52.Schnermann J, Briggs JP. Synthesis and secretion of renin in mice with induced genetic mutations. Kidney Int 81: 529–538, 2012 [DOI] [PMC free article] [PubMed] [Google Scholar]
- 53.Schnermann J, Briggs JP. Tubuloglomerular feedback: mechanistic insights from gene-manipulated mice. Kidney Int 74: 418–426, 2008 [DOI] [PMC free article] [PubMed] [Google Scholar]
- 54.Soltoff SP. ATP and the regulation of renal cell function. Annu Rev Physiol 48: 9–31, 1986 [DOI] [PubMed] [Google Scholar]
- 55.Stapleton D, Mitchelhill KI, Gao G, Widmer J, Michell BJ, Teh T, House CM, Fernandez CS, Cox T, Witters LA, Kemp BE. Mammalian AMP-activated protein kinase subfamily. J Biol Chem 271: 611–614, 1996 [DOI] [PubMed] [Google Scholar]
- 56.Steinberg GR, Kemp BE. AMPK in Health and Disease. Physiol Rev 89: 1025–1078, 2009 [DOI] [PubMed] [Google Scholar]
- 57.Thatcher RL, Whitworth JA, Casley DG, Johnston CI, Skinner SL. A two-site monoclonal immunoradiometric assay for total renin protein: comparison with an established enzyme kinetic assay. Clin Exp Pharmacol Physiol 15: 285–288, 1988 [DOI] [PubMed] [Google Scholar]
- 58.Tuck ML, Sowers J, Dornfeld L, Kledzik G, Maxwell M. The effect of weight reduction on blood pressure, plasma renin activity, and plasma aldosterone levels in obese patients. N Engl J Med 304: 930–933, 1981 [DOI] [PubMed] [Google Scholar]
- 59.Viollet B, Andreelli F. AMP-activated protein kinase and metabolic control. Handb Exp Pharmacol: 303–330, 2011 [DOI] [PMC free article] [PubMed] [Google Scholar]
- 60.Whittam R. Active cation transport as a pace-maker of respiration. Nature 191: 603–604, 1961 [DOI] [PubMed] [Google Scholar]
- 61.Woods A, Dickerson K, Heath R, Hong SP, Momcilovic M, Johnstone SR, Carlson M, Carling D. Ca2+/calmodulin-dependent protein kinase kinase-β acts upstream of AMP-activated protein kinase in mammalian cells. Cell Metab 2: 21–33, 2005 [DOI] [PubMed] [Google Scholar]
- 62.Woods A, Johnstone SR, Dickerson K, Leiper FC, Fryer LG, Neumann D, Schlattner U, Wallimann T, Carlson M, Carling D. LKB1 is the upstream kinase in the AMP-activated protein kinase cascade. Curr Biol 13: 2004–2008, 2003 [DOI] [PubMed] [Google Scholar]
- 63.Yi CO, Jeon BT, Shin HJ, Jeong EA, Chang KC, Lee JE, Lee DH, Kim HJ, Kang SS, Cho GJ, Choi WS, Roh GS. Resveratrol activates AMPK and suppresses LPS-induced NF-κB-dependent COX-2 activation in RAW 264.7 macrophage cells. Anat Cell Biol 44: 194–203, 2011 [DOI] [PMC free article] [PubMed] [Google Scholar]