

Abstract
The term “transcriptional network” refers to the mechanism(s) that underlies coordinated expression of genes, typically involving transcription factors (TFs) binding to the promoters of multiple genes, and individual genes controlled by multiple TFs. A multitude of studies in the last two decades have aimed to map and characterize transcriptional networks in the yeast Saccharomyces cerevisiae. We review the methodologies and accomplishments of these studies, as well as challenges we now face. For most yeast TFs, data have been collected on their sequence preferences, in vivo promoter occupancy, and gene expression profiles in deletion mutants. These systematic studies have led to the identification of new regulators of numerous cellular functions and shed light on the overall organization of yeast gene regulation. However, many yeast TFs appear to be inactive under standard laboratory growth conditions, and many of the available data were collected using techniques that have since been improved. Perhaps as a consequence, comprehensive and accurate mapping among TF sequence preferences, promoter binding, and gene expression remains an open challenge. We propose that the time is ripe for renewed systematic efforts toward a complete mapping of yeast transcriptional regulatory mechanisms.
Keywords: yeast, transcription factors, regulatory networks, gene expression, chromatin
INITIAL investigations into the coordinated regulation of genes and operons in bacteria established the concepts of regulons and regulatory networks, where regulons include one or more operons controlled by a common regulatory protein and regulatory networks encompass multiple operons, multiple metabolic pathways, and multiple regulatory proteins (Maas and Clark 1964; Gottesman 1984). By the time the sequence of the yeast genome was described in 1996 (Goffeau et al. 1996), it was clear that control of eukaryotic gene expression followed a related scheme, in which sequence-specific transcription factors (TFs) typically bind and regulate groups of functionally related genes. In fact, most well-studied yeast TFs have names such as “Gal4”, “Leu3”, and “Pho4”, reflecting their role in regulation of specific biochemical pathways (e.g., metabolism or control of galactose, leucine, and phosphate) (Svetlov and Cooper 1995; Chua et al. 2004). Post-transcriptional regulatory mechanisms also control functionally related groups of genes (Grigull et al. 2004; Keene 2007; Hogan et al. 2008), and these also qualify as regulatory networks; however, here we focus on DNA-binding proteins and the regulation of transcription.
The study of regulatory networks has become central to analysis of the function and evolution of the yeast genome, and there are now a variety of techniques and approaches to characterizing transcriptional regulatory networks. Moreover, the term regulatory network (or often transcriptional regulatory network or transcriptional network) is now used more generally than originally proposed. There are hundreds of articles exploring yeast transcriptional regulatory networks and their structure, function, and evolution. Indeed, the term network is now used liberally in biology, and its meaning can be confusing. In the context of gene regulation alone it can describe the following (and more), which, albeit related, are distinct: a suite of genes bound and/or controlled by a specific regulatory factor [e.g., TF, RNA-binding protein (RBP), or chromatin protein] (e.g., Lee et al. 2002; Proft et al. 2005); the overall structures and relationships of multiple regulons (e.g., regulatory cascades, oscillatory circuits, etc.), often using terminology adapted from graph theory (e.g., Balaji et al. 2006; Yu and Gerstein 2006; Michoel et al. 2011); the relationships among TF binding sites, TF binding events, gene expression patterns, and gene functions (e.g., Gao et al. 2004; Hu et al. 2007); and inferred (or “reconstructed”) regulatory structures and mechanisms derived from gene expression data and other data sources (e.g., Segal et al. 2003; Ernst et al. 2007; Kundaje et al. 2008; Yeo et al. 2009).
Here, we focus mainly on the nuts and bolts of the networks themselves, rather than on higher-level analyses of network structures, evolution of transcriptional regulatory systems, or computational methodologies—we take “mapping yeast transcriptional networks” to mean the enterprise of understanding how the DNA sequence is read and interpreted to execute coordinated gene expression patterns, in as direct a manner as possible, and driven entirely by data, where it is possible. We begin with an enumeration of parts and the major types of data now available. We then consider some key observations, including how well the data all fit together. We also discuss what we should be trying to accomplish presently to understand transcriptional networks and how we might accomplish it. We apologize to the many investigators in this expansive field whose work is not cited here. We refer readers to excellent reviews written previously on this topic, including Bussemaker et al. (2007) and Kim et al. (2009).
Components of Transcriptional Networks and How They Work
Yeast transcription factor inventory
A list of TFs is essential to concretely and systematically map transcriptional networks. Several such lists have been compiled, using varying criteria (Svetlov and Cooper 1995; Lee et al. 2002; Chua et al. 2004; Badis et al. 2008; de Boer and Hughes 2011). These lists contain 141–251 proteins. A major source of discrepancy is the definition of TF itself. Here we consider as TFs proteins that (a) bind DNA directly and in a sequence-specific manner and (b) function to regulate transcription nearby sequences they bind (Fulton et al. 2009). Proteins that encode well-characterized DNA-binding domains (DBDs) are considered putative TFs until proved otherwise, while other proteins do not receive such benefit: although new classes of TFs continue to be identified (e.g., Hall et al. 2004; Weider et al. 2006; Liko et al. 2007), an extensive literature review of mouse and human TFs found that only 8 of 545 human proteins that bind specific DNA sequences and regulate transcription also lack a known DBD (Fulton et al. 2009).
By our current estimate there are ∼209 known and putative yeast TFs, the vast majority of which contain a canonical DNA-binding domain. The Yeast TF Specificity Compendium (YeTFaSCo) (de Boer and Hughes 2011) listed 301 TF-encoding genes associated with either motifs or DBDs. However, if we remove “dubious” entries such as known chromatin proteins that contain MYB/SANT, ARID, and HMG domains, which are often not sequence specific (Boyer et al. 2002; Patsialou et al. 2005; Stros et al. 2007), and also those for which there is no evidence that they directly bind DNA in a sequence-specific manner in yeast, only 209 remain. Categorized by DNA-binding domain, most yeast TFs fall into only a handful of classes. Most abundant are the GAL4/zinc cluster domain (57 proteins), which is largely specific to fungi, and the zinc finger C2H2 domain (41 proteins), which is the most common among all eukaryotes (Weirauch and Hughes 2011). Other classes that are represented by numerous proteins include bZIP (15), Homeodomain (12), GATA (10), and basic helix-loop-helix (bHLH) (8).
Very few yeast TFs are essential for viability in rich or complete medium, but many appear to be required for specific growth conditions, such as stresses and nutrient-deprived conditions (Chua et al. 2004), which is consistent with the notion that the majority of TFs regulate transcription only in specific conditions. An alternative explanation is that there is genetic redundancy among TFs; i.e., deletion of one TF is “buffered” by a second TF that can substitute for the first, e.g., by regulating an overlapping set of genes. A systematic examination of pairwise genetic interactions among sequence-specific TFs (Zheng et al. 2010a) did find an enrichment of “negative synthetic interactions” (i.e., cases where the double mutant grows slower than would be expected from the combination of single mutants) among TFs that have a significant overlap in target genes previously identified by ChIP-chip (Harbison et al. 2004; Macisaac et al. 2006). The same study, however, found a relative lack of genetic interactions among sequence-specific TFs overall, in comparison to components of the general transcription machinery, perhaps because the assays were done in only one condition (Zheng et al. 2010a).
Additional support for the notion that many yeast TFs are condition-specific regulators is that binding sites for most TFs confer little effect on reporter expression in typical laboratory growth conditions. A study using a pool of 6500 synthetic promoters, each upstream of an identical YFP reporter, compared the relative expression conferred by different combinations and positions of yeast TF binding sites and other sequence features (Sharon et al. 2012). When yeast were grown in SC medium with galactose as a carbon source, and lacking most amino acids, most of the TF binding sites tested (40/75 or 53%) conferred an expression change no different from that of the null promoter. The sequences conferring the highest expression by far were the binding sites for Gal4 and Gcn4, which the growth conditions were specifically intended to activate. While it is conceivable that these TFs are especially potent, it is also possible that growth under other specific conditions would activate other TFs to similar levels. Indeed, as discussed below, other studies have used such specific growth conditions to obtain large and meaningful genomic binding patterns or perturbation of genome-wide expression profiles upon TF deletion.
Yeast transcription factor sequence specificities
The sequence specificity of the TFs is a key ingredient in the analysis of transcriptional regulatory mechanisms and networks. There are a variety of methods for obtaining the sequence specificity of TFs. Characterization of intrinsic sequence preferences (i.e., those due only to the TF interacting with the DNA) ideally involves either in vitro or heterologous systems [e.g., bacterial 1-hybrid (Meng et al. 2005)], to avoid confounding effects of other factors present in the cell. Recent reviews describe the different methods in detail (Stormo and Zhao 2010; Jolma and Taipale 2011). Universal protein-binding microarrays (PBMs) (Berger et al. 2006) are currently the in vitro method by which the largest number of yeast TFs have been analyzed successfully [150 TFs (Badis et al. 2008; Zhu et al. 2009; Gordan et al. 2011)]. In a typical PBM, the protein of interest is exposed to a microarray with ∼40,000 double-stranded DNA probes, each containing a 25-base priming site and 35 bases of sequence that differs from one probe to the next. The probe set is carefully designed so that each 10-base sequence occurs once and only once; however, motifs of at least 14 bases can be generated using PBMs (Berger et al. 2006; Badis et al. 2009). Twenty yeast TFs have also been examined using a related method, MITOMI, which uses microfluidics to measure off-rates to individual sequences (Maerkl and Quake 2007; Fordyce et al. 2010). Another related method employing a high-throughput sequencing instrument to both generate random sequences and measure off-rates has also been described (Nutiu et al. 2011). Only a single protein (Gcn4) was analyzed, but the much larger number of sequences queried and the quantitative nature of the data appear to have resulted in a more accurate motif than was obtained by the PBM. The classical in vitro approach of selecting binding sequences from random pools (“SELEX”) has also been adapted to high-throughput sequencing (Zykovich et al. 2009; Jolma et al. 2010), but has not been applied systematically in yeast.
Sequence specificity of TFs can also be inferred systematically from in vivo data, including motif analysis of ChIP-chip and ChIP-seq data (see next section) (e.g., MacIsaac et al. 2006) and microarray analysis of TF overexpression and deletion strains (e.g., Chua et al. 2006; Hu et al. 2007). It should be cautioned, however, that motifs identified from in vivo studies may include cofactor and context information, and in fact the derived motifs in some cases are those of other DNA-binding proteins. Rap1 is particularly prevalent in this regard: presumably due to its function as a general regulatory factor (GRF) (see below), Rap1 binding sequences are often found near in vivo binding sites for other TFs, and consequently its motif has been derived from ChIP-chip data from Fhl1, Sfp1, Ace2, Cha4, Yap5, and Pdr1 (Gordan et al. 2009; de Boer and Hughes 2011). In addition, ChIP-chip analysis of non-DNA-binding proteins can identify motifs of the factors that recruit them, as in the case of Dig1, a protein with no known intrinsic DNA-binding activity, but that binds and inhibits Ste12 (Cook et al. 1996; Tedford et al. 1997). Presumably as a result of this interaction, ChIP-chip analysis of Dig1 yields the Ste12 motif (Harbison et al. 2004). The fact that indirect interactions are readily detected by ChIP complicates its use in motif definition, as it cannot be determined whether the identified motif is that of the protein being affinity purified, an associated protein, or a composite of factors. The use of in vivo derived motifs also complicates the use of the same in vivo data to validate motifs, since it potentially invokes circularity.
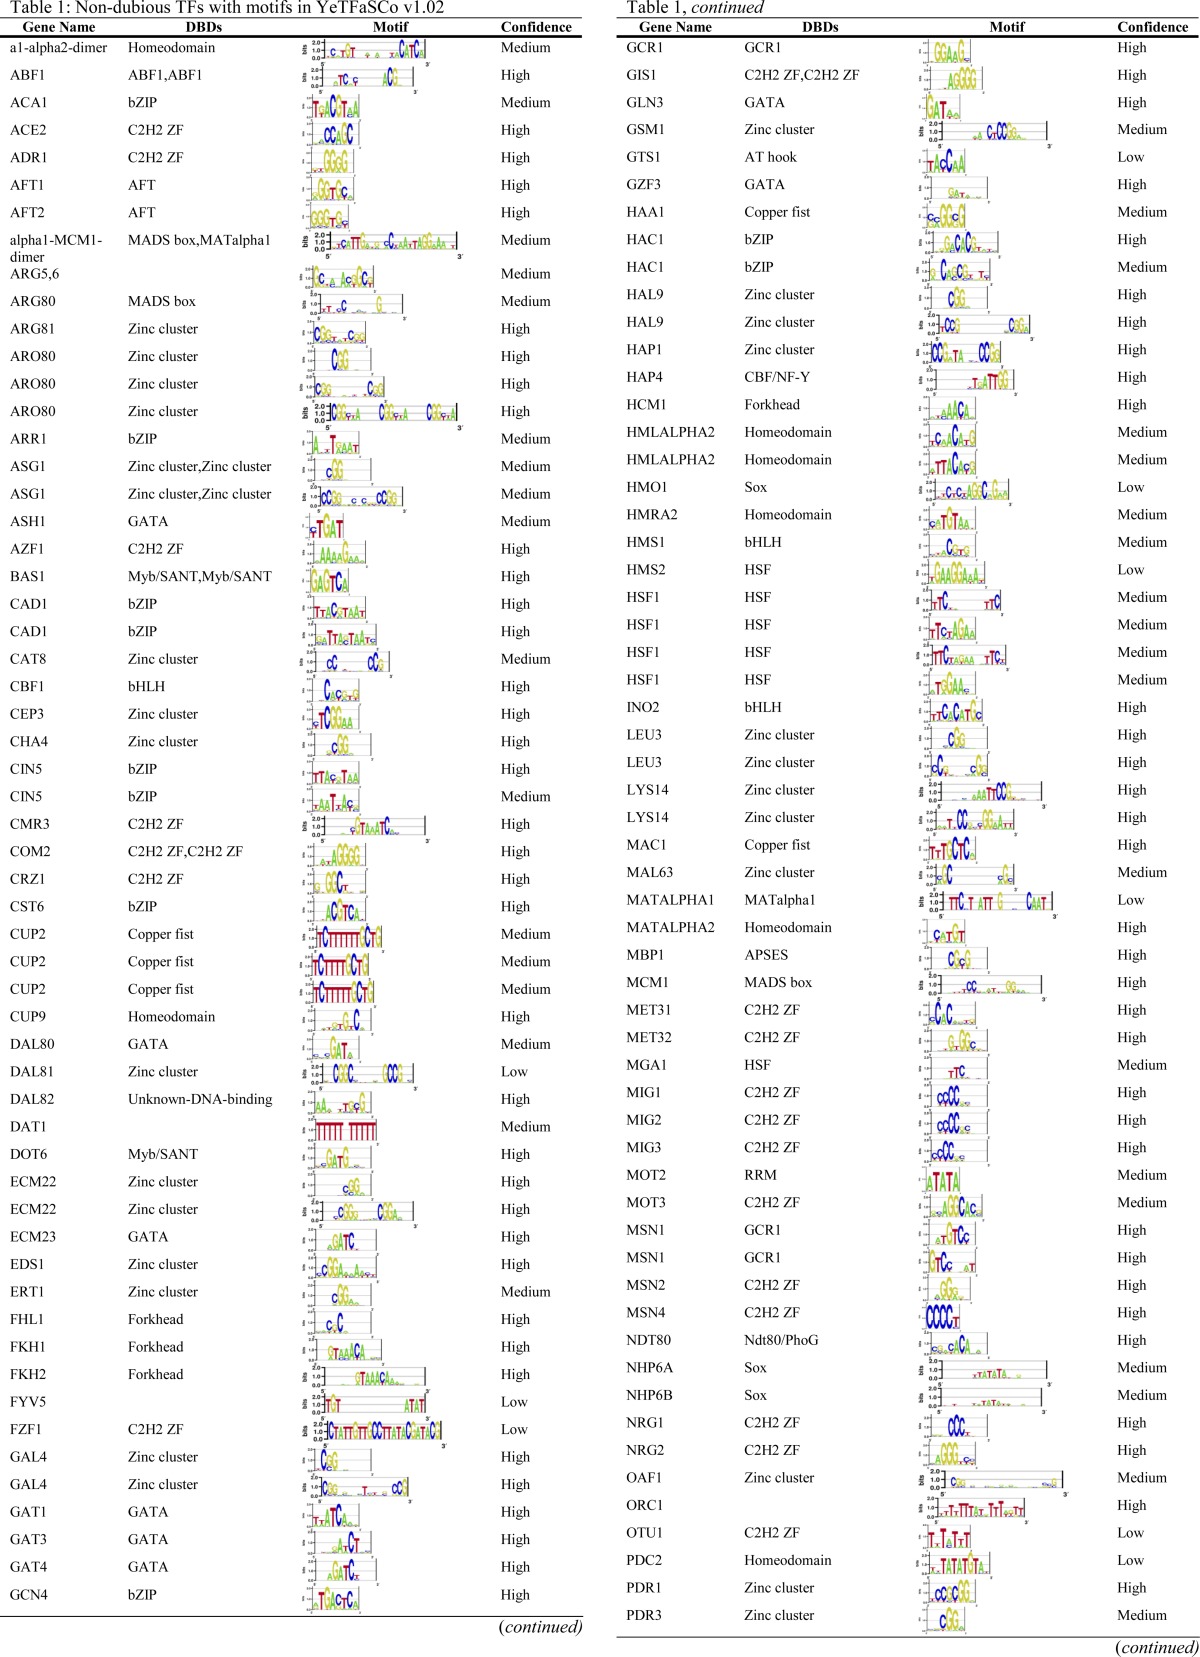
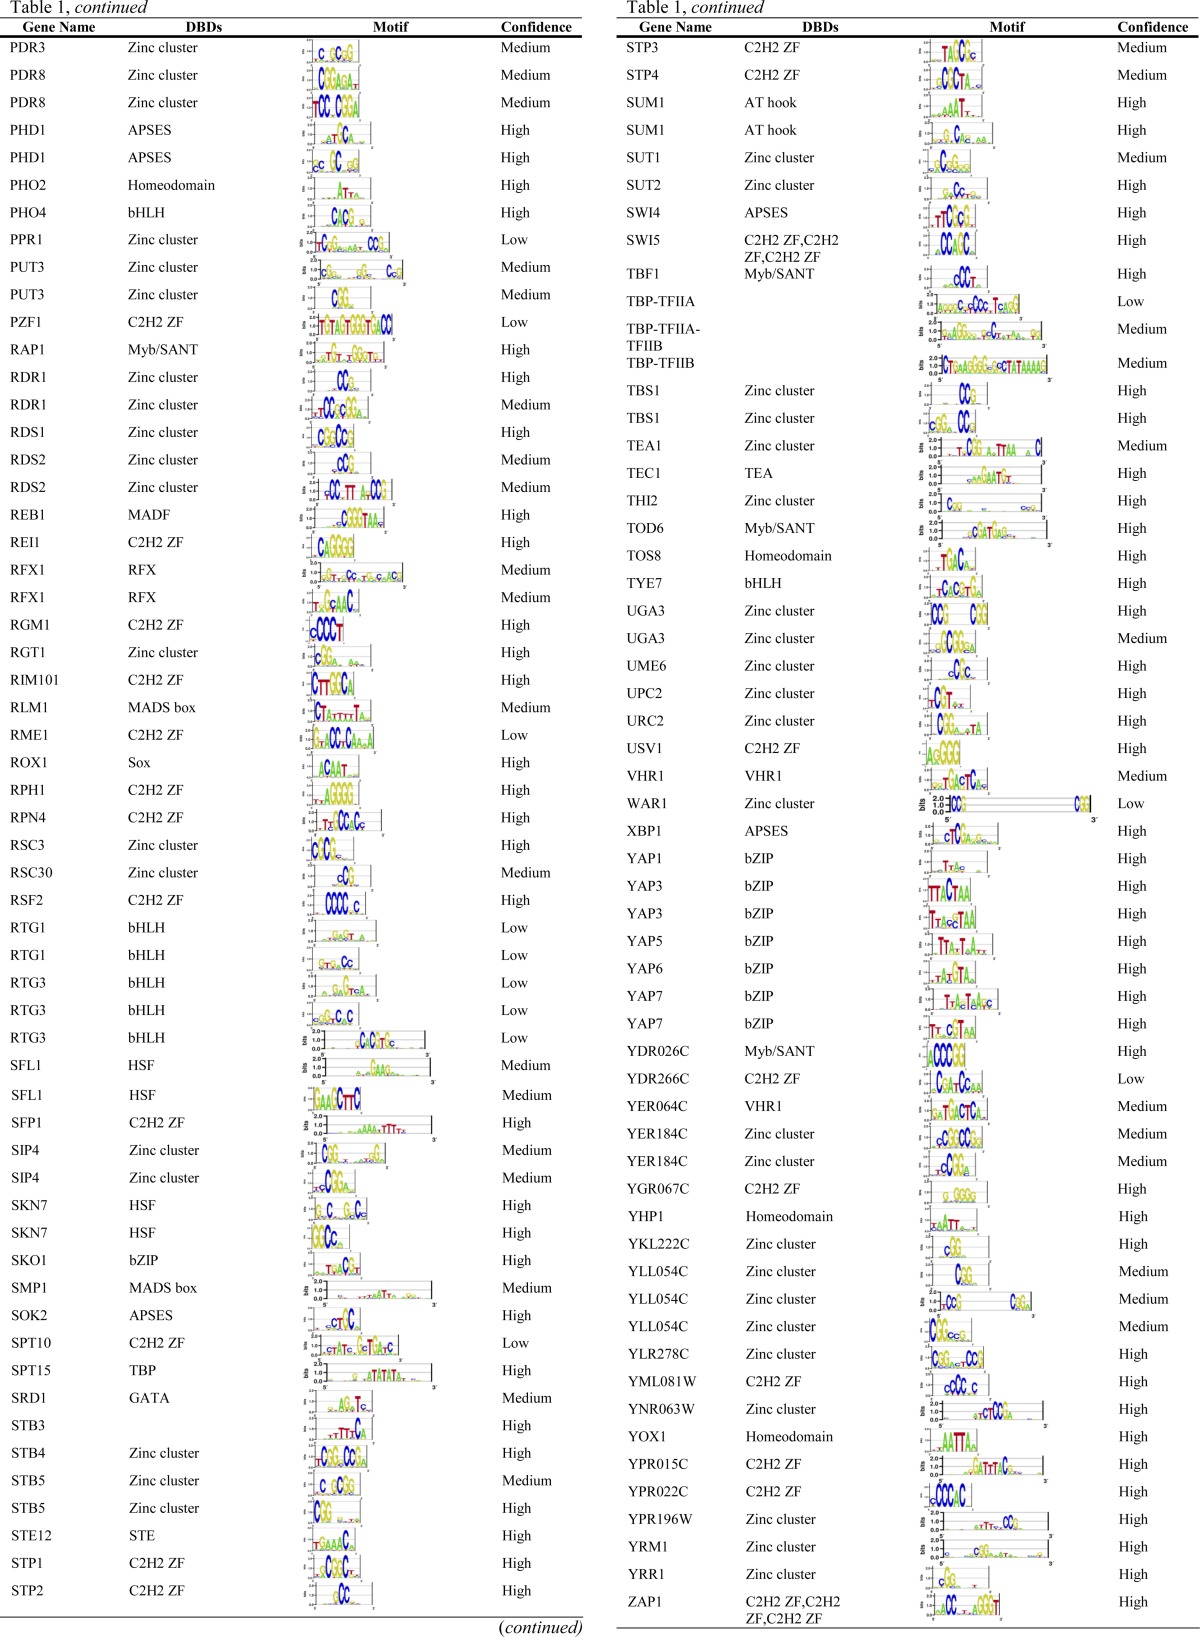
There are several online resources that compile yeast TF sequence preferences. The MacIsaac motif set (MacIsaac et al. 2006), which is based on reanalysis of the Harbison ChIP-chip data (Harbison et al. 2004) (see below), has been used in many studies of yeast gene expression, but it is incomplete (only 98 motifs) and subsequent analyses suggest that not all of the motifs are accurate. In this article we primarily utilize our own database, YeTFaSCo, in which we integrated all other motif sets available as of its publication in 2011 (from the literature, large-scale data analyses, and computational analyses). Table 1 presents the motifs for 189 TFs currently annotated in YeTFaSCo. We refer readers to the YeTFaSCo article for more information (de Boer and Hughes 2011). Two other related collections were published almost simultaneously (Gordan et al. 2011; Spivak and Stormo 2012) and have now been incorporated into the latest version of YeTFaSCo (1.02). There are almost 2000 reported yeast TF motifs, for 259 proteins, mostly from reanalysis of the Lee/Harbison ChIP-chip data sets (Lee et al. 2002; Harbison et al. 2004; MacIsaac et al. 2006; Qi et al. 2006; Morozov and Siggia 2007; Pachkov et al. 2007; Reddy et al. 2007; Chen et al. 2008; Foat et al. 2008), and in many cases (roughly half of all TFs) there are clear discrepancies among motifs reported for the same TF. We evaluated each of the motifs on independent data sets (e.g., asking whether a motif derived from in vivo binding data is consistent with in vitro binding data or with the effects of TF perturbation on gene expression) and manually examined the results, as well as the literature on the protein of interest. We identified 143 high-confidence motifs, 69 medium-confidence motifs, and 37 low-confidence motifs; in some cases the same protein was associated with multiple motifs to represent different binding modes (e.g., monomeric vs. dimeric). These labels are subjective, but strongly support the idea that the sequence specificity of yeast TFs is still incompletely known. Additionally, representation, derivation, evaluation, and comparison of motifs is itself an active field (e.g., Zhao and Stormo 2011). Many of the details are technical, and although they are important, they are beyond the scope of this review. As a specific example, the well-studied TF Hsf1, a member of the multimeric heat-shock family of TFs, has several high-scoring motifs that appear to represent monomeric, dimeric, and trimeric binding forms (Table 1); standard motif representations do not intrinsically account for different multimeric configurations.
Table 1. Non-dubious TFs with motifs in YeTFaSCo v1.02.
Yeast transcription factor activities
In theory, knowledge of the specific biochemical functions of TFs (beyond binding specific DNA sequences) may not be essential for mapping transcriptional regulatory networks. If one assumes that a TF always activates or represses the same way under the same conditions at every site where it is bound, then it is not critical to know why it has this effect to map from TF binding to gene expression: the TF can simply be considered as assigning a directed weight to the sequence. However, this outcome appears not to be the case as a general rule. It has long been known that not all TF–DNA binding events are created equal; for example, different mutants in Hap1 that do not affect DNA binding can selectively affect the expression of different genes, presumably due to differing interactions with cofactors (Turcotte and Guarente 1992). As described below, genome-wide analyses also indicate that there is a relatively weak relationship between individual TF binding events and the genes affected by mutation of the TF, which cannot be completely explained by noise in the data, transcriptional cascades, or condition-specific activation. Such phenomena are not restricted to yeast, and numerous explanations for the large fraction of inactive or “neutral” TF binding events have been put forward, both mechanistic and evolutionary (MacQuarrie et al. 2011). One possible explanation for the apparent high frequency of context specificity of the effects of TF binding may be that each TF is typically a platform for recruiting one or more activities, and it is the combination of activities at a promoter that determines the level of gene activation—i.e., one that remodels nucleosomes, one that recruits RNA polymerase, one that facilitates elongation, etc.
Regardless of whether such a model is correct, a complete index of TF activities and interacting partners would be extremely valuable to relate TF binding events to gene expression outcomes and to dissect the regulatory mechanisms. To our knowledge no such index exists, and indeed the knowledge itself appears to exist only for a minority of TFs (Frietze and Farnham 2011; Hahn and Young 2011; Rando and Winston 2012). A common theme is that TF cofactors are often chromatin-modifying proteins and that TFs can recruit multiple cofactors. These activities represent a potentially complex (and currently largely hidden) layer between the DNA sequence and transcriptional output.
Mapping the Physical Locations of TFs and Other Molecules on Chromosomes
Another foundation of mapping transcriptional networks is the association of TFs with the promoters (or other gene components) to which they bind in vivo. Methods that assess the genome-wide physical association of proteins with DNA in the cell have become prevalent over the last decade. There are several technologies that can make related measurements.
ChIP-chip and related methods
The most abundant in vivo protein–DNA data type as of 2013 is ChIP-chip, in which proteins are cross-linked to DNA, cells or extracts are sonicated to release fragmented chromatin (typically a few hundred base pairs associated with proteins), the protein of interest is affinity purified, and the associated DNA is quantified using microarrays. ChIP-chip was first described just over a decade ago by several groups almost simultaneously (Ren et al. 2000; Iyer et al. 2001; Lieb et al. 2001) and has been the subject of numerous reviews (e.g., Odom 2011). Many of the published yeast ChIP-chip experiments have involved “spotted” microarrays, in which each spot on the array represents a different promoter, so do not inherently reveal the precise location that is bound. Tiling oligonucleotide microarrays, which became available several years after spotted arrays became common, enable more accurate determination of the binding-site position.
Technologically, ChIP-chip has now been largely supplanted by ChIP-seq [introduced in 2007 (Barski et al. 2007; Robertson et al. 2007)]. ChIP-seq is generally believed to be more accurate than tiling arrays. Although it has been reported that sequencing may be subject to artifacts related to bias in the size and base composition of amplified fragments (Dohm et al. 2008; Auerbach et al. 2009), the benefits appear to outweigh any such disadvantages. In ChIP-seq, the exact ends of the DNA fragments can be mapped, and a large number of reads (typically hundreds to thousands) forming a “peak” when aligned to the genome can help to delineate the exact binding location (Valouev et al. 2008). Moreover, the recently described ChIP-exo method can provide nucleotide-level resolution (Rhee and Pugh 2011).
ChIP can also be used to measure the kinetics of TF–DNA binding in vivo. Lickwar et al. (2012) used competition between two different tagged versions of Rap1, one of which can be rapidly induced, to measure turnover rates at bound loci, in addition to occupancy. This experimental procedure allowed the rate of replacement of Rap1 at a given locus to be quantified provided the residence time is >500 sec. Among 439 such peaks obtained, the correlation between occupancy and residence time was low (R2 = 0.14). Strikingly, the residence time showed higher correlation than occupancy measurements to many indicators of TF function, including Pol II association, transcription rate, messenger (m)RNA levels, intrinsic and in vivo nucleosome occupancy, Rap1 sequence preferences, and selected histone modifications and histone modifier associations with the same loci. Although only one TF was examined, the conclusions of Lickwar et al. are similar to those of a previous study employing the mammalian glucocorticoid receptor (Stavreva et al. 2004).
The idea that residence time is a more relevant parameter than occupancy could have far-reaching impact; if it is generally true, it could resolve several major challenges and discrepancies in the field of transcriptional regulatory networks. As discussed below, there is relatively poor correspondence between TF–promoter occupancy measured by ChIP-chip or ChIP-seq and either transcriptional output or the sequence features of the same promoters—while comparing promoter sequence features directly to transcriptional output often has a better correspondence. Perhaps the sequence features function more to control TF residence time or some other aspect of TF function, rather than TF occupancy.
Other methods to identify TF binding sites in vivo on a genomic scale have been described and applied in yeast. The “Calling Cards” method (Wang et al. 2007), recently extended to “Calling Card–seq” (Wang et al. 2011), involves fusing a TF to a piece of the Sir4 protein that physically interacts with and thus recruits the Ty5 integrase (Zhu et al. 2003), resulting in preferential integration of a Ty5 transposon near the site where the TF is bound. The Ty5 sites are recovered by PCR amplification and sequencing of the junction fragments. On the basis of comparison to previously mapped binding sites, the method has high specificity and sensitivity, and most of the integration sites are within 100 bp of actual binding events. This level of resolution is comparable to that of conventional ChIP-seq, although not ChIP-exo, and is sufficient to enable identification of known and novel motifs by de novo motif searches. There is a potential disadvantage in that integration sites may be selected against if they influence the growth of the yeast. A particular advantage of the approach, however, is that, by barcoding the transposons in vivo, multiple samples can be analyzed simultaneously in the same DNA preparation and sequencing sample. It is likely that, with advances in sequencing throughput, analysis of all ∼200 yeast TFs would be possible in a single sequencing lane, enabling experiments in which global TF occupancy is simultaneously queried over multiple growth conditions.
Digital genomic footprinting (Hesselberth et al. 2009) applies high-throughput DNA sequencing to classical DNaseI footprinting. This approach takes advantage of the fact that proteins bound to DNA confer resistance to nuclease digestion, such that TF binding sites can appear as regions of unusually low cleavage in DNaseI hypersensitive sites. In a single sample, Hesselberth et al. identified several thousand such footprints, with roughly half of all yeast genes having at least one footprint in its promoter. The identity of the TF bound to each site is not inherently revealed by digital genomic footprinting, but can be inferred by motif searching. Hesselberth et al. found that many yeast TF motifs are enriched in the footprints, in aggregate, and that the motifs for a handful of yeast TFs [including all of the GRFs (see below)] could be identified by de novo motif searches. A caveat of this finding is that intergenic sequence was used as background in the analysis, and motif matches for many if not most TFs (and particularly GRFs) are enriched in nucleosome-free regions (NFRs) relative to other intergenic regions (Lee et al. 2007). Thus, randomly chosen segments of DNaseI-hypersensive regions would also be expected to score highly for TF motif matches, especially those of GRFs. For at least some of the motifs, however, strong and characteristic patterns of preferential cleavage were observed within regions matching the motif (Hesselberth et al. 2009), providing additional support for the protein-binding events and potentially revealing structural characteristics of the DNA–protein interactions. A related approach using micrococcal nuclease (MNase), which is commonly used for nucleosome mapping because nucleosomes are resistant to MNase digestion, also appears to be able to map individual TF binding events, allowing a description of the global patterns of nucleosomes flanking TF binding sites (Henikoff et al. 2011).
Observations from major data sets
The number of whole-promoter ChIP-chip experiments that have been published and the fact that many of them were collected in a uniform fashion for the majority of yeast TFs (some in multiple conditions) still make ChIP-chip with whole promoter probes the most abundant data type, and the available data form the basis of our current overview of yeast transcriptional networks. Table 2 summarizes five of the largest yeast ChIP-chip and ChIP-seq studies (Lee et al. 2002; Harbison et al. 2004; Workman et al. 2006; Venters and Pugh 2009; Venters et al. 2011) and the number of experiments and number of sequence-specific TFs encompassed by each. Note that the Venters study (Venters et al. 2011) is dominated by chromatin factors and that the Harbison et al. data largely encompass the Lee et al. data.
Table 2. Major yeast ChIP-chip data sets.
| Citation | Description of study | No. TFs (nondubious + putative) | Array type | Conditions |
|---|---|---|---|---|
| Lee et al. (2002) | 106 Myc-tagged proteins | 94 | Spotted yeast promoter arrays using “Yeast Intergenic Region Primers” | YPD |
| Harbison et al. (2004) | 295 ChIP-chip experiments involving 203 Myc-tagged proteins; 84 of the proteins were examined under multiple growth conditions | 158 | Spotted yeast promoter arrays using Yeast Intergenic Region Primers | YPD, various others |
| Workman et al. (2006) | 30 DNA damage-related proteins | 26 | Spotted yeast promoter arrays using Yeast Intergenic Region Primers | YPD + MMS |
| Venters and Pugh (2009) | One native and 27 TAP-tagged proteins involved in different stages of transcription | 8 | Affymetrix S. cerevisiae Tiling 1.0R Array and other arrays [same as (Venters et al. (2011)] | YPD at 25°, YPR + Gal at 37°, YPD at 37° |
| Venters et al. (2011) | >800 ChIP-chip and 20 ChIP-seq experiments for 202 TAP-tagged proteins involved in different stages of transcription | 39 | 60-bp probes to −320:−260 and −90:−30 and other regions (Operon Biotechnologies) | YPD at 25°, 37° |
Among just these five studies, 159 (76%) of all TFs, according to our assessment (de Boer and Hughes 2011), have at least one ChIP-chip experiment, and many have more than one. The Harbison data, which contain data from multiple growth conditions for many of the TFs, have been extensively analyzed. Despite having been collected using what would be considered a noisy and low-resolution platform today (full-promoter spotted arrays), several general observations are apparent and have been largely verified by analysis of this and other related data sets:
There is a tendency for some promoters to be bound in vivo by a much greater number of TFs than other promoters. Harbison et al. described a high-confidence map of 11,000 interactions between TFs and promoters, at a high stringency (P < 0.001) (Harbison et al. 2004). The data processing and normalization scheme used by Harbison et al. included subtraction of the mean log ratio across experiments for each microarray spot, which should have prevented promoters that are consistently immunoprecipitated from appearing consistently bound in the data. Despite this, the TF–promoter interactions are highly skewed toward a few promoters that have a very large number of binding events. Figures 1 and 2 illustrate these points. The promoters that are generally occupied by a larger number of TFs tend to correspond to genes located near autonomously replicating sequences, Ty1 transposons, centromeres, and subtelomeric regions. Indeed, two recent reanalyses of these data found that >10% of TFs bind in subtelomeric regions (Mak et al. 2009; Smith et al. 2011); the latter study also observed a similar trend for other TFs (Smith et al. 2011). A similar phenomenon was reported for Caenorhabditis elegans and Drosophila, with certain regions being highly bound by many different transcription factors [so-called highly occupied target (“HOT”) regions] (Moorman et al. 2006; Gerstein et al. 2010; Roy et al. 2010). To our knowledge, the explanation for and biological significance of the HOT regions remain incompletely resolved; however, the HOT regions often correspond to regions of open chromatin (Gerstein et al. 2010; Roy et al. 2010; Li et al. 2011), and some of the repetitive DNA sequences in yeast, like autonomously replicating sequences (ARS) and telomere X elements, are known to have an open chromatin structure in Saccharomyces cerevisiae (Kaplan et al. 2009; Berbenetz et al. 2010; Wellinger and Zakian 2012), suggesting that chromatin accessibility likely plays a role in delineation of these elements.
Most TFs tend to bind relatively few targets (Figure 1A), with 57/155 unique proteins binding five or fewer promoters in at least one condition and 17 not significantly binding any promoters under any condition tested. This is likely due to some of the TFs being inactive under the conditions tested. In contrast, several TFs have hundreds of promoter targets. These TFs include the GRFs, which play a global role in transcription under diverse conditions. There are groups of TFs that all recognize the same set of promoters (which results in red boxes in Figure 2). These cases do not always correspond to TFs that have related DNA sequence specificity; for example, Rap1 and Fhl1, which coregulate ribosomal protein genes, bind overlapping sets of promoters despite having very different sequence specificities.
While some TF binding sites (TFBSs) tend to occur in tandem arrays—a requirement for stable binding by Dal80 (Cunningham and Cooper 1993)—most yeast TFs appear to bind to isolated motifs (Harbison et al. 2004). Whether or not TFs act cooperatively, in general, is still an unresolved issue, to our knowledge, as discussed below.
The global landscape of the binding of a TF can change upon perturbation or changes in growth conditions, in some cases dramatically (e.g., Harbison et al. 2004; Workman et al. 2006) (Figure 2). This observation reinforces the notion that many TFs are condition-specific regulators, and underscores that the transcriptional regulatory network is not a single static entity. Presumably, the arrangement of molecules on chromosomes and their resulting transcriptional output represent the combined action of all of the factors that are present and active: both TFs and chromatin factors can be regulated post-transcriptionally (D’Alessio et al. 2009).
There appear to be no fixed rules regarding the relationship between in vivo binding and activation (or repression), a topic that is also discussed below and by Hahn and Young (2011). Harbison et al. (2004) described four general scenarios, however: (i) “condition-invariant” regulators, such as Leu3, which bind DNA constitutively and are activated only under specific conditions; (ii) “condition-enabled” regulators, such as Msn2, which bind only when activated; (iii) “condition-expanded” regulators, such as Gcn4, which bind some sites constitutively but bind many more when activated; and (iv) “condition-altered” regulators, such as Ste12, which bind different sets of promoters depending on growth conditions, presumably due to the activation and/or deactivation of cofactors. These observations are generally consistent with those from detailed studies of individual TFs: there are many mechanisms by which TFs themselves can be regulated (Hahn and Young 2011).
It is possible to identify sequence motifs for roughly half of all TFs, using whole-promoter-resolution ChIP-chip data (MacIsaac et al. 2006), and it appears that an even larger proportion of ChIP-seq experiments yield motifs (Valouev et al. 2008). Thus, while TF sequence preferences are not the only determinant of binding in vivo, they are a major factor.
A variety of network structures and network “motifs” (e.g., feedback loops, feedforward loops, and regulatory changes) are over- or underrepresented in ChIP-chip networks (e.g. Lee et al. 2002 and many subsequent analyses including Luscombe et al. 2004). Autoregulation, in which TF genes harbor a binding site for their encoded protein in the promoter, is an example of a network motif that is overrepresented relative to expectation, but is not the general case (Figure 3). Autoregulation has the potential to form a positive feedback loop, enforcing cell states until the TF is deactivated. One such example is Ste12, which regulates both the mating response and pseudohyphal growth; the Ste12 protein binds to the STE12 gene promoter, which is induced as part of the mating response (Dolan and Fields 1990; Ren et al. 2000; Roberts et al. 2000; Borneman et al. 2006). However, such cases appear to be a minority; scoring TF gene promoters with the TF motif (de Boer and Hughes 2011) or scoring by ChIP-chip P-value (Harbison et al. 2004) results in a distribution of scores suggesting that no more than 20% of yeast TFs autoregulate, roughly consistent with early estimates of ∼10% (Lee et al. 2002) (Figure 3).
Figure 1.

Distribution of TF binding events. (A) Histogram showing the number of TFs that bind to specific numbers of targets (ChIP probes). If a TF was assayed in multiple conditions, each condition is counted separately. (B) Histogram showing the number of targets (ChIP probes) that are bound by specific numbers of TFs, counting each condition under which a TF was tested separately. Data were derived from Harbison et al. (2004), using a 0.001 P-value cutoff (Harbison et al. 2004).
Figure 2.

Two-dimensional hierarchical clustering analysis of ChIP-chip data (Harbison et al. 2004), encompassing 288 TF-condition combinations, 14 distinct conditions, and 155 distinct proteins. There are 5824 chip probes. Three examples of clusters are magnified on top, showing the bound genes (i.e., promoters) as well as the target TF and conditions of the ChIP experiment. Asterisks indicate the gene is part of the indicated pathway and gene labels in parentheses represent alternate probes for a promoter already listed. Also shown are expression data showing the changes resulting from deletion of the corresponding TFs (Hu et al. 2007). Missing data are represented by gray and black in the expression data and ChIP data, respectively.
Figure 3.

TF autoregulation analysis. Shown is the observed percentage of autoregulatory interactions (of all TFs) minus the percentage expected by chance, when varying cutoff for the number of predicted targets (x-axis), for all TFs. Rank sum P-values are 0.003 and 5 × 10⁻⁷ for ChIP-chip and motif instances, respectively, comparing the ranks of autoregulatory binding vs. other promoter binding.
Gene Expression Patterns and the Genome’s Transcriptional Output
A major goal of mapping transcriptional networks is to provide a mechanistic basis for the genome’s transcript outputs. For this endeavor to be realistic it is necessary to have measurements of gene expression. These measurements would preferably encompass a wide variety of cellular states and stresses, including perturbation of trans-acting factors such as TFs. In this way, the specific impact of differential regulation of as many individual components as possible can be discriminated within the aggregate data. Since TFs are conventionally thought to affect the generation of transcripts, it would be ideal to measure transcription itself, rather than transcript levels, which also reflect RNA stability [and potentially also polyadenylation state, if poly(A) selection is employed]. Transcription can be measured in a bulk culture by examination of the location of RNA polymerase using ChIP, the strand-specific NET-seq (Churchman and Weissman 2011), or an equivalent method, but these methods have the drawback that polymerase density reflects both the transcript initiation rate and the rate of polymerase elongation. It is also worth considering that RNA stability is now known to be controlled in at least some cases by promoter elements, possibly by influencing proteins that are associated with mRNAs (Bregman et al. 2011; Trcek et al. 2011). The linkage between transcriptional regulation and transcript stability will undoubtedly be a hotly pursued topic in the near future; the recent development of new methodology for measuring absolute rates of mRNA synthesis and decay led to the finding that there is a global coupling between mRNA synthesis and degradation (Sun et al. 2012).
Microarray data
Currently, microarray gene expression measurements under diverse conditions—including directed perturbation of TFs—represent the most abundant transcription-related data type in yeast. Hibbs et al. (2007) compiled 2394 yeast microarray experiments, collected from 81 different publications, and TransfactomeDB (Foat et al. 2008) similarly cataloged ∼4000 yeast microarray experiments from the Gene Expression Omnibus (GEO) database (Barrett et al. 2011). In most of these experiments, there are one or a few probes per gene, and the goal is to determine what has changed in an experiment vs. the control setup; thus, the data consist of a spreadsheet of (conditions × genes), filled in with values that represent up- or downregulation of transcript levels. Affymetrix arrays, however, provide intensity measurements that can be used to gauge the absolute transcript abundance (Wodicka et al. 1997); Marbach et al. (2012) have assembled and normalized a data set of 537 Affymetrix arrays collected from the GEO.
Many, if not most, of the individual studies these data sets were compiled from were designed to answer specific questions and accordingly examine gene expression under specific conditions, so there is no assurance that the data are unbiased or comprehensive with regard to capturing individual expression programs. The “environmental stress response”, for example (Gasch et al. 2000), is seen very frequently. It is also possible that there are many condition-specific transcriptional programs that are not activated among these thousands of microarray data points; it has been argued that a complete functional characterization of the yeast genome will require a broader exploration of phenotypes under conditions and stresses that yeast would experience in the wild (Peña-Castillo and Hughes 2007; Hillenmeyer et al. 2008). Moreover, there is no guarantee that different laboratory protocols and different array types will yield compatible data. Nonetheless, much knowledge of the global regulation of yeast gene expression has been obtained by looking at these data sets, either individually or in aggregate. Here we describe several findings that are particularly relevant to mapping yeast transcriptional networks.
Many discrete “clusters” represent groups of coexpressed genes
A variety of approaches have been described for grouping genes on the basis of their expression patterns across multiple experiments (e.g., Eisen et al. 1998; Sherlock 2000; Segal et al. 2003). Two-dimensional (2-D) hierarchical agglomerative clustering (experiments × genes) remains a standard approach for gaining an overview of any given data structure. A characteristic appearance of 2-D clustering diagrams from yeast, provided one uses a sufficiently large number and variety of microarray experiments, is the appearance of boxes that correspond to genes that are coordinately induced or repressed over many experiments; randomly generated data do not display this type of pattern (Eisen et al. 1998). As a demonstration of this phenomenon, Figure 4 shows a clustering analysis of the entire Hibbs et al. data set. Major groups of coexpressed genes are apparent, and the insets show specific groups that are often observed and clearly correspond to specific functional classes of genes. It is typically assumed that coexpressed genes will also be coregulated, and indeed it is often possible to identify TF motifs that are enriched in the promoters of genes within these clusters (discussed below).
Figure 4.

Clustering of the entire SPELL data set, containing gene expression microarray data from diverse sources (4803 genes by 7186 experiments). Selected prominent clusters are labeled with a GO process enriched among the genes within the cluster and/or the experimental conditions (italics) enriched within the cluster. Gray represents missing data.
Changes in transcript levels as a result of TF perturbation
An obvious approach to identify targets of a TF is to use genetic perturbations to increase or decrease the activity of the TF, most typically by examining gene deletion and overexpression mutants. Hu et al. (2007) generated a uniform data set of expression profiles in yeast deletion mutants or other mutations (in YPD medium) for 269 known and putative TFs (including 159 that overlap with bona fide TFs in de Boer and Hughes 2011). Other studies have featured overexpression and other activating manipulations of TFs (e.g., Devaux et al. 2001; Hikkel et al. 2003; Chua et al. 2006). A more recent study focused on perturbation of other components of the yeast transcriptional apparatus, in particular the chromatin machinery (Lenstra et al. 2011).
The meaning of gene expression changes observed in these experiments is, to our knowledge, still a matter of discussion. Chua et al. (2006) focused on microarray analysis of overexpressed TFs after noting that, when yeast are grown in rich medium, there are generally few prominent expression changes in deletion mutants, relative to wild type. Even when overexpressed, many TFs appeared to yield few expression changes, and a relationship was observed in which the number of expression changes correlated with slowed growth (Chua et al. 2006). In contrast, Hu et al. (2007) reported significant gene expression changes from the vast majority of deletion mutants, using a previously described statistical measure that relates log-ratios to both biological “noise” (i.e., expression variations observed between pairs of wild-type cultures) and measurement error (Hughes et al. 2000b). A reprocessing of the Hu et al. data even reported a 10-fold increase in the number of expression changes (Reimand et al. 2010). It is important to note that, using the statistical test used by Hu et al., significant gene expression changes (both statistically and biologically) can be observed that have very low-magnitude expression changes (i.e., much less than twofold) (Hughes et al. 2000b), so low magnitude does not mean unimportant. However, it is also possible that at least some of the statistically significant changes observed by Hu et al. could relate to growth rate, strain construction, or secondary effects, rather than direct action of the TF. These possibilities become relevant when considering the low overlap between genes affected in the TF knockout and genes bound by the TF in ChIP experiments (see below). The Holstege laboratory has also assayed many yeast knockout strains and found fewer expression changes and a higher correspondence with ChIP-chip data, when there are changes (F. C. P. Holstege, personal communication). When it is published, a comparison of this data set to the Hu et al. data set may shed light on the biological significance of the observed gene expression changes in both studies.
One explanation for the relatively modest impact of most TF deletions on the yeast transcriptome is that the assays were not performed under conditions that activate the TF. There have been numerous studies demonstrating the requirement of known environmental response TFs for components of transcriptional programs to the same perturbations (e.g., Msn2/Msn4, Yap1, Gcn4, Ste12, Gal4, Crz1, and Zap1) (Gasch et al. 2000; Lyons et al. 2000; Roberts et al. 2000; Causton et al. 2001; Ideker et al. 2001; Natarajan et al. 2001; Yoshimoto et al. 2002). However, we are not aware of any systematic analysis demonstrating that deletion of a TF (or multiple TFs) has no impact on genome-wide expression in standard growth conditions, but does in alternative conditions. In the case of Gcn4, for example, the contrary was found; many genes are affected by deletion of Gcn4 even under standard laboratory growth (Natarajan et al. 2001). Some additional comparisons can be made by comparing different studies in the literature; differences in data processing between the studies can be controlled for to some degree by asking how well the mRNA abundance changes relate to motifs in the promoters of corresponding genes (de Boer and Hughes 2011). For example, in the aforementioned Crz1 experiment, which was performed under salt stress conditions, the Crz1 motif is enriched in the promoters of affected genes (Yoshimoto et al. 2002); in contrast, the Crz1 experiment from Hu et al. (2007) displays no significant relationship between gene expression levels and Crz1 sites in promoters (de Boer and Hughes 2011). This outcome suggests that condition-specific expression profiling of deletion mutants could represent a systematic approach to identifying bona fide target genes for uncharacterized TFs.
An obvious hurdle is to identify the appropriate conditions: to our knowledge, this approach has been applied almost exclusively to known metabolic or stress regulators, for which the appropriate conditions are known. One exception is the analysis of several TF deletions (Hap4, Usv1, Gis1, and Xbp1) under quiescent growth conditions (Aragon et al. 2008); these TFs were chosen only because the mRNAs encoding these TFs displayed differential abundance between quiescent and nonquiescent growth. The global gene expression changes in Hap4 and Xbp1 deletions under quiescent growth show a much more significant correspondence to promoter motifs for these TFs than do the expression changes for the same deletion mutants in standard growth (Hu et al. 2007). Thus, the choice of growth conditions need not be tailored specifically to the TF in question; perhaps educated guesses from large-scale studies regarding conditions in which the TF would be active are generally sufficient to obtain meaningful expression patterns from TF deletion mutants. Potential approaches could include mining phenotypic data for conditions in which growth is compromised by deletion of a TF (Hillenmeyer et al. 2008) or identifying conditions under which TF motif matches in promoters relate to expression patterns (Boorsma et al. 2008).
Expression of TFs correlates weakly with expression of their targets
Although TF activity is often regulated by post-translational mechanisms, the fact that overexpression of a TF often results in induction or repression of relevant targets (Chua et al. 2006) suggests that many TFs can be regulated simply by the abundance of the TF and thus, presumably, by the expression level of the TF. Is this a predominant mechanism outside of overexpression studies? Boorsma et al. (2008) found that, across ∼1000 microarray expression experiments, the correlation between a TF’s expression and that of its ChIP-based targets is typically between 0 and 0.25. Considering that at least some of this correlation can be accounted for by the fact that a subset of TFs autoregulate (see above), this finding supports the notion that TF expression accounts for only a minority of the regulation of TF activity in yeast.
Mapping the genetic determinants of gene expression (expression quantitative trait loci)
Another approach to connect trans-acting factors to gene expression is to use quantitative genetics. The association of genetic variants with expression levels is commonly known as expression quantitative trait locus mapping (“eQTL mapping”). A series of studies have conducted both genotyping and microarray expression analyses of dozens of haploid progeny from crosses between two different yeast strains that display differences in global gene expression (Brem et al. 2002; Yvert et al. 2003; Brem and Kruglyak 2005; Smith and Kruglyak 2008) and asked whether and how gene expression is related (“linked”) to genetic variation (Figure 5). Other studies have examined TF binding (by ChIP-seq) or the open chromatin state (using FAIRE) in haploid progeny (Zheng et al. 2010b; Lee et al. 2013) and allele-specific gene expression and nucleosome occupancy in diploid cells resulting from a cross between S. cerevisiae and S. paradoxus (Tirosh et al. 2009, 2010b; Emerson et al. 2010). These studies have the potential to identify the mechanisms controlling transcript levels because the genotype can be considered to be causative, although it may affect gene expression indirectly. Linkage analysis does not immediately identify the causative allele or the mechanism for the observed expression variation, but incorporation of other high-throughput data—such as protein–protein interactions, knowledge of TF binding sites, and knowledge of the effects that known regulators have on genome-wide expression—can facilitate the challenging process of mechanistic dissection (Lee et al. 2006; Choi and Kim 2008; Zhu et al. 2008).
Figure 5.

Pipeline for QTL mapping. Two strains of yeast are mated and recombinant haploid progeny are isolated. Expression traits are typically quantified for each recombinant strain in isolation. Strains are genotyped and variable loci are tested to see how well the quantified trait correlates with each parental genotype.
Highlights among the many findings of these studies (and subsequent reanalyses of the same data) include the following:
A large category of linkages corresponds to cis-effects on single genes. Many of these can be traced to variation in the binding sites of TFs (Chen et al. 2010; Zheng et al. 2010b).
Among trans-mapping effects, only a minority map to loci containing TFs. Whether this proportion is smaller or larger than expected varies among studies and may depend on the method of data analyses, i.e., whether individual gene expression traits are considered or whether all targets of a given TF are taken in aggregate (Yvert et al. 2003; Lee and Bussemaker 2010).
In crosses between strains of S. cerevisiae, only a minority of the variance in gene expression is explained, even for genes with high heritability, and there is evidence for frequent genetic interaction among multiple loci in the control of transcript levels (Brem and Kruglyak 2005), which could represent cooperative interactions among TFs and/or their effector proteins.
Computational analyses integrating the quantitative expression data with other information in a search for transfactors indicate that chromatin regulators appear to play a major part in the variation of gene expression (Lee et al. 2006; Choi and Kim 2008). At the same time, chromatin regulation appears to buffer interspecies variation in gene expression (Tirosh et al. 2010a).
Unconventional transcripts involved in gene regulation
Single-measurement per-gene analyses are dominant in expression data collections and integrated analyses of transcriptional networks described to date. However, oligonucleotide tiling microarrays (Shoemaker et al. 2001) and RNA-seq (Mortazavi et al. 2008; Nagalakshmi et al. 2008)—both now also commonly used in gene expression analysis—also have the capability to discover new transcripts and to infer processing of RNAs, such as identification of novel splice junctions. Both techniques have been used to characterize the yeast transcriptome de novo both in wild-type cells and in nuclease mutants, to accentuate detection of the transcripts they degrade (David et al. 2006; Nagalakshmi et al. 2008; Neil et al. 2009; Xu et al. 2009; van Dijk et al. 2011), identifying hundreds to thousands of novel nongenic transcripts, many if not most of which initiate from bidirectional promoters. The functional significance of the great majority of these transcripts is unknown, and it has been argued that they may primarily represent “transcriptional noise” (Struhl 2007). These studies are nonetheless important to the characterization of transcriptional networks. First, the production of these transcripts should ultimately be accounted for by models of transcriptional regulation. For example, recently published findings show that some bidirectionally transcribed noncoding (nc)RNAs in yeast are a consequence of the loss of looping interactions between a promoter and the terminator of a gene and that this looping confers directionality for transcription (Tan-Wong et al. 2012), suggesting that models should incorporate genome topology and physical interactions between loci. Second, some of these novel RNAs—and/or the action of transcribing them—function in regulation of transcription itself, by either direct transcriptional interference or modulation of chromatin (Martens et al. 2004; Camblong et al. 2007), and should therefore be accounted for in models of transcriptional regulation. Some examples of how noncoding transcripts can regulate gene expression in cis are shown in Figure 6. These mechanisms could explain some of the lack of correlation between TF binding and apparent function: an activating TF could drive mRNAs in some cases, but repressive ncRNAs in other cases; the action of an activating TF could also be compromised by local repressive ncRNAs.
Figure 6.

Examples of cis-regulation by ncRNAs. Blue arrows represent ORFs, green arrows represent actively transcribed transcripts, red arrows represent repressed transcripts, and dashed red arrows represent transcripts repressed by interference from transcription of the nearby RNA. Example genes are from (Martens et al. 2004; Bird et al. 2006; Hongay et al. 2006; Camblong et al. 2007; Houseley et al. 2008; Nishizawa et al. 2008; Bumgarner et al. 2009; Xu et al. 2011; van Werven et al. 2012).
Global Examination and Modeling of Transcriptional Networks
We now consider analysis of the overall organization of the yeast transcriptional regulatory machinery and how it produces observed expression patterns. We focus on analyses that are aimed at relating the data types described above, namely (a) the biochemical activities of individual proteins, mainly the sequence specificity of TFs, but also the influence of nucleosomes, chromatin proteins, RNA polymerase, etc; (b) the observed physical arrangement of these molecules on chromosomes in the cell; and (c) gene expression patterns, either at steady state or resulting from perturbation of the system. Derivation of a quantitative and testable model (or set of models) that relates and explains all of the observations represents a fundamental goal of mapping transcriptional regulatory networks (Figure 7). To our knowledge, such a model does not exist. Here, we focus on the three possible pairwise relations (a-b, b-c, a-c), although a realistic and comprehensive model would encompass and account for all three types of observations simultaneously. There is an extensive literature in this area and many possible ways to combine data sets, learning algorithms, and success criteria. A previous review provides an excellent summary and comparison of different approaches (Bussemaker et al. 2007).
Figure 7.
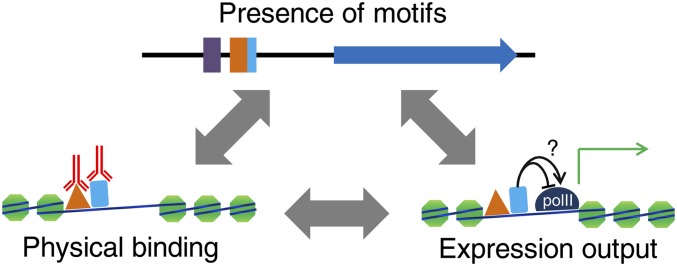
Illustration of three major interrelated maps of transcriptional regulation: motifs and other sequence features, physical binding or other measurements of in vivo activity at a promoter, and expression output.
Relating the sequence specificities of TFs to their observed physical arrangement on chromosomes: How do TFs find their targets?
A perennial question is, How are the binding sites of TFs specified in vivo (Kodadek 1993)? Figure 8 illustrates several mechanisms. The sequence preferences intrinsic to the TF are clearly utilized, since it is possible to derive motifs from ChIP-chip and ChIP-seq data. However, only a minority of motif matches in the genome are typically observed as being strongly occupied by the TF in vivo, even in cases when the TF is known to be active. Precise proportions will vary depending on the protein in question and the thresholds chosen. As an example, in a recent study of the TF Pho4, only 115 of the 843 consensus CACGTG sequences in the genome were bound by ChIP-seq analysis (Zhou and O’Shea 2011). What accounts for the lack of occupancy at perfectly good binding sites?
Figure 8.

Some of the factors that contribute to TF activity or nonactivity in a given promoter. To result in gene expression differences, a motif instance must be present, the TF must compete with nucleosomes and other TFs to bind the motif, and the binding of nearby cofactors is potentially required.
Nucleosomes and GRFs:
In yeast, the sequence preferences of nucleosomes provide a major part of the explanation. Nucleosomes are the most abundant DNA-binding molecule in the eukaryotic nucleus and have long been known to participate in transcriptional regulation in numerous ways, one of which is to present a barrier to TF binding (e.g., Almer et al. 1986). Yeast promoters have also long been known to harbor poly(A) tracts, which are refractory to nucleosome assembly and can strengthen the activity of adjacent motifs (Struhl 1985; Iyer and Struhl 1995). As a consequence, many yeast promoters have relatively low intrinsic nucleosome occupancy (Kaplan et al. 2009; Zhang et al. 2009) and also low observed nucleosome occupancy in vivo (Ercan and Simpson 2004; Lee et al. 2004; Yuan et al. 2005; Lee et al. 2007; Kaplan et al. 2009). The region upstream of the transcription start site is often referred to as the nucleosome-depleted region (NDR) or the nucleosome-free region (NFR). Globally, there is a strong tendency in vivo for yeast TFs to occupy motif matches that have low intrinsic preference for binding nucleosomes (Kaplan et al. 2009) and low nucleosome occupancy in vivo (Liu et al. 2006; Zhou and O’Shea 2011). In fact, in aggregate, these analyses strongly suggest that there are only a handful of yeast TFs that compete effectively with nucleosomes; most TFs may instead select binding sites from among sequences that are already depleted of nucleosomes.
The TFs that appear to be able to compete strongly and constitutively with nucleosomes on the basis of genomic data are all members of a class previously described as GRFs, which are characterized by their ability to define chromatin domains and potentiate the activity of nearby binding sites for other TFs, as well as the property that their binding sites are widespread among yeast promoters (Diffley 1992; Planta et al. 1995; Fourel et al. 2002). The binding sites for these factors are generally depleted of nucleosomes in vivo (Bernstein et al. 2004; Lee et al. 2007), and these nucleosome-free regions typically disappear upon mutation or depletion of the corresponding GRF (Badis et al. 2008; Hartley and Madhani 2009; Ganapathi et al. 2011), implying that these factors are themselves responsible for the formation of the nucleosome-depleted region in which they bind.
Rap1, Abf1, and Reb1 are the canonical GRFs, but Mcm1, Tbf1, Cbf1, and Rsc3 also display GRF-like properties (Diffley 1992; Fourel et al. 2002; Badis et al. 2008), with Tbf1 and Cbf1 appearing to play a more prominent role in some related yeast species (Tsankov et al. 2011). GRFs are multifunctional and essential for viability, consistent with their role in enabling the function of numerous other TFs and/or in chromatin opening at numerous promoters (Badis et al. 2008), presumably including those of other essential genes. The mechanisms by which they control chromatin and potentiate transcription are still a subject of active study, but, as with many other TFs, a unifying theme is interactions not only with the transcriptional apparatus but also with nucleosomes, chromatin, and chromatin modifiers. One clear example is Rsc3, which is a fungal-specific subunit of the chromatin-remodeling RSC complex (Cairns et al. 1996). Rsc3 positions a partially unwound nucleosome in the GAL1/GAL10 promoter (and evidently at other locations in the genome), facilitating Gal4 binding to its sites (Floer et al. 2010). The prevalence and functionality of this mechanism will require further examination. Rap1, which is named because it has activities as both a repressor and an activator protein, appears to have multiple effector functions. It can recruit (or help recruit) not only other TFs (Yu and Morse 1999), but also Sir-family histone deacetylase proteins (Kanoh and Ishikawa 2003) and the general transcription factor TFIID (Mencia et al. 2002; Garbett et al. 2007), and there is evidence that it recruits the histone acetylase Esa1 (Reid et al. 2000). The selection among these mechanisms appears to be at least partly dependent on the sequence and configuration of Rap1 binding sites (Piña et al. 2003).
GRFs are abundant proteins, a property that may confer ability to outcompete nucleosomes. The estimated numbers of proteins per cell for Reb1, Abf1, Rap1, Mcm1, and Rsc3 are 7510, 4820, 4390, 8970, and 1750; by comparison, the same numbers for metabolic regulators Gal4, Leu3, and Lys14 are 166, 125, and 450, and Gcn4 and Pho4 numbers were too low to estimate under standard growth conditions (Ghaemmaghami et al. 2003; Huh et al. 2003). Other TFs can display GRF-like properties, especially under activating conditions: numerous activators recruit nucleosome remodeling complexes such as Swi/Snf, and nucleosome displacement is a hallmark of gene activation (Workman 2006; Rando and Winston 2012). Presumably, most TFs are not GRFs because they are regulated and/or lack the high affinity for DNA or abundance needed to outcompete nucleosomes.
The positions of TF binding sites relative to or within nucleosomes can also play a role in target selection. Rap1, for example, binds nucleosomal DNA in vitro with a preference for sites near the nucleosome border in which the major groove is facing outward (i.e., exposed) (Rossetti et al. 2001); very similar behavior is observed in vivo, where Rap1 associates preferentially with the −1 nucleosome (i.e., the nucleosome just upstream of the NFR/NDR) (Koerber et al. 2009).
Cooperative vs. combinatorial TF–TF interactions:
Cooperative interactions among TFs also play a role in target determination. The strict biochemical definition of cooperativity requires that the binding of one TF aids in binding of another or that the function of one TF is aided or changed by the other. We note that the term cooperative has been used in the literature to describe cases that do not represent true cooperativity in the typical biochemical sense. For example, cooperative has been used to describe co-occurrence of motifs and/or binding events in promoters; these phenomena appear to be widespread (e.g., Wagner 1999; Harbison et al. 2004; Yang et al. 2010) (Figure 1B). Even GRFs are known to act in concert in some cases; for instance, the large NDR in the CLN2 promoter is created jointly by Reb1, Mcm1, and Rsc3 (Bai et al. 2011), but this does necessarily represent true cooperativity. We suggest that unless true biochemical cooperativity is demonstrated, it may be more appropriate to use terms such as co-occurring or coregulatory to avoid confusion.
When the sites are shown to be functional, and the regulators functionally related, the term combinatorial interaction also applies. Combinatorial control is a general term that describes cases in which multiple TFs regulate a promoter, using either the same or multiple binding sites, and can also encompass protein–protein interactions in which the same cofactors are recruited by multiple TFs. Combinatorial control need not encompass true biochemical cooperativity among TF binding sites, although it may be involved. Transcriptional control of sulfur metabolism in yeast has been a model of combinatorial control: the coactivator Met4 is recruited by any of three TFs (Met31, Met32, or Cbf1) and DNA-bound Met4-containing complexes are stabilized by another cofactor, Met28. Although Met4 and Met28 contain bZIP domains, until recently (see below) they were thought to be non-DNA binding. Analysis of the functions of these regulators, their interactions, and their target genes has been a challenge, due to the fact that the proteins regulate each other; however, it is clear that the different DNA-binding factors regulate partially overlapping subsets of genes corresponding to distinct sulfur metabolic pathways, as demonstrated in a recent series of articles containing extensive microarray analyses of perturbations of the sulfur regulatory system (Lee et al. 2010; Siggers et al. 2011; Carrillo et al. 2012; McIsaac et al. 2012; Petti et al. 2012). These articles also provide an excellent summary of the decades of research on the transcriptional regulation of sulfur metabolism in yeast and further examples of combinatorial control.
True TF cooperation in target specification can occur by several mechanisms (Courey 2001). Cooperative binding is perhaps most typically thought of as mediated by protein–protein interactions among TFs. The human IFNβ enhanceosome is a particularly well-studied example in which protein–protein interactions (including those among non-DNA-binding components) stabilize a multiprotein–DNA complex (Maniatis et al. 1998). Such interactions constrain the spacing and orientation of the binding sites of the individual subunits. In yeast, a well-characterized example is the 31-bp a-specific operator DNA, which contains an Mcm1 site flanked on either side by α2-binding sites (Smith and Johnson 1992; Tan and Richmond 1998). Very similar instances of this sequence are found in the promoters of STE6, BAR1, STE2, MFa1, and MFa2 (Johnson and Herskowitz 1985). There are also numerous examples of homodimeric binding sites; bZIP, bHLH, and SRF class TFs, for example, typically bind DNA as obligate homodimers, as do many of the GAL4 class proteins, typically with fixed spacing and orientation. These are typically considered to represent a single binding site; nonetheless, they are, formally, examples of cooperative binding.
Cooperation mediated by protein–protein interactions may also affect the sequence preferences of the proteins in the complex, as occurs with Drosophila Exd-Hox dimers (Slattery et al. 2011 and references therein). A parallel to Exd-Hox has also been described in yeast: the Cbf1-dependent sulfur metabolism genes are specified by an RYAAT DNA motif found adjacent to the Cbf1 sites, recognition of which requires the Met4 and Met28 subunit cofactors of the Met4-Met28-Cbf1 complex (Siggers et al. 2011). The Met4 and Met28 proteins contain bZIP domains, but they do not have any inherent sequence specificity either alone or in combination with each other; instead, they appear to require Cbf1 binding to an adjacent site to exhibit sequence-specific DNA-binding activity (Siggers et al. 2011).
TFs can also inherently cooperate with each other to compete with nucleosomes (Adams and Workman 1995; Polach and Widom 1996). This mechanism does not require any protein–protein interactions and would not be expected to constrain the spacing and orientation of the binding sites of the cooperating TFs. The cooperative interactions can be among multiple copies of the same protein or combinations of proteins. Due to the large number of possible combinations, such interactions may be difficult to detect de novo (see below).
The function of GRFs in enabling the activity of sites for other TFs (e.g., Brandl and Struhl 1990) also represents a cooperative interaction, since the impact of the two sites (that of the GRF and that of the activating TF) on transcription is different from that of the sum of either site alone. The same would be true of any pair of TFs in which one depends on the other for binding or activity (Struhl 1999); Swi5 and SBF (Swi4/Swi6) are one example, in which Swi5 transiently nucleates a chromatin environment that is permissive for SBF binding at the HO promoter (Cosma et al. 1999). As with the collaborative nucleosome competition mechanism mentioned previously, these types of interactions would not be expected to have rigid spacing and orientation constraints.
Cooperative interactions between two factors—even two copies of the same factor—can also lead to different transcriptional outputs. In the case of Pho4 regulating the PHO5 promoter, a nonnucleosomal binding site determines the threshold for activation, while adjacent sites within nucleosomal regions (which are remodeled by activated Pho4 binding to the primary nonnucleosomal site) determine the expression levels upon activation (Lam et al. 2008). The induction threshold and maximum expression levels of seven different phosphate-inducible genes vary in a way that is consistent with variation in the locations of Pho4 sites in the promoter, suggesting that the two parameters are tuned to optimize the dynamics of the response of individual promoters to the same TF.
There are also many instances in which structurally related TFs potentially compete to bind the same site. For example, Pho4 and Cbf1, two bHLH TFs that both bind classic E-box sequences (“CACGTG”), compete for binding to dozens of sites in the genome (Zhou and O’Shea 2011). Slightly different sequence specificities of these TFs (Cbf1 prefers a “T” base immediately 5′ to CACGTG) result in a bias in Pho4 binding to sites without a flanking T base.
To our knowledge, there has been no systematic and global study asking how precisely in vivo TF binding events can be explained by a combination of the intrinsic sequence preferences of the TF in question, other TFs, and nucleosomes, despite the fact that data exist for such a study and that it is well suited to statistical and machine-learning approaches. Wang et al. (2006) examined the improvement in predicting ChIP-chip data for a given TF, using its motif and either one or two additional motifs, using regression, and reported improvement of the prediction of in vivo binding sites for roughly a third of all TFs, particularly those for which the TF’s own motif is least informative for in vivo binding. This suggests that specific pairs or triplets of TFs might bind cooperatively, in the biochemical sense. However, no individual results were reported; it is possible that the second and third motifs were generally those of GRFs. In addition, nucleosomes were not considered in this study.
Relating TF binding events to gene expression patterns
Comparing the effects of targeted perturbation of each TF to binding data for the corresponding TF:
It is now well established that in organisms ranging from yeast to human there is often little apparent correspondence between the genes bound by a given TF in the promoter and the genes whose expression is affected by deletion or knockdown of the gene that encodes the TF (reviewed in MacQuarrie et al. 2011). Indeed, in yeast, the aforementioned Hu et al. (2007) study provides a striking example, comparing the effects on global gene expression of 276 TF deletion mutants to previously generated binding data for 188 of the same proteins (Harbison et al. 2004). Hu et al. concluded that only ∼3% of genes bound by the TFs were affected by the knockout. Likewise, only ∼3% of the genes with expression changes in the TF mutant were bound by the TF. A similar analysis of ChIP-chip data for 70 chromatin proteins (Venters et al. 2011) and expression data for deletion mutants in the same chromatin proteins (Lenstra et al. 2011) reached a similar conclusion (Lenstra and Holstege 2012). On average, only 2.5% of genes bound by the chromatin protein were affected by the deletion of that same protein, and of the genes whose expression was affected by deletion of a chromatin protein, only 24% were bound by that same protein (Lenstra and Holstege 2012). The higher proportion of expression changes associated with binding (relative to TFs) is partly explained by the much larger number of binding events than are typically found with TFs, often exceeding 1000 occupied promoters/genes for a typical chromatin protein (Venters et al. 2011). Nonetheless, the conclusion remains that only a small minority of bound promoters are affected by deletion of the gene encoding the bound protein.
How do we account for such observations? Gitter et al. (2009) reanalyzed the Hu et al. data after “cleaning steps”. Removing genes affected by many TFs (presumably stress responders that typically represent secondary effects) and retention only of genes with conserved promoter motifs (presumably to enrich for functional binding sites) increased the overlap only to 6.7%/4.5% (binding sites with expression changes/altered genes with binding sites). These steps should have reduced much of the noise in the data and seem to exclude false positives as a predominant explanation. Removing TFs with related protein sequences and/or shared protein–protein interactions—which could contribute to redundancy among TFs—further increased the overlap in the “cleaned” data to 13% (of ChIP targets with altered expression). Thus, there is some degree of functional redundancy, although it is also not the major source of discrepancy between TF binding and effect of the TF deletion. Consideration of multiple types of secondary effects, including transcriptional cascades, increased the proportion of ChIP targets with altered expression only to 22% (some of which is increase due to a larger number of tests), consistent with conclusions of Hu et al. that accounting for indirect effects (i.e., one TF regulating other TFs) resulted in little increase in overlap; moreover, Hu et al. (2007, p. 686) concluded that “during normal growth, regulation by a transcription factor is not propagated appreciably via extended cascades”, suggesting that examples such as the cell cycle, with its progressive waves of gene expression, may be the exception rather than the rule. We note that secondary effects could also include altering the expression of chromatin regulators, perturbing cell cycle dynamics, or other mechanisms, which were not considered in these studies.
An additional possibility for the low correspondence between TF binding and the effects of TF deletion is false negatives. There are often inconsistencies between different published ChIP-chip data sets for the same factor, and Hu et al. noted that substantially higher overlap may be obtained with data from studies that carefully examined the binding of a single TF. An additional type of “false negative” would be condition-specific regulation, as discussed above; Hu et al. tested the TFs in YPD (and a subset under heat-shock conditions). In fact, Figure 2 shows that the promoters bound by Thi2 and Gal4 are greatly affected by the appropriate environmental stimulus and correspond largely to genes that are known targets of these TFs (Engel et al. 2010). Hu et al. argued that that this possibility does not completely account for the discrepancy between binding and regulation; however, regression approaches described next, which would be able to capture context-dependent regulation, appear to suggest a much larger degree of correspondence between TF binding and gene regulation.
Learning the relationships between TF binding and gene regulation:
An independent approach to associate TF binding events with gene expression outputs is to map mathematically between the binding events and gene expression patterns collected over many conditions. This approach has the advantage that it can account for combinatorial regulation, as well as condition specificity. To our knowledge, this overall approach was first described by Gao at al., following upon work that had previously been reported for single TFs and/or using promoter motifs (Gao et al. 2004 and references therein). The essence of this approach is depicted in Figure 9; for each gene, there is a vector of expression changes measured under diverse conditions, and there is a vector representing promoter–TF occupancy data for each TF (under a single condition). The assumption is made that, in each expression experiment, there is a corresponding vector of TF activity levels and that the expression data for each gene are the sum of the products of each TF activity level multiplied by its promoter occupancy. These activity levels can be inferred by linear regression.
Figure 9.

Using regression to predict gene expression. (A) A trivial example where the relationship between expression level (Egx) and TF binding to promoters (Bgf) is found for a single experiment (x) and a single TF (f). Here, the model learns two parameters: the background expression level for all genes in the experiment (F0x) and the activity of the transcription factor in the given experiment (Ffx). (B) The generalized equation for multiple factors and multiple experiments. (C) Matrix representations of the generalized equation. Baseline expression is the same for all genes and so is represented as a single vector multiplied by a row vector of constants where c = 1/(no. genes).
One aspect of the resulting data structure is that one can score, for each TF, whether or not genes bound by a given TF have expression levels that track with the inferred activity level of that TF—a phenomenon that Gao et al. (2004) referred to as “coupling”, which can be thought of as a measure of whether that specific site is functional. Gao et al. found that binding data from 37 of the 113 TFs (33%) from Lee et al. (2002) had a significant relationship to gene expression patterns in a set of ∼750 microarray experiments available at the time. The “coupled” genes for any TF, relative to uncoupled genes, were much more likely to be enriched for specific Gene Ontology categories. Moreover, among these 37 TFs, on average 58% of significantly bound genes were classified as significantly coupled genes. Given the many caveats of the data at the time—the Lee et al. ChIP-chip data were collected only in YPD and the microarray experiments did not contain all possible environmental perturbations—this finding paints a relatively optimistic picture regarding the functionality of individual TF binding sites.
A caveat to the approach of Gao et al., and a challenge overall in mapping transcriptional regulatory networks, is that promoter activity may not be a simple linear sum of the activity of bound TFs. TFs can cooperate to activate genes, just as they cooperate in DNA binding; similar arguments presented above with regard to poor correlation between motif occurrence and in vivo binding, and with the challenge of computational learning of patterns, can be also be made with regard to gene activation or repression, even after a TF is bound. The aforementioned study analyzing Pho4 (Zhou and O’Shea 2011) provides an example in which multiple factors combine to generate specificity in regulation of transcription. Beyond the factors that influence the binding locations of Pho4, activation of transcription appears to involve a cooperative component between Pho4 and Pho2 (in the stringent sense described above) in almost all cases. A preferred spacing is also observed between the Pho4 and Pho2 binding sites. It is also possible that TFs can antagonize each other; for instance, Fkh1 and Fkh2 can act as “antiactivators” that specifically prevent activation by Swi5 via recruitment of the Rpd3(Large) histone deacetylase complex (Voth et al. 2007). As with DNA binding, TF activities can be influenced by proper positioning of their binding site relative to other factors, such as other TFs, nucleosomes, polymerase, and chromatin proteins (Iyer and Struhl 1995; Lieb et al. 2001; Zhou and O’Shea 2011; Sharon et al. 2012). In addition, in yeast, activation sites appear to be restricted by chromatin-mediated mechanisms to act within a few hundred bases of their binding site (Dobi and Winston 2007).
Relating DNA sequence directly to gene expression patterns
Despite the relative difficulty of predicting measured in vivo protein binding sites from DNA sequence, and relating in vivo TF binding sites to the effects of perturbing the same TFs, relating sequence elements directly to expression patterns (and vice versa) has been remarkably productive in yeast. One possible explanation for this fact is that the physical network of TF–DNA associations is sufficiently malleable that ChIP data collected under one growth condition can have little overlap with the occupancy under other conditions (Harbison et al. 2004). The DNA sequence, in contrast, is invariant. Another possible explanation is that the relative occupancy measurements made by techniques such as ChIP are not the most relevant parameter by which TFs translate sequence into expression output. The aforementioned Lickwar et al. (2012) study suggests that residence time may be the more relevant parameter, at least for some TFs.
Much of the initial work in mapping yeast transcriptional networks involved searching for motifs that are enriched in the promoters of coexpressed genes. There is an extensive literature on motif discovery, which has been reviewed and evaluated previously (Tompa et al. 2005). Almost certainly, the success of motif finding in yeast benefits from the fact that there are several large groups of tightly coregulated genes that recur in many gene expression studies (e.g., see Figure 4) and conform to the regulon model in that they are controlled by one or a few TFs. These groups include the ribosomal protein genes [controlled by Rap1, Fhl1, and Sfp1 (Shore and Nasmyth 1987; Lee et al. 2002; Marion et al. 2004)], the proteasome genes [controlled by Rpn4 (Mannhaupt et al. 1999)], amino acid biosynthesis genes [controlled by Gcn4 (Arndt and Fink 1986)], the ribosome biogenesis regulon described below, and several regulators of the cell cycle (Spellman et al. 1998) (see Chua et al. 2004 for a more complete listing). Thus, a relatively large degree of variance in expression data can be explained by a few motifs. It is also more straightforward to identify motifs when there are a large number of example promoters.
The Polymerase A and C (PAC) and RRPE motifs are a particularly striking example of both the success and the frustration that can be associated with motif discovery. The PAC motif was first found in 1991 by manual inspection of 10 promoters of genes encoding subunits of RNA Polymerases I and III (A and C) (Dequard-Chablat et al. 1991). Both the PAC element and the RRPE element, which occurs in many of the 100+ genes in this regulon, have subsequently been identified repeatedly in studies using diverse methods to identify motifs in the promoters of coregulated or functionally related genes (e.g., Tavazoie et al. 1999; Hughes et al. 2000a; Pilpel et al. 2001). An obvious next step in characterizing the motifs and the upstream regulatory pathway would be to identify the PAC- and RRPE-binding proteins. However, it was not until 2007 that an RRPE-binding protein—Stb3, a protein lacking a canonical DNA-binding domain—was identified (by brute-force screening of GST fusions of each yeast protein) and shown to regulate genes containing RRPE sites (Liko et al. 2007). Similarly, it was not until 2008 that two proteins that bind the PAC element were identified: the paralogs Ybl054w [Tod6/Pbf1 (Pbf1, “PAC-binding factor 1”)] and Yer088c (Dot6/Pbf2) were found to bind PAC sequences in the previously described PBM surveys (Badis et al. 2008; Zhu et al. 2009). To our knowledge, the signaling pathway that controls the PAC- and RRPE-binding proteins remains opaque; several signaling pathways are likely to be involved (see Chen and Powers 2006 and references therein). One conclusion from this enterprise might be that, while motif searching certainly provides a rapid and compelling entry point into mapping transcriptional networks, it can be surprisingly difficult to characterize the regulatory mechanisms that act through the motifs.
Mapping between regulatory sequence and gene expression output is a major contemporary problem in computational biology. For those outside the field, the overall challenge is described in some depth, and in an accessible manner, in Beer and Tavazoie (2004), who described the derivation of logical rules to predict membership of genes in expression clusters on the basis of motif matches. Other approaches that have been applied include decision trees, regression, and hidden Markov models, as well as incorporation of additional factors such as the expression levels of TFs (Pavlidis et al. 2001; Middendorf et al. 2004). The Bussemaker review (Bussemaker et al. 2007) provides an overview of the myriad approaches that have been described. Our impression is that most methods can effectively capture large trends in the data, but—nearly a decade after the Gao et al. (2004) study—it is still an open challenge for computational models to explain precisely the regulation of most genes and to account for the activities of the majority of TFs.
Modeling challenges and theoretical considerations
We are often asked what is the best way to model yeast transcriptional regulatory networks and what are the relative advantages of different approaches, and we are unable to answer the question except in vague terms. To our knowledge, the relative ability of different algorithms to accurately explain gene expression patterns has not been examined using the same data and the same evaluation criteria, except in specific cases where previous analyses have been revisited; for example, Yuan et al. (2007) reported that the relative positioning, spacing, and orientation of motif matches reported by Beer and Tavazoie were less important than originally claimed (although some combinations are obvious by eye, making it hard to believe that they are not functionally relevant; see Weirauch and Hughes 2010). A uniform framework for the evaluation of models would be extremely helpful. And, while there are theoretical grounds to expect complexity in gene regulation, it should also be considered that more parameters will generally result in a better fit to the data. Cross-validation—or, even better, validation on independent data sets—is essential to discriminate model improvement from overfitting. Overall, perhaps an even greater issue than what method to use is whether the data available contain enough information to comprehensively decipher regulatory mechanisms. If so, what features need to be incorporated? And if not, what data are still needed?
An important consideration is cooperativity is among TFs and whether it can be captured using current modeling approaches, using any amount of in vivo data. To our knowledge, analysis of large-scale studies has provided relatively little evidence supporting a major role for true cooperativity among TFs in gene regulation—i.e., that transcript levels are controlled by logical combinations of TF binding events, rather than a simpler aggregative or combinatorial effect. In fact, the Yuan et al. (2007) study mentioned above showed that microarray expression clusters can be predicted as effectively by motif matches for individual TFs, relative to multiple TFs. This is despite the fact that combinatorial control appears to be common, on the basis that binding sites for multiple TFs consistently appear together in the promoters of genes with related functions or coordinate expression (e.g., Pilpel et al. 2001; Beer and Tavazoie 2004). Intriguingly, the conclusions of Yuan et al. (2007) are similar to those of Gertz et al. (2009), who found that a thermodynamic model that is controlled only by equilibrium binding of proteins to DNA and to each other (and not effects mediated by nucleosomes) explained most, albeit not all, of the variation in expression of libraries of synthetic regulatory modules (i.e., random assemblies of three or four TFBSs upstream of a basal promoter and a reporter gene). Some type of cooperativity among TFs, however, was an important component of the Gertz models and could explain the functionality of weaker binding sites, which have been argued to be prevalent in the yeast genome (Tanay 2006).
One complicating issue in this type of endeavor is that most of the computational approaches (e.g., regression) work best by identifying recurring patterns that have statistical discriminatory power. As a rule of thumb in statistical inference, the number of examples (e.g., promoters) should be at least 10 times greater than the number of features (e.g., TF binding motifs or combinations of motifs) to learn rules (e.g., sites for TF-A and TF-B together allow cooperative binding). Otherwise, algorithms tend to “overfit”, i.e., identify noise patterns rather than genuine signals. If we assume that TFs are typically able to act cooperatively in many different configurations, then there might not be a sufficient number of promoters to learn all the functional combinations. Among 209 TFs, there would be 21,736 possible nonredundant pairs and much larger numbers of three- and four-way combinations. If there are multiple configurations that can specify the same regulatory output, and if they arise with equal frequency, then it is possible that each promoter could have a unique combination of TFs, making the nature of the interactions impossible to learn from ∼6000 native promoter sequences.
It therefore becomes important to consider how complicated we can expect eukaryotic gene regulation to be. An interesting observation made recently is that, in simulated thermodynamics-based evolutionary sampling for configurations of TF binding sites that yield a specific strength of regulation, more complicated arrangements of weak binding sites arise more frequently than a single strong site, even when a single strong site will suffice, simply because there are a larger number of possible configurations (He et al. 2011). This finding is reminiscent of earlier analyses indicating that low-affinity TF binding sites are often bound and may have widespread, albeit low-magnitude, impact on gene regulation (Tanay 2006). The fact that any two TFs may cooperate to exclude nucleosomes, as described above, also suggests that there may indeed be a very large number of possible functional combinations. Similarly, if there are multiple factors that can influence each of the different steps in transcription, then the number of possible functional configurations of TF binding sites that achieve the same regulatory output could be large.
These findings are consistent with the notion that eukaryotic TFs may generally have small binding sites to allow more rapid generation of new regulatory modules from random mutations; similar arguments can be made regarding the high frequency of turnover and shuffling of regulatory sequences in organisms ranging from yeast to vertebrates (Weirauch and Hughes 2010 and references therein). Since promoters presumably evolve independently of each other, it is conceivable that they are all functionally distinct, representing unique instances of distinct TF motif configurations (and nucleosome occupancy and positioning signals).
Altogether, several credible arguments can be raised that it may not be possible to learn all of the “rules” dictating gene expression outputs, using standard types of statistical analysis and existing data. Expansion of recent developments in the construction and analysis of synthetic regulatory element libraries may enable collection of training data needed to learn by example. An alternative approach, however, which can circumvent the need for recurring examples is to build biophysical/thermodynamic models that account for all of the relevant molecular events taking place on a segment of DNA, including nucleosome formation (Raveh-Sadka et al. 2009; Segal and Widom 2009; Wasson and Hartemink 2009). To our knowledge, this approach has been applied only to specific examples (e.g., individual promoters and their known regulatory factors), but related models have shown promise in predicting functional targets of TFs in human and Drosophila (He et al. 2009), and such approaches may represent the future of modeling regulatory networks, as they have the potential to address both the theoretical and the practical concerns described here.
Conclusion and Prospects
Mapping transcriptional networks is a pursuit that encompasses numerous objectives, but has the common goal of understanding the mechanisms by which genes are regulated as an ensemble. As described here, there are many effective ways to approach this problem in vivo, in vitro, and in silico. We now have high-confidence motifs for the majority of yeast TFs, high-confidence in vivo binding data for many of them, and a vast array of gene expression profiles. Moreover, computational frameworks to address major questions in the architecture and operation of transcriptional networks have been described. Analyses to date indicate that genome-scale data are, to a first approximation, consistent with our basic understanding of how gene regulation works, which was established largely from the analysis of single promoters and single TFs.
Despite the many advances—and the occasional perception among researchers outside the field (and, in our experience, funding agencies) that mapping yeast transcriptional regulatory networks is a task that has been completed—the functions of roughly half of all yeast TFs remain opaque, and it is difficult to explain what exactly is happening at most individual promoters. Where do we go now, to get a clearer and more comprehensive picture?
We see two major areas that could be advanced by extension of existing techniques and approaches. First, on the basis of the analyses highlighted here, it appears that the entire yeast transcriptional network has not really been physically mapped with completeness, depth, and accuracy. This may be due in large part to the fact that most of the data have been collected under standard laboratory growth conditions, under which most TFs are probably inactive. In fact, complete liquid medium and steady temperature are likely an unnatural growth condition for yeast. It would be invaluable to have ChIP-seq data (or some alternative) for all TFs for yeast grown in a variety of “stressful” conditions (which, for yeast, is more likely normal life) together with matched expression data from mutants in the same factors.
The second major area is understanding the determinants of TF targeting and gene expression—the mechanisms that dictate which potential TF binding sites are occupied in vivo, as well as the mechanisms that govern which in vivo binding sites affect transcription, and when, and how. This endeavor relies heavily on computational modeling, and while many approaches have been described, most were field tested prior to systematic analysis of TF sequence specificities by PBMs and MITOMI, before the importance of the intrinsic sequence preferences of nucleosomes was widely appreciated and before the use of tiling arrays and ChIP-seq became prevalent. Simply revisiting existing models with newer data may be illuminating, as might extending biophysical models of individual promoters to a whole-genome level.
Needless to say, we can also anticipate that new developments, techniques, and tools will change the landscape of this enterprise or at least introduce new information that should be incorporated. Given the numerous challenges outlined here, transcriptional networks will undoubtedly continue to be a subject of intense interest for decades to come.
Acknowledgments
We thank the University of Toronto, Canadian Institutes For Advanced Research, Canadian Institutes of Health Research, the Ontario Graduate Scholarship Program and the National Science and Engineering Research Council of Canada Postgraduate Scholarship Program for support.
Footnotes
Communicating editor: B. J. Andrews
Literature Cited
- Adams C. C., Workman J. L., 1995. Binding of disparate transcriptional activators to nucleosomal DNA is inherently cooperative. Mol. Cell. Biol. 15: 1405–1421. [DOI] [PMC free article] [PubMed] [Google Scholar]
- Almer A., Rudolph H., Hinnen A., Horz W., 1986. Removal of positioned nucleosomes from the yeast PHO5 promoter upon PHO5 induction releases additional upstream activating DNA elements. EMBO J. 5: 2689–2696. [DOI] [PMC free article] [PubMed] [Google Scholar]
- Aragon A. D., Rodriguez A. L., Meirelles O., Roy S., Davidson G. S., et al. , 2008. Characterization of differentiated quiescent and nonquiescent cells in yeast stationary-phase cultures. Mol. Biol. Cell 19: 1271–1280. [DOI] [PMC free article] [PubMed] [Google Scholar]
- Arndt K., Fink G. R., 1986. GCN4 protein, a positive transcription factor in yeast, binds general control promoters at all 5′ TGACTC 3′ sequences. Proc. Natl. Acad. Sci. USA 83: 8516–8520. [DOI] [PMC free article] [PubMed] [Google Scholar]
- Auerbach R. K., Euskirchen G., Rozowsky J., Lamarre-Vincent N., Moqtaderi Z., et al. , 2009. Mapping accessible chromatin regions using Sono-Seq. Proc. Natl. Acad. Sci. USA 106: 14926–14931. [DOI] [PMC free article] [PubMed] [Google Scholar]
- Badis G., Chan E. T., van Bakel H., Peña-Castillo L., Tillo D., et al. , 2008. A library of yeast transcription factor motifs reveals a widespread function for Rsc3 in targeting nucleosome exclusion at promoters. Mol. Cell 32: 878–887. [DOI] [PMC free article] [PubMed] [Google Scholar]
- Badis G., Berger M. F., Philippakis A. A., Talukder S., Gehrke A. R., et al. , 2009. Diversity and complexity in DNA recognition by transcription factors. Science 324: 1720–1723. [DOI] [PMC free article] [PubMed] [Google Scholar]
- Bai L., Ondracka A., Cross F. R., 2011. Multiple sequence-specific factors generate the nucleosome-depleted region on CLN2 promoter. Mol. Cell 42: 465–476. [DOI] [PMC free article] [PubMed] [Google Scholar]
- Balaji S., Iyer L. M., Aravind L., Babu M. M., 2006. Uncovering a hidden distributed architecture behind scale-free transcriptional regulatory networks. J. Mol. Biol. 360: 204–212. [DOI] [PubMed] [Google Scholar]
- Barrett T., Troup D. B., Wilhite S. E., Ledoux P., Evangelista C., et al. , 2011. NCBI GEO: archive for functional genomics data sets–10 years on. Nucleic Acids Res. 39: D1005–D1010. [DOI] [PMC free article] [PubMed] [Google Scholar]
- Barski A., Cuddapah S., Cui K., Roh T. Y., Schones D. E., et al. , 2007. High-resolution profiling of histone methylations in the human genome. Cell 129: 823–837. [DOI] [PubMed] [Google Scholar]
- Beer M. A., Tavazoie S., 2004. Predicting gene expression from sequence. Cell 117: 185–198. [DOI] [PubMed] [Google Scholar]
- Berbenetz N. M., Nislow C., Brown G. W., 2010. Diversity of eukaryotic DNA replication origins revealed by genome-wide analysis of chromatin structure. PLoS Genet. 6: e1001092. [DOI] [PMC free article] [PubMed] [Google Scholar]
- Berger M. F., Philippakis A. A., Qureshi A. M., He F. S., Estep P. W., 3rd, et al. , 2006. Compact, universal DNA microarrays to comprehensively determine transcription-factor binding site specificities. Nat. Biotechnol. 24: 1429–1435. [DOI] [PMC free article] [PubMed] [Google Scholar]
- Bernstein B. E., Liu C. L., Humphrey E. L., Perlstein E. O., Schreiber S. L., 2004. Global nucleosome occupancy in yeast. Genome Biol. 5: R62. [DOI] [PMC free article] [PubMed] [Google Scholar]
- Bird A. J., Gordon M., Eide D. J., Winge D. R., 2006. Repression of ADH1 and ADH3 during zinc deficiency by Zap1-induced intergenic RNA transcripts. EMBO J. 25: 5726–5734. [DOI] [PMC free article] [PubMed] [Google Scholar]
- Boorsma A., Lu X. J., Zakrzewska A., Klis F. M., Bussemaker H. J., 2008. Inferring condition-specific modulation of transcription factor activity in yeast through regulon-based analysis of genomewide expression. PLoS ONE 3: e3112. [DOI] [PMC free article] [PubMed] [Google Scholar]
- Borneman A. R., Leigh-Bell J. A., Yu H., Bertone P., Gerstein M., et al. , 2006. Target hub proteins serve as master regulators of development in yeast. Genes Dev. 20: 435–448. [DOI] [PMC free article] [PubMed] [Google Scholar]
- Boyer L. A., Langer M. R., Crowley K. A., Tan S., Denu J. M., et al. , 2002. Essential role for the SANT domain in the functioning of multiple chromatin remodeling enzymes. Mol. Cell 10: 935–942. [DOI] [PubMed] [Google Scholar]
- Brandl C. J., Struhl K., 1990. A nucleosome-positioning sequence is required for GCN4 to activate transcription in the absence of a TATA element. Mol. Cell. Biol. 10: 4256–4265. [DOI] [PMC free article] [PubMed] [Google Scholar]
- Bregman A., Avraham-Kelbert M., Barkai O., Duek L., Guterman A., et al. , 2011. Promoter elements regulate cytoplasmic mRNA decay. Cell 147: 1473–1483. [DOI] [PubMed] [Google Scholar]
- Brem R. B., Kruglyak L., 2005. The landscape of genetic complexity across 5,700 gene expression traits in yeast. Proc. Natl. Acad. Sci. USA 102: 1572–1577. [DOI] [PMC free article] [PubMed] [Google Scholar]
- Brem R. B., Yvert G., Clinton R., Kruglyak L., 2002. Genetic dissection of transcriptional regulation in budding yeast. Science 296: 752–755. [DOI] [PubMed] [Google Scholar]
- Bumgarner S. L., Dowell R. D., Grisafi P., Gifford D. K., Fink G. R., 2009. Toggle involving cis-interfering noncoding RNAs controls variegated gene expression in yeast. Proc. Natl. Acad. Sci. USA 106: 18321–18326. [DOI] [PMC free article] [PubMed] [Google Scholar]
- Bussemaker H. J., Foat B. C., Ward L. D., 2007. Predictive modeling of genome-wide mRNA expression: from modules to molecules. Annu. Rev. Biophys. Biomol. Struct. 36: 329–347. [DOI] [PubMed] [Google Scholar]
- Cairns B. R., Lorch Y., Li Y., Zhang M., Lacomis L., et al. , 1996. RSC, an essential, abundant chromatin-remodeling complex. Cell 87: 1249–1260. [DOI] [PubMed] [Google Scholar]
- Camblong J., Iglesias N., Fickentscher C., Dieppois G., Stutz F., 2007. Antisense RNA stabilization induces transcriptional gene silencing via histone deacetylation in S. cerevisiae. Cell 131: 706–717. [DOI] [PubMed] [Google Scholar]
- Carrillo E., Ben-Ari G., Wildenhain J., Tyers M., Grammentz D., et al. , 2012. Characterizing the roles of Met31 and Met32 in coordinating Met4-activated transcription in the absence of Met30. Mol. Biol. Cell 23: 1928–1942. [DOI] [PMC free article] [PubMed] [Google Scholar]
- Causton H. C., Ren B., Koh S. S., Harbison C. T., Kanin E., et al. , 2001. Remodeling of yeast genome expression in response to environmental changes. Mol. Biol. Cell 12: 323–337. [DOI] [PMC free article] [PubMed] [Google Scholar]
- Chen J. C., Powers T., 2006. Coordinate regulation of multiple and distinct biosynthetic pathways by TOR and PKA kinases in S. cerevisiae. Curr. Genet. 49: 281–293. [DOI] [PubMed] [Google Scholar]
- Chen X., Guo L., Fan Z., Jiang T., 2008. W-AlignACE: an improved Gibbs sampling algorithm based on more accurate position weight matrices learned from sequence and gene expression/ChIP-chip data. Bioinformatics 24: 1121–1128. [DOI] [PubMed] [Google Scholar]
- Chen K., van Nimwegen E., Rajewsky N., Siegal M. L., 2010. Correlating gene expression variation with cis-regulatory polymorphism in Saccharomyces cerevisiae. Genome Biol. Evol. 2: 697–707. [DOI] [PMC free article] [PubMed] [Google Scholar]
- Choi J. K., Kim Y. J., 2008. Epigenetic regulation and the variability of gene expression. Nat. Genet. 40: 141–147. [DOI] [PubMed] [Google Scholar]
- Chua G., Robinson M. D., Morris Q., Hughes T. R., 2004. Transcriptional networks: reverse-engineering gene regulation on a global scale. Curr. Opin. Microbiol. 7: 638–646. [DOI] [PubMed] [Google Scholar]
- Chua G., Morris Q. D., Sopko R., Robinson M. D., Ryan O., et al. , 2006. Identifying transcription factor functions and targets by phenotypic activation. Proc. Natl. Acad. Sci. USA 103: 12045–12050. [DOI] [PMC free article] [PubMed] [Google Scholar]
- Churchman L. S., Weissman J. S., 2011. Nascent transcript sequencing visualizes transcription at nucleotide resolution. Nature 469: 368–373. [DOI] [PMC free article] [PubMed] [Google Scholar]
- Cook J. G., Bardwell L., Kron S. J., Thorner J., 1996. Two novel targets of the MAP kinase Kss1 are negative regulators of invasive growth in the yeast Saccharomyces cerevisiae. Genes Dev. 10: 2831–2848. [DOI] [PubMed] [Google Scholar]
- Cosma M. P., Tanaka T., Nasmyth K., 1999. Ordered recruitment of transcription and chromatin remodeling factors to a cell cycle- and developmentally regulated promoter. Cell 97: 299–311. [DOI] [PubMed] [Google Scholar]
- Courey A. J., 2001. Cooperativity in transcriptional control. Curr. Biol. 11: R250–R252. [DOI] [PubMed] [Google Scholar]
- Cunningham T. S., Cooper T. G., 1993. The Saccharomyces cerevisiae DAL80 repressor protein binds to multiple copies of GATAA-containing sequences (URSGATA). J. Bacteriol. 175: 5851–5861. [DOI] [PMC free article] [PubMed] [Google Scholar]
- D’Alessio J. A., Wright K. J., Tjian R., 2009. Shifting players and paradigms in cell-specific transcription. Mol. Cell 36: 924–931. [DOI] [PMC free article] [PubMed] [Google Scholar]
- David L., Huber W., Granovskaia M., Toedling J., Palm C. J., et al. , 2006. A high-resolution map of transcription in the yeast genome. Proc. Natl. Acad. Sci. USA 103: 5320–5325. [DOI] [PMC free article] [PubMed] [Google Scholar]
- de Boer C. G., Hughes T. R., 2011. YeTFaSCo: a database of evaluated yeast transcription factor sequence specificities. Nucleic Acids Res. 40: D169–D179. [DOI] [PMC free article] [PubMed] [Google Scholar]
- Dequard-Chablat M., Riva M., Carles C., Sentenac A., 1991. RPC19, the gene for a subunit common to yeast RNA polymerases A (I) and C (III). J. Biol. Chem. 266: 15300–15307. [PubMed] [Google Scholar]
- Devaux F., Marc P., Bouchoux C., Delaveau T., Hikkel I., et al. , 2001. An artificial transcription activator mimics the genome-wide properties of the yeast Pdr1 transcription factor. EMBO Rep. 2: 493–498. [DOI] [PMC free article] [PubMed] [Google Scholar]
- Diffley J. F., 1992. Global regulators of chromosome function in yeast. Antonie van Leeuwenhoek 62: 25–33. [DOI] [PubMed] [Google Scholar]
- Dobi K. C., Winston F., 2007. Analysis of transcriptional activation at a distance in Saccharomyces cerevisiae. Mol. Cell. Biol. 27: 5575–5586. [DOI] [PMC free article] [PubMed] [Google Scholar]
- Dohm J. C., Lottaz C., Borodina T., Himmelbauer H., 2008. Substantial biases in ultra-short read data sets from high-throughput DNA sequencing. Nucleic Acids Res. 36: e105. [DOI] [PMC free article] [PubMed] [Google Scholar]
- Dolan J. W., Fields S., 1990. Overproduction of the yeast STE12 protein leads to constitutive transcriptional induction. Genes Dev. 4: 492–502. [DOI] [PubMed] [Google Scholar]
- Eisen M. B., Spellman P. T., Brown P. O., Botstein D., 1998. Cluster analysis and display of genome-wide expression patterns. Proc. Natl. Acad. Sci. USA 95: 14863–14868. [DOI] [PMC free article] [PubMed] [Google Scholar]
- Emerson J. J., Hsieh L. C., Sung H. M., Wang T. Y., Huang C. J., et al. , 2010. Natural selection on cis and trans regulation in yeasts. Genome Res. 20: 826–836. [DOI] [PMC free article] [PubMed] [Google Scholar]
- Engel S. R., Balakrishnan R., Binkley G., Christie K. R., Costanzo M. C., et al. , 2010. Saccharomyces Genome Database provides mutant phenotype data. Nucleic Acids Res. 38: D433–D436. [DOI] [PMC free article] [PubMed] [Google Scholar]
- Ercan S., Simpson R. T., 2004. Global chromatin structure of 45,000 base pairs of chromosome III in a- and alpha-cell yeast and during mating-type switching. Mol. Cell. Biol. 24: 10026–10035. [DOI] [PMC free article] [PubMed] [Google Scholar]
- Ernst J., Vainas O., Harbison C. T., Simon I., Bar-Joseph Z., 2007. Reconstructing dynamic regulatory maps. Mol. Syst. Biol. 3: 74. [DOI] [PMC free article] [PubMed] [Google Scholar]
- Floer M., Wang X., Prabhu V., Berrozpe G., Narayan S., et al. , 2010. A RSC/nucleosome complex determines chromatin architecture and facilitates activator binding. Cell 141: 407–418. [DOI] [PMC free article] [PubMed] [Google Scholar]
- Foat B. C., Tepper R. G., Bussemaker H. J., 2008. TransfactomeDB: a resource for exploring the nucleotide sequence specificity and condition-specific regulatory activity of trans-acting factors. Nucleic Acids Res. 36: D125–D131. [DOI] [PMC free article] [PubMed] [Google Scholar]
- Fordyce P. M., Gerber D., Tran D., Zheng J., Li H., et al. , 2010. De novo identification and biophysical characterization of transcription-factor binding sites with microfluidic affinity analysis. Nat. Biotechnol. 28: 970–975. [DOI] [PMC free article] [PubMed] [Google Scholar]
- Fourel G., Miyake T., Defossez P. A., Li R., Gilson E., 2002. General regulatory factors (GRFs) as genome partitioners. J. Biol. Chem. 277: 41736–41743. [DOI] [PubMed] [Google Scholar]
- Frietze S., Farnham P. J., 2011. Transcription factor effector domains. Subcell. Biochem. 52: 261–277. [DOI] [PMC free article] [PubMed] [Google Scholar]
- Fulton D. L., Sundararajan S., Badis G., Hughes T. R., Wasserman W. W., et al. , 2009. TFCat: the curated catalog of mouse and human transcription factors. Genome Biol. 10: R29. [DOI] [PMC free article] [PubMed] [Google Scholar]
- Ganapathi M., Palumbo M. J., Ansari S. A., He Q., Tsui K., et al. , 2011. Extensive role of the general regulatory factors, Abf1 and Rap1, in determining genome-wide chromatin structure in budding yeast. Nucleic Acids Res. 39: 2032–2044. [DOI] [PMC free article] [PubMed] [Google Scholar]
- Gao F., Foat B. C., Bussemaker H. J., 2004. Defining transcriptional networks through integrative modeling of mRNA expression and transcription factor binding data. BMC Bioinformatics 5: 31. [DOI] [PMC free article] [PubMed] [Google Scholar]
- Garbett K. A., Tripathi M. K., Cencki B., Layer J. H., Weil P. A., 2007. Yeast TFIID serves as a coactivator for Rap1p by direct protein-protein interaction. Mol. Cell. Biol. 27: 297–311. [DOI] [PMC free article] [PubMed] [Google Scholar]
- Gasch A. P., Spellman P. T., Kao C. M., Carmel-Harel O., Eisen M. B., et al. , 2000. Genomic expression programs in the response of yeast cells to environmental changes. Mol. Biol. Cell 11: 4241–4257. [DOI] [PMC free article] [PubMed] [Google Scholar]
- Gerstein M. B., Lu Z. J., Van Nostrand E. L., Cheng C., Arshinoff B. I., et al. , 2010. Integrative analysis of the Caenorhabditis elegans genome by the modENCODE project. Science 330: 1775–1787. [DOI] [PMC free article] [PubMed] [Google Scholar]
- Gertz J., Siggia E. D., Cohen B. A., 2009. Analysis of combinatorial cis-regulation in synthetic and genomic promoters. Nature 457: 215–218. [DOI] [PMC free article] [PubMed] [Google Scholar]
- Ghaemmaghami S., Huh W. K., Bower K., Howson R. W., Belle A., et al. , 2003. Global analysis of protein expression in yeast. Nature 425: 737–741. [DOI] [PubMed] [Google Scholar]
- Gitter A., Siegfried Z., Klutstein M., Fornes O., Oliva B., et al. , 2009. Backup in gene regulatory networks explains differences between binding and knockout results. Mol. Syst. Biol. 5: 276. [DOI] [PMC free article] [PubMed] [Google Scholar]
- Goffeau A., Barrell B. G., Bussey H., Davis R. W., Dujon B., et al. , 1996. Life with 6000 genes. Science 274: 546, 563–567. [DOI] [PubMed] [Google Scholar]
- Gordan R., Hartemink A. J., Bulyk M. L., 2009. Distinguishing direct vs. indirect transcription factor-DNA interactions. Genome Res. 19: 2090–2100. [DOI] [PMC free article] [PubMed] [Google Scholar]
- Gordan R., Murphy K. F., McCord R. P., Zhu C., Vedenko A., et al. , 2011. Curated collection of yeast transcription factor DNA binding specificity data reveals novel structural and gene regulatory insights. Genome Biol. 12: R125. [DOI] [PMC free article] [PubMed] [Google Scholar]
- Gottesman S., 1984. Bacterial regulation: global regulatory networks. Annu. Rev. Genet. 18: 415–441. [DOI] [PubMed] [Google Scholar]
- Grigull J., Mnaimneh S., Pootoolal J., Robinson M. D., Hughes T. R., 2004. Genome-wide analysis of mRNA stability using transcription inhibitors and microarrays reveals posttranscriptional control of ribosome biogenesis factors. Mol. Cell. Biol. 24: 5534–5547. [DOI] [PMC free article] [PubMed] [Google Scholar]
- Hahn S., Young E. T., 2011. Transcriptional regulation in Saccharomyces cerevisiae: transcription factor regulation and function, mechanisms of initiation, and roles of activators and coactivators. Genetics 189: 705–736. [DOI] [PMC free article] [PubMed] [Google Scholar]
- Hall D. A., Zhu H., Zhu X., Royce T., Gerstein M., et al. , 2004. Regulation of gene expression by a metabolic enzyme. Science 306: 482–484. [DOI] [PubMed] [Google Scholar]
- Harbison C. T., Gordon D. B., Lee T. I., Rinaldi N. J., Macisaac K. D., et al. , 2004. Transcriptional regulatory code of a eukaryotic genome. Nature 431: 99–104. [DOI] [PMC free article] [PubMed] [Google Scholar]
- Hartley P. D., Madhani H. D., 2009. Mechanisms that specify promoter nucleosome location and identity. Cell 137: 445–458. [DOI] [PMC free article] [PubMed] [Google Scholar]
- He X., Chen C. C., Hong F., Fang F., Sinha S., et al. , 2009. A biophysical model for analysis of transcription factor interaction and binding site arrangement from genome-wide binding data. PLoS ONE 4: e8155. [DOI] [PMC free article] [PubMed] [Google Scholar]
- He X., Duque T. S., Sinha S., 2012. Evolutionary origins of transcription factor binding site clusters. Mol. Biol. Evol. 29: 1059–1070. [DOI] [PMC free article] [PubMed] [Google Scholar]
- Henikoff J. G., Belsky J. A., Krassovsky K., MacAlpine D. M., Henikoff S., 2011. Epigenome characterization at single base-pair resolution. Proc. Natl. Acad. Sci. USA 108: 18318–18323. [DOI] [PMC free article] [PubMed] [Google Scholar]
- Hesselberth J. R., Chen X., Zhang Z., Sabo P. J., Sandstrom R., et al. , 2009. Global mapping of protein-DNA interactions in vivo by digital genomic footprinting. Nat. Methods 6: 283–289. [DOI] [PMC free article] [PubMed] [Google Scholar]
- Hibbs M. A., Hess D. C., Myers C. L., Huttenhower C., Li K., et al. , 2007. Exploring the functional landscape of gene expression: directed search of large microarray compendia. Bioinformatics 23: 2692–2699. [DOI] [PubMed] [Google Scholar]
- Hikkel I., Lucau-Danila A., Delaveau T., Marc P., Devaux F., et al. , 2003. A general strategy to uncover transcription factor properties identifies a new regulator of drug resistance in yeast. J. Biol. Chem. 278: 11427–11432. [DOI] [PubMed] [Google Scholar]
- Hillenmeyer M. E., Fung E., Wildenhain J., Pierce S. E., Hoon S., et al. , 2008. The chemical genomic portrait of yeast: uncovering a phenotype for all genes. Science 320: 362–365. [DOI] [PMC free article] [PubMed] [Google Scholar]
- Hogan D. J., Riordan D. P., Gerber A. P., Herschlag D., Brown P. O., 2008. Diverse RNA-binding proteins interact with functionally related sets of RNAs, suggesting an extensive regulatory system. PLoS Biol. 6: e255. [DOI] [PMC free article] [PubMed] [Google Scholar]
- Hongay C. F., Grisafi P. L., Galitski T., Fink G. R., 2006. Antisense transcription controls cell fate in Saccharomyces cerevisiae. Cell 127: 735–745. [DOI] [PubMed] [Google Scholar]
- Houseley J., Rubbi L., Grunstein M., Tollervey D., Vogelauer M., 2008. A ncRNA modulates histone modification and mRNA induction in the yeast GAL gene cluster. Mol. Cell 32: 685–695. [DOI] [PMC free article] [PubMed] [Google Scholar]
- Hu Z., Killion P. J., Iyer V. R., 2007. Genetic reconstruction of a functional transcriptional regulatory network. Nat. Genet. 39: 683–687. [DOI] [PubMed] [Google Scholar]
- Hughes J. D., Estep P. W., Tavazoie S., Church G. M., 2000a Computational identification of cis-regulatory elements associated with groups of functionally related genes in Saccharomyces cerevisiae. J. Mol. Biol. 296: 1205–1214. [DOI] [PubMed] [Google Scholar]
- Hughes T. R., Marton M. J., Jones A. R., Roberts C. J., Stoughton R., et al. , 2000b Functional discovery via a compendium of expression profiles. Cell 102: 109–126. [DOI] [PubMed] [Google Scholar]
- Huh W. K., Falvo J. V., Gerke L. C., Carroll A. S., Howson R. W., et al. , 2003. Global analysis of protein localization in budding yeast. Nature 425: 686–691. [DOI] [PubMed] [Google Scholar]
- Ideker T., Thorsson V., Ranish J. A., Christmas R., Buhler J., et al. , 2001. Integrated genomic and proteomic analyses of a systematically perturbed metabolic network. Science 292: 929–934. [DOI] [PubMed] [Google Scholar]
- Iyer V., Struhl K., 1995. Poly(dA:dT), a ubiquitous promoter element that stimulates transcription via its intrinsic DNA structure. EMBO J. 14: 2570–2579. [DOI] [PMC free article] [PubMed] [Google Scholar]
- Iyer V. R., Horak C. E., Scafe C. S., Botstein D., Snyder M., et al. , 2001. Genomic binding sites of the yeast cell-cycle transcription factors SBF and MBF. Nature 409: 533–538. [DOI] [PubMed] [Google Scholar]
- Johnson A. D., Herskowitz I., 1985. A repressor (MAT alpha 2 Product) and its operator control expression of a set of cell type specific genes in yeast. Cell 42: 237–247. [DOI] [PubMed] [Google Scholar]
- Jolma A., Taipale J., 2011. Methods for analysis of transcription factor DNA-binding specificity in vitro. Subcell. Biochem. 52: 155–173. [DOI] [PubMed] [Google Scholar]
- Jolma A., Kivioja T., Toivonen J., Cheng L., Wei G., et al. , 2010. Multiplexed massively parallel SELEX for characterization of human transcription factor binding specificities. Genome Res. 20: 861–873. [DOI] [PMC free article] [PubMed] [Google Scholar]
- Kanoh J., Ishikawa F., 2003. Composition and conservation of the telomeric complex. Cell. Mol. Life Sci. 60: 2295–2302. [DOI] [PMC free article] [PubMed] [Google Scholar]
- Kaplan N., Moore I. K., Fondufe-Mittendorf Y., Gossett A. J., Tillo D., et al. , 2009. The DNA-encoded nucleosome organization of a eukaryotic genome. Nature 458: 362–366. [DOI] [PMC free article] [PubMed] [Google Scholar]
- Keene J. D., 2007. RNA regulons: coordination of post-transcriptional events. Nat. Rev. Genet. 8: 533–543. [DOI] [PubMed] [Google Scholar]
- Kim H. D., Shay T., O’Shea E. K., Regev A., 2009. Transcriptional regulatory circuits: predicting numbers from alphabets. Science 325: 429–432. [DOI] [PMC free article] [PubMed] [Google Scholar]
- Kodadek T., 1993. How does the GAL4 transcription factor recognize the appropriate DNA binding sites in vivo? Cell. Mol. Biol. Res. 39: 355–360. [PubMed] [Google Scholar]
- Koerber R. T., Rhee H. S., Jiang C., Pugh B. F., 2009. Interaction of transcriptional regulators with specific nucleosomes across the Saccharomyces genome. Mol. Cell 35: 889–902. [DOI] [PMC free article] [PubMed] [Google Scholar]
- Kundaje A., Xin X., Lan C., Lianoglou S., Zhou M., et al. , 2008. A predictive model of the oxygen and heme regulatory network in yeast. PLOS Comput. Biol. 4: e1000224. [DOI] [PMC free article] [PubMed] [Google Scholar]
- Lam F. H., Steger D. J., O’Shea E. K., 2008. Chromatin decouples promoter threshold from dynamic range. Nature 453: 246–250. [DOI] [PMC free article] [PubMed] [Google Scholar]
- Lee C. K., Shibata Y., Rao B., Strahl B. D., Lieb J. D., 2004. Evidence for nucleosome depletion at active regulatory regions genome-wide. Nat. Genet. 36: 900–905. [DOI] [PubMed] [Google Scholar]
- Lee E., Bussemaker H. J., 2010. Identifying the genetic determinants of transcription factor activity. Mol. Syst. Biol. 6: 412. [DOI] [PMC free article] [PubMed] [Google Scholar]
- Lee K., Kim S. C., Jung I., Kim K., Seo J., et al. , 2013. Genetic landscape of open chromatin in yeast. PLoS Genet. 9: e1003229. [DOI] [PMC free article] [PubMed] [Google Scholar]
- Lee S. I., Pe’er D., Dudley A. M., Church G. M., Koller D., 2006. Identifying regulatory mechanisms using individual variation reveals key role for chromatin modification. Proc. Natl. Acad. Sci. USA 103: 14062–14067. [DOI] [PMC free article] [PubMed] [Google Scholar]
- Lee T. A., Jorgensen P., Bognar A. L., Peyraud C., Thomas D., et al. , 2010. Dissection of combinatorial control by the Met4 transcriptional complex. Mol. Biol. Cell 21: 456–469. [DOI] [PMC free article] [PubMed] [Google Scholar]
- Lee T. I., Rinaldi N. J., Robert F., Odom D. T., Bar-Joseph Z., et al. , 2002. Transcriptional regulatory networks in Saccharomyces cerevisiae. Science 298: 799–804. [DOI] [PubMed] [Google Scholar]
- Lee W., Tillo D., Bray N., Morse R. H., Davis R. W., et al. , 2007. A high-resolution atlas of nucleosome occupancy in yeast. Nat. Genet. 39: 1235–1244. [DOI] [PubMed] [Google Scholar]
- Lenstra T. L., Holstege F. C., 2012. The discrepancy between chromatin factor location and effect. Nucleus 3: 213–219. [DOI] [PMC free article] [PubMed] [Google Scholar]
- Lenstra T. L., Benschop J. J., Kim T., Schulze J. M., Brabers N. A., et al. , 2011. The specificity and topology of chromatin interaction pathways in yeast. Mol. Cell 42: 536–549. [DOI] [PMC free article] [PubMed] [Google Scholar]
- Li X. Y., Thomas S., Sabo P. J., Eisen M. B., Stamatoyannopoulos J. A., et al. , 2011. The role of chromatin accessibility in directing the widespread, overlapping patterns of Drosophila transcription factor binding. Genome Biol. 12: R34. [DOI] [PMC free article] [PubMed] [Google Scholar]
- Lickwar C. R., Mueller F., Hanlon S. E., McNally J. G., Lieb J. D., 2012. Genome-wide protein-DNA binding dynamics suggest a molecular clutch for transcription factor function. Nature 484: 251–255. [DOI] [PMC free article] [PubMed] [Google Scholar]
- Lieb J. D., Liu X., Botstein D., Brown P. O., 2001. Promoter-specific binding of Rap1 revealed by genome-wide maps of protein-DNA association. Nat. Genet. 28: 327–334. [DOI] [PubMed] [Google Scholar]
- Liko D., Slattery M. G., Heideman W., 2007. Stb3 binds to ribosomal RNA processing element motifs that control transcriptional responses to growth in Saccharomyces cerevisiae. J. Biol. Chem. 282: 26623–26628. [DOI] [PubMed] [Google Scholar]
- Liu X., Lee C. K., Granek J. A., Clarke N. D., Lieb J. D., 2006. Whole-genome comparison of Leu3 binding in vitro and in vivo reveals the importance of nucleosome occupancy in target site selection. Genome Res. 16: 1517–1528. [DOI] [PMC free article] [PubMed] [Google Scholar]
- Luscombe N. M., Babu M. M., Yu H., Snyder M., Teichmann S. A., et al. , 2004. Genomic analysis of regulatory network dynamics reveals large topological changes. Nature 431: 308–312. [DOI] [PubMed] [Google Scholar]
- Lyons T. J., Gasch A. P., Gaither L. A., Botstein D., Brown P. O., et al. , 2000. Genome-wide characterization of the Zap1p zinc-responsive regulon in yeast. Proc. Natl. Acad. Sci. USA 97: 7957–7962. [DOI] [PMC free article] [PubMed] [Google Scholar]
- Maas W. K., Clark A. J., 1964. Studies on the mechanism of repression of arginine biosynthesis in Escherichia coli. II. Dominance of repressibility in diploids. J. Mol. Biol. 8: 365–370. [DOI] [PubMed] [Google Scholar]
- MacIsaac K. D., Wang T., Gordon D. B., Gifford D. K., Stormo G. D., et al. , 2006. An improved map of conserved regulatory sites for Saccharomyces cerevisiae. BMC Bioinformatics 7: 113. [DOI] [PMC free article] [PubMed] [Google Scholar]
- MacQuarrie K. L., Fong A. P., Morse R. H., Tapscott S. J., 2011. Genome-wide transcription factor binding: beyond direct target regulation. Trends Genet. 27: 141–148. [DOI] [PMC free article] [PubMed] [Google Scholar]
- Maerkl S. J., Quake S. R., 2007. A systems approach to measuring the binding energy landscapes of transcription factors. Science 315: 233–237. [DOI] [PubMed] [Google Scholar]
- Mak H. C., Pillus L., Ideker T., 2009. Dynamic reprogramming of transcription factors to and from the subtelomere. Genome Res. 19: 1014–1025. [DOI] [PMC free article] [PubMed] [Google Scholar]
- Maniatis T., Falvo J. V., Kim T. H., Kim T. K., Lin C. H., et al. , 1998. Structure and function of the interferon-beta enhanceosome. Cold Spring Harb. Symp. Quant. Biol. 63: 609–620. [DOI] [PubMed] [Google Scholar]
- Mannhaupt G., Schnall R., Karpov V., Vetter I., Feldmann H., 1999. Rpn4p acts as a transcription factor by binding to PACE, a nonamer box found upstream of 26S proteasomal and other genes in yeast. FEBS Lett. 450: 27–34. [DOI] [PubMed] [Google Scholar]
- Marbach D., Costello J. C., Kuffner R., Vega N. M., Prill R. J., et al. , 2012. Wisdom of crowds for robust gene network inference. Nat. Methods 9: 796–804. [DOI] [PMC free article] [PubMed] [Google Scholar]
- Marion R. M., Regev A., Segal E., Barash Y., Koller D., et al. , 2004. Sfp1 is a stress- and nutrient-sensitive regulator of ribosomal protein gene expression. Proc. Natl. Acad. Sci. USA 101: 14315–14322. [DOI] [PMC free article] [PubMed] [Google Scholar]
- Martens J. A., Laprade L., Winston F., 2004. Intergenic transcription is required to repress the Saccharomyces cerevisiae SER3 gene. Nature 429: 571–574. [DOI] [PubMed] [Google Scholar]
- McIsaac R. S., Petti A. A., Bussemaker H. J., Botstein D., 2012. Perturbation-based analysis and modeling of combinatorial regulation in the yeast sulfur assimilation pathway. Mol. Biol. Cell 23: 2993–3007. [DOI] [PMC free article] [PubMed] [Google Scholar]
- Mencia M., Moqtaderi Z., Geisberg J. V., Kuras L., Struhl K., 2002. Activator-specific recruitment of TFIID and regulation of ribosomal protein genes in yeast. Mol. Cell 9: 823–833. [DOI] [PubMed] [Google Scholar]
- Meng X., Brodsky M. H., Wolfe S. A., 2005. A bacterial one-hybrid system for determining the DNA-binding specificity of transcription factors. Nat. Biotechnol. 23: 988–994. [DOI] [PMC free article] [PubMed] [Google Scholar]
- Michoel T., Joshi A., Nachtergaele B., Van de Peer Y., 2011. Enrichment and aggregation of topological motifs are independent organizational principles of integrated interaction networks. Mol. Biosyst. 7: 2769–2778. [DOI] [PubMed] [Google Scholar]
- Middendorf M., Kundaje A., Wiggins C., Freund Y., Leslie C., 2004. Predicting genetic regulatory response using classification. Bioinformatics 20(Suppl 1): i232–i240. [DOI] [PubMed] [Google Scholar]
- Moorman C., Sun L. V., Wang J., de Wit E., Talhout W., et al. , 2006. Hotspots of transcription factor colocalization in the genome of Drosophila melanogaster. Proc. Natl. Acad. Sci. USA 103: 12027–12032. [DOI] [PMC free article] [PubMed] [Google Scholar]
- Morozov A. V., Siggia E. D., 2007. Connecting protein structure with predictions of regulatory sites. Proc. Natl. Acad. Sci. USA 104: 7068–7073. [DOI] [PMC free article] [PubMed] [Google Scholar]
- Mortazavi A., Williams B. A., McCue K., Schaeffer L., Wold B., 2008. Mapping and quantifying mammalian transcriptomes by RNA-Seq. Nat. Methods 5: 621–628. [DOI] [PubMed] [Google Scholar]
- Nagalakshmi U., Wang Z., Waern K., Shou C., Raha D., et al. , 2008. The transcriptional landscape of the yeast genome defined by RNA sequencing. Science 320: 1344–1349. [DOI] [PMC free article] [PubMed] [Google Scholar]
- Natarajan K., Meyer M. R., Jackson B. M., Slade D., Roberts C., et al. , 2001. Transcriptional profiling shows that Gcn4p is a master regulator of gene expression during amino acid starvation in yeast. Mol. Cell. Biol. 21: 4347–4368. [DOI] [PMC free article] [PubMed] [Google Scholar]
- Neil H., Malabat C., d’Aubenton-Carafa Y., Xu Z., Steinmetz L. M., et al. , 2009. Widespread bidirectional promoters are the major source of cryptic transcripts in yeast. Nature 457: 1038–1042. [DOI] [PubMed] [Google Scholar]
- Nishizawa M., Komai T., Katou Y., Shirahige K., Ito T., et al. , 2008. Nutrient-regulated antisense and intragenic RNAs modulate a signal transduction pathway in yeast. PLoS Biol. 6: 2817–2830. [DOI] [PMC free article] [PubMed] [Google Scholar]
- Nutiu R., Friedman R. C., Luo S., Khrebtukova I., Silva D., et al. , 2011. Direct measurement of DNA affinity landscapes on a high-throughput sequencing instrument. Nat. Biotechnol. 29: 659–664. [DOI] [PMC free article] [PubMed] [Google Scholar]
- Odom D. T., 2011. Identification of transcription factor-DNA interactions in vivo. Subcell. Biochem. 52: 175–191. [DOI] [PMC free article] [PubMed] [Google Scholar]
- Pachkov M., Erb I., Molina N., van Nimwegen E., 2007. SwissRegulon: a database of genome-wide annotations of regulatory sites. Nucleic Acids Res. 35: D127–D131. [DOI] [PMC free article] [PubMed] [Google Scholar]
- Patsialou A., Wilsker D., Moran E., 2005. DNA-binding properties of ARID family proteins. Nucleic Acids Res. 33: 66–80. [DOI] [PMC free article] [PubMed] [Google Scholar]
- Pavlidis P., Furey T. S., Liberto M., Haussler D., Grundy W. N., 2001. Promoter region-based classification of genes. Pac. Symp. Biocomput., 151–163. [DOI] [PubMed] [Google Scholar]
- Peña-Castillo L., Hughes T. R., 2007. Why are there still over 1000 uncharacterized yeast genes? Genetics 176: 7–14. [DOI] [PMC free article] [PubMed] [Google Scholar]
- Petti A. A., McIsaac R. S., Ho-Shing O., Bussemaker H. J., Botstein D., 2012. Combinatorial control of diverse metabolic and physiological functions by transcriptional regulators of the yeast sulfur assimilation pathway. Mol. Biol. Cell 23: 3008–3024. [DOI] [PMC free article] [PubMed] [Google Scholar]
- Pilpel Y., Sudarsanam P., Church G. M., 2001. Identifying regulatory networks by combinatorial analysis of promoter elements. Nat. Genet. 29: 153–159. [DOI] [PubMed] [Google Scholar]
- Piña B., Fernandez-Larrea J., Garcia-Reyero N., Idrissi F. Z., 2003. The different (sur)faces of Rap1p. Mol. Genet. Genomics 268: 791–798. [DOI] [PubMed] [Google Scholar]
- Planta R. J., Goncalves P. M., Mager W. H., 1995. Global regulators of ribosome biosynthesis in yeast. Biochem. Cell Biol. 73: 825–834. [DOI] [PubMed] [Google Scholar]
- Polach K. J., Widom J., 1996. A model for the cooperative binding of eukaryotic regulatory proteins to nucleosomal target sites. J. Mol. Biol. 258: 800–812. [DOI] [PubMed] [Google Scholar]
- Proft M., Gibbons F. D., Copeland M., Roth F. P., Struhl K., 2005. Genomewide identification of Sko1 target promoters reveals a regulatory network that operates in response to osmotic stress in Saccharomyces cerevisiae. Eukaryot. Cell 4: 1343–1352. [DOI] [PMC free article] [PubMed] [Google Scholar]
- Qi Y., Rolfe A., MacIsaac K. D., Gerber G. K., Pokholok D., et al. , 2006. High-resolution computational models of genome binding events. Nat. Biotechnol. 24: 963–970. [DOI] [PubMed] [Google Scholar]
- Rando O. J., Winston F., 2012. Chromatin and transcription in yeast. Genetics 190: 351–387. [DOI] [PMC free article] [PubMed] [Google Scholar]
- Raveh-Sadka T., Levo M., Segal E., 2009. Incorporating nucleosomes into thermodynamic models of transcription regulation. Genome Res. 19: 1480–1496. [DOI] [PMC free article] [PubMed] [Google Scholar]
- Reddy T. E., DeLisi C., Shakhnovich B. E., 2007. Binding site graphs: a new graph theoretical framework for prediction of transcription factor binding sites. PLOS Comput. Biol. 3: e90. [DOI] [PMC free article] [PubMed] [Google Scholar]
- Reid J. L., Iyer V. R., Brown P. O., Struhl K., 2000. Coordinate regulation of yeast ribosomal protein genes is associated with targeted recruitment of Esa1 histone acetylase. Mol. Cell 6: 1297–1307. [DOI] [PubMed] [Google Scholar]
- Reimand J., Vaquerizas J. M., Todd A. E., Vilo J., Luscombe N. M., 2010. Comprehensive reanalysis of transcription factor knockout expression data in Saccharomyces cerevisiae reveals many new targets. Nucleic Acids Res. 38: 4768–4777. [DOI] [PMC free article] [PubMed] [Google Scholar]
- Ren B., Robert F., Wyrick J. J., Aparicio O., Jennings E. G., et al. , 2000. Genome-wide location and function of DNA binding proteins. Science 290: 2306–2309. [DOI] [PubMed] [Google Scholar]
- Rhee H. S., Pugh B. F., 2011. Comprehensive genome-wide protein-DNA interactions detected at single-nucleotide resolution. Cell 147: 1408–1419. [DOI] [PMC free article] [PubMed] [Google Scholar]
- Roberts C. J., Nelson B., Marton M. J., Stoughton R., Meyer M. R., et al. , 2000. Signaling and circuitry of multiple MAPK pathways revealed by a matrix of global gene expression profiles. Science 287: 873–880. [DOI] [PubMed] [Google Scholar]
- Robertson G., Hirst M., Bainbridge M., Bilenky M., Zhao Y., et al. , 2007. Genome-wide profiles of STAT1 DNA association using chromatin immunoprecipitation and massively parallel sequencing. Nat. Methods 4: 651–657. [DOI] [PubMed] [Google Scholar]
- Rossetti L., Cacchione S., De Menna A., Chapman L., Rhodes D., et al. , 2001. Specific interactions of the telomeric protein Rap1p with nucleosomal binding sites. J. Mol. Biol. 306: 903–913. [DOI] [PubMed] [Google Scholar]
- Roy S., Ernst J., Kharchenko P. V., Kheradpour P., Negre N., et al. , 2010. Identification of functional elements and regulatory circuits by Drosophila modENCODE. Science 330: 1787–1797. [DOI] [PMC free article] [PubMed] [Google Scholar]
- Segal E., Widom J., 2009. From DNA sequence to transcriptional behaviour: a quantitative approach. Nat. Rev. Genet. 10: 443–456. [DOI] [PMC free article] [PubMed] [Google Scholar]
- Segal E., Shapira M., Regev A., Pe’er D., Botstein D., et al. , 2003. Module networks: identifying regulatory modules and their condition-specific regulators from gene expression data. Nat. Genet. 34: 166–176. [DOI] [PubMed] [Google Scholar]
- Sharon E., Kalma Y., Sharp A., Raveh-Sadka T., Levo M., et al. , 2012. Inferring gene regulatory logic from high-throughput measurements of thousands of systematically designed promoters. Nat. Biotechnol. 30: 521–530. [DOI] [PMC free article] [PubMed] [Google Scholar]
- Sherlock G., 2000. Analysis of large-scale gene expression data. Curr. Opin. Immunol. 12: 201–205. [DOI] [PubMed] [Google Scholar]
- Shoemaker D. D., Schadt E. E., Armour C. D., He Y. D., Garrett-Engele P., et al. , 2001. Experimental annotation of the human genome using microarray technology. Nature 409: 922–927. [DOI] [PubMed] [Google Scholar]
- Shore D., Nasmyth K., 1987. Purification and cloning of a DNA binding protein from yeast that binds to both silencer and activator elements. Cell 51: 721–732. [DOI] [PubMed] [Google Scholar]
- Siggers T., Duyzend M. H., Reddy J., Khan S., Bulyk M. L., 2011. Non-DNA-binding cofactors enhance DNA-binding specificity of a transcriptional regulatory complex. Mol. Syst. Biol. 7: 555. [DOI] [PMC free article] [PubMed] [Google Scholar]
- Slattery M., Riley T., Liu P., Abe N., Gomez-Alcala P., et al. , 2011. Cofactor binding evokes latent differences in DNA binding specificity between Hox proteins. Cell 147: 1270–1282. [DOI] [PMC free article] [PubMed] [Google Scholar]
- Smith D. L., Johnson A. D., 1992. A molecular mechanism for combinatorial control in yeast: MCM1 protein sets the spacing and orientation of the homeodomains of an alpha 2 dimer. Cell 68: 133–142. [DOI] [PubMed] [Google Scholar]
- Smith E. N., Kruglyak L., 2008. Gene-environment interaction in yeast gene expression. PLoS Biol. 6: e83. [DOI] [PMC free article] [PubMed] [Google Scholar]
- Smith J. J., Miller L. R., Kreisberg R., Vazquez L., Wan Y., et al. , 2011. Environment-responsive transcription factors bind subtelomeric elements and regulate gene silencing. Mol. Syst. Biol. 7: 455. [DOI] [PMC free article] [PubMed] [Google Scholar]
- Spellman P. T., Sherlock G., Zhang M. Q., Iyer V. R., Anders K., et al. , 1998. Comprehensive identification of cell cycle-regulated genes of the yeast Saccharomyces cerevisiae by microarray hybridization. Mol. Biol. Cell 9: 3273–3297. [DOI] [PMC free article] [PubMed] [Google Scholar]
- Spivak A. T., Stormo G. D., 2012. ScerTF: a comprehensive database of benchmarked position weight matrices for Saccharomyces species. Nucleic Acids Res. 40: D162–D168. [DOI] [PMC free article] [PubMed] [Google Scholar]
- Stavreva D. A., Muller W. G., Hager G. L., Smith C. L., McNally J. G., 2004. Rapid glucocorticoid receptor exchange at a promoter is coupled to transcription and regulated by chaperones and proteasomes. Mol. Cell. Biol. 24: 2682–2697. [DOI] [PMC free article] [PubMed] [Google Scholar]
- Stormo G. D., Zhao Y., 2010. Determining the specificity of protein-DNA interactions. Nat. Rev. Genet. 11: 751–760. [DOI] [PubMed] [Google Scholar]
- Stros M., Launholt D., Grasser K. D., 2007. The HMG-box: a versatile protein domain occurring in a wide variety of DNA-binding proteins. Cell. Mol. Life Sci. 64: 2590–2606. [DOI] [PMC free article] [PubMed] [Google Scholar]
- Struhl K., 1985. Naturally occurring poly(dA-dT) sequences are upstream promoter elements for constitutive transcription in yeast. Proc. Natl. Acad. Sci. USA 82: 8419–8423. [DOI] [PMC free article] [PubMed] [Google Scholar]
- Struhl K., 1999. Fundamentally different logic of gene regulation in eukaryotes and prokaryotes. Cell 98: 1–4. [DOI] [PubMed] [Google Scholar]
- Struhl K., 2007. Transcriptional noise and the fidelity of initiation by RNA polymerase II. Nat. Struct. Mol. Biol. 14: 103–105. [DOI] [PubMed] [Google Scholar]
- Sun M., Schwalb B., Schulz D., Pirkl N., Etzold S., et al. , 2012. Comparative dynamic transcriptome analysis (cDTA) reveals mutual feedback between mRNA synthesis and degradation. Genome Res. 22: 1350–1359. [DOI] [PMC free article] [PubMed] [Google Scholar]
- Svetlov V. V., Cooper T. G., 1995. Review: compilation and characteristics of dedicated transcription factors in Saccharomyces cerevisiae. Yeast 11: 1439–1484. [DOI] [PubMed] [Google Scholar]
- Tan S., Richmond T. J., 1998. Crystal structure of the yeast MATalpha2/MCM1/DNA ternary complex. Nature 391: 660–666. [DOI] [PubMed] [Google Scholar]
- Tanay A., 2006. Extensive low-affinity transcriptional interactions in the yeast genome. Genome Res. 16: 962–972. [DOI] [PMC free article] [PubMed] [Google Scholar]
- Tan-Wong S. M., Zaugg J. B., Camblong J., Xu Z., Zhang D. W., et al. , 2012. Gene loops enhance transcriptional directionality. Science 338: 671–675. [DOI] [PMC free article] [PubMed] [Google Scholar]
- Tavazoie S., Hughes J. D., Campbell M. J., Cho R. J., Church G. M., 1999. Systematic determination of genetic network architecture. Nat. Genet. 22: 281–285. [DOI] [PubMed] [Google Scholar]
- Tedford K., Kim S., Sa D., Stevens K., Tyers M., 1997. Regulation of the mating pheromone and invasive growth responses in yeast by two MAP kinase substrates. Curr. Biol. 7: 228–238. [DOI] [PubMed] [Google Scholar]
- Tirosh I., Reikhav S., Levy A. A., Barkai N., 2009. A yeast hybrid provides insight into the evolution of gene expression regulation. Science 324: 659–662. [DOI] [PubMed] [Google Scholar]
- Tirosh I., Reikhav S., Sigal N., Assia Y., Barkai N., 2010a Chromatin regulators as capacitors of interspecies variations in gene expression. Mol. Syst. Biol. 6: 435. [DOI] [PMC free article] [PubMed] [Google Scholar]
- Tirosh I., Sigal N., Barkai N., 2010b Divergence of nucleosome positioning between two closely related yeast species: genetic basis and functional consequences. Mol. Syst. Biol. 6: 365. [DOI] [PMC free article] [PubMed] [Google Scholar]
- Tompa M., Li N., Bailey T. L., Church G. M., De Moor B., et al. , 2005. Assessing computational tools for the discovery of transcription factor binding sites. Nat. Biotechnol. 23: 137–144. [DOI] [PubMed] [Google Scholar]
- Trcek T., Larson D. R., Moldon A., Query C. C., Singer R. H., 2011. Single-molecule mRNA decay measurements reveal promoter- regulated mRNA stability in yeast. Cell 147: 1484–1497. [DOI] [PMC free article] [PubMed] [Google Scholar]
- Tsankov A., Yanagisawa Y., Rhind N., Regev A., Rando O. J., 2011. Evolutionary divergence of intrinsic and trans-regulated nucleosome positioning sequences reveals plastic rules for chromatin organization. Genome Res. 21: 1851–1862. [DOI] [PMC free article] [PubMed] [Google Scholar]
- Turcotte B., Guarente L., 1992. HAP1 positive control mutants specific for one of two binding sites. Genes Dev. 6: 2001–2009. [DOI] [PubMed] [Google Scholar]
- Valouev A., Johnson D. S., Sundquist A., Medina C., Anton E., et al. , 2008. Genome-wide analysis of transcription factor binding sites based on ChIP-Seq data. Nat. Methods 5: 829–834. [DOI] [PMC free article] [PubMed] [Google Scholar]
- van Dijk E. L., Chen C. L., d’Aubenton-Carafa Y., Gourvennec S., Kwapisz M., et al. , 2011. XUTs are a class of Xrn1-sensitive antisense regulatory non-coding RNA in yeast. Nature 475: 114–117. [DOI] [PubMed] [Google Scholar]
- van Werven F. J., Neuert G., Hendrick N., Lardenois A., Buratowski S., et al. , 2012. Transcription of two long noncoding RNAs mediates mating-type control of gametogenesis in budding yeast. Cell 150: 1170–1181. [DOI] [PMC free article] [PubMed] [Google Scholar]
- Venters B. J., Pugh B. F., 2009. A canonical promoter organization of the transcription machinery and its regulators in the Saccharomyces genome. Genome Res. 19: 360–371. [DOI] [PMC free article] [PubMed] [Google Scholar]
- Venters B. J., Wachi S., Mavrich T. N., Andersen B. E., Jena P., et al. , 2011. A comprehensive genomic binding map of gene and chromatin regulatory proteins in Saccharomyces. Mol. Cell 41: 480–492. [DOI] [PMC free article] [PubMed] [Google Scholar]
- Voth W. P., Yu Y., Takahata S., Kretschmann K. L., Lieb J. D., et al. , 2007. Forkhead proteins control the outcome of transcription factor binding by antiactivation. EMBO J. 26: 4324–4334. [DOI] [PMC free article] [PubMed] [Google Scholar]
- Wagner A., 1999. Genes regulated cooperatively by one or more transcription factors and their identification in whole eukaryotic genomes. Bioinformatics 15: 776–784. [DOI] [PubMed] [Google Scholar]
- Wang H., Johnston M., Mitra R. D., 2007. Calling cards for DNA-binding proteins. Genome Res. 17: 1202–1209. [DOI] [PMC free article] [PubMed] [Google Scholar]
- Wang H., Mayhew D., Chen X., Johnston M., Mitra R. D., 2011. Calling Cards enable multiplexed identification of the genomic targets of DNA-binding proteins. Genome Res. 21: 748–755. [DOI] [PMC free article] [PubMed] [Google Scholar]
- Wang, L.-S., S. T. Jensen, and S. Hannenhalli, 2006 An interaction-dependent model for transcription factor binding, pp. 225–234 in Systems Biology and Regulatory Genomics: Joint RECOMB 2005 Satellite Workshops on Regulatory Genomics, edited by E. Eskin, T. Ideker, B. Raphael, and C. Workman. Springer-Verlag, Berlin/Heidelberg, Germany/New York. [Google Scholar]
- Wasson T., Hartemink A. J., 2009. An ensemble model of competitive multi-factor binding of the genome. Genome Res. 19: 2101–2112. [DOI] [PMC free article] [PubMed] [Google Scholar]
- Weider M., Machnik A., Klebl F., Sauer N., 2006. Vhr1p, a new transcription factor from budding yeast, regulates biotin-dependent expression of VHT1 and BIO5. J. Biol. Chem. 281: 13513–13524. [DOI] [PubMed] [Google Scholar]
- Weirauch M. T., Hughes T. R., 2010. Conserved expression without conserved regulatory sequence: the more things change, the more they stay the same. Trends Genet. 26: 66–74. [DOI] [PubMed] [Google Scholar]
- Weirauch M. T., Hughes T. R., 2011. A catalogue of eukaryotic transcription factor types, their evolutionary origin, and species distribution. Subcell. Biochem. 52: 25–73. [DOI] [PubMed] [Google Scholar]
- Wellinger R. J., Zakian V. A., 2012. Everything you ever wanted to know about Saccharomyces cerevisiae telomeres: beginning to end. Genetics 191: 1073–1105. [DOI] [PMC free article] [PubMed] [Google Scholar]
- Wodicka L., Dong H., Mittmann M., Ho M. H., Lockhart D. J., 1997. Genome-wide expression monitoring in Saccharomyces cerevisiae. Nat. Biotechnol. 15: 1359–1367. [DOI] [PubMed] [Google Scholar]
- Workman C. T., Mak H. C., McCuine S., Tagne J. B., Agarwal M., et al. , 2006. A systems approach to mapping DNA damage response pathways. Science 312: 1054–1059. [DOI] [PMC free article] [PubMed] [Google Scholar]
- Workman J. L., 2006. Nucleosome displacement in transcription. Genes Dev. 20: 2009–2017. [DOI] [PubMed] [Google Scholar]
- Xu Z., Wei W., Gagneur J., Perocchi F., Clauder-Munster S., et al. , 2009. Bidirectional promoters generate pervasive transcription in yeast. Nature 457: 1033–1037. [DOI] [PMC free article] [PubMed] [Google Scholar]
- Xu Z., Wei W., Gagneur J., Clauder-Munster S., Smolik M., et al. , 2011. Antisense expression increases gene expression variability and locus interdependency. Mol. Syst. Biol. 7: 468. [DOI] [PMC free article] [PubMed] [Google Scholar]
- Yang Y., Zhang Z., Li Y., Zhu X. G., Liu Q., 2010. Identifying cooperative transcription factors by combining ChIP-chip data and knockout data. Cell Res. 20: 1276–1278. [DOI] [PubMed] [Google Scholar]
- Yeo Z. X., Yeo H. C., Yeo J. K., Yeo A. L., Li Y., et al. , 2009. Inferring transcription factor targets from gene expression changes and predicted promoter occupancy. J. Comput. Biol. 16: 357–368. [DOI] [PubMed] [Google Scholar]
- Yoshimoto H., Saltsman K., Gasch A. P., Li H. X., Ogawa N., et al. , 2002. Genome-wide analysis of gene expression regulated by the calcineurin/Crz1p signaling pathway in Saccharomyces cerevisiae. J. Biol. Chem. 277: 31079–31088. [DOI] [PubMed] [Google Scholar]
- Yu H., Gerstein M., 2006. Genomic analysis of the hierarchical structure of regulatory networks. Proc. Natl. Acad. Sci. USA 103: 14724–14731. [DOI] [PMC free article] [PubMed] [Google Scholar]
- Yu L., Morse R. H., 1999. Chromatin opening and transactivator potentiation by RAP1 in Saccharomyces cerevisiae. Mol. Cell. Biol. 19: 5279–5288. [DOI] [PMC free article] [PubMed] [Google Scholar]
- Yuan G. C., Liu Y. J., Dion M. F., Slack M. D., Wu L. F., et al. , 2005. Genome-scale identification of nucleosome positions in S. cerevisiae. Science 309: 626–630. [DOI] [PubMed] [Google Scholar]
- Yuan Y., Guo L., Shen L., Liu J. S., 2007. Predicting gene expression from sequence: a reexamination. PLoS Comput. Biol. 3: e243. [DOI] [PMC free article] [PubMed] [Google Scholar]
- Yvert G., Brem R. B., Whittle J., Akey J. M., Foss E., et al. , 2003. Trans-acting regulatory variation in Saccharomyces cerevisiae and the role of transcription factors. Nat. Genet. 35: 57–64. [DOI] [PubMed] [Google Scholar]
- Zhang Y., Moqtaderi Z., Rattner B. P., Euskirchen G., Snyder M., et al. , 2009. Intrinsic histone-DNA interactions are not the major determinant of nucleosome positions in vivo. Nat. Struct. Mol. Biol. 16: 847–852. [DOI] [PMC free article] [PubMed] [Google Scholar]
- Zhao Y., Stormo G. D., 2011. Quantitative analysis demonstrates most transcription factors require only simple models of specificity. Nat. Biotechnol. 29: 480–483. [DOI] [PMC free article] [PubMed] [Google Scholar]
- Zheng J., Benschop J. J., Shales M., Kemmeren P., Greenblatt J., et al. , 2010a Epistatic relationships reveal the functional organization of yeast transcription factors. Mol. Syst. Biol. 6: 420. [DOI] [PMC free article] [PubMed] [Google Scholar]
- Zheng W., Zhao H., Mancera E., Steinmetz L. M., Snyder M., 2010b Genetic analysis of variation in transcription factor binding in yeast. Nature 464: 1187–1191. [DOI] [PMC free article] [PubMed] [Google Scholar]
- Zhou X., O’Shea E. K., 2011. Integrated approaches reveal determinants of genome-wide binding and function of the transcription factor Pho4. Mol. Cell 42: 826–836. [DOI] [PMC free article] [PubMed] [Google Scholar]
- Zhu C., Byers K. J., McCord R. P., Shi Z., Berger M. F., et al. , 2009. High-resolution DNA-binding specificity analysis of yeast transcription factors. Genome Res. 19: 556–566. [DOI] [PMC free article] [PubMed] [Google Scholar]
- Zhu J., Zhang B., Smith E. N., Drees B., Brem R. B., et al. , 2008. Integrating large-scale functional genomic data to dissect the complexity of yeast regulatory networks. Nat. Genet. 40: 854–861. [DOI] [PMC free article] [PubMed] [Google Scholar]
- Zhu Y., Dai J., Fuerst P. G., Voytas D. F., 2003. Controlling integration specificity of a yeast retrotransposon. Proc. Natl. Acad. Sci. USA 100: 5891–5895. [DOI] [PMC free article] [PubMed] [Google Scholar]
- Zykovich A., Korf I., Segal D. J., 2009. Bind-n-Seq: high-throughput analysis of in vitro protein-DNA interactions using massively parallel sequencing. Nucleic Acids Res. 37: e151. [DOI] [PMC free article] [PubMed] [Google Scholar]