

Abstract
Melittin is a prototype of the ubiquitous antimicrobial peptides that induce pores in membranes. It is commonly used as a molecular device for membrane permeabilization. Even at concentrations in the nanomolar range, melittin can induce transient pores that allow transmembrane conduction of atomic ions but not leakage of glucose or larger molecules. At micromolar concentrations, melittin induces stable pores allowing transmembrane leakage of molecules up to tens of kilodaltons, corresponding to its antimicrobial activities. Despite extensive studies, aspects of the molecular mechanism for pore formation remain unclear. To clarify the mechanism, one must know the states of the melittin-bound membrane before and after the process. By correlating experiments using giant unilamellar vesicles with those of peptide-lipid multilayers, we found that melittin bound on the vesicle translocated and redistributed to both sides of the membrane before the formation of stable pores. Furthermore, stable pores are formed only above a critical peptide-to-lipid ratio. The initial states for transient and stable pores are different, which implies different mechanisms at low and high peptide concentrations. To determine the lipidic structure of the pore, the pores in peptide–lipid multilayers were induced to form a lattice and examined by anomalous X-ray diffraction. The electron density distribution of lipid labels shows that the pore is formed by merging of two interfaces through a hole. The molecular property of melittin is such that it adsorbs strongly to the bilayer interface. Pore formation can be viewed as the bilayer adopting a lipid configuration to accommodate its excessive interfacial area.
Keywords: toroidal pore, oriented circular dichroism, rhombohedral phase
Melittin, the major toxin of the bee venom discovered around 1970 (1), produces a variety of effects on nature membranes, including cell lysis (2), antimicrobial activity (3), and voltage-dependent ion conductance (4). A great number of host-defense antimicrobial peptides (5, 6) discovered in the past three decades have been found to exhibit similar behavior of melittin (3, 7). Among membrane-active peptides, melittin is perhaps the most extensively studied (8–12). It is widely used for cell and liposome lysis and as a model for pore-forming peptides (7, 13). Its whole and partial amino acid sequences have been incorporated in the designs of synthetic proteins to mimic the property of melittin (14, 15). However, its molecular process and mechanism of activities are still in dispute. It is clear that melittin binds to membranes as monomers but acts on the membrane collectively. Even at concentrations as low as a few nanomoles per liter, melittin can induce transient pores that allow transmembrane conduction of atomic ions but not leakage of glucose or larger molecules (4, 7, 16). In the micromolar range, melittin induces stable pores allowing transmembrane leakage of molecules up to tens of kilodaltons (13, 17, 18). At even higher concentrations, it can act as a detergent disintegrating the membranes. It is important to differentiate between these three types of phenomena. In particular, it is well established that the minimal inhibitory concentration values of melittin and other antimicrobial peptides are in the micromolar range (6, 7, 19, 20). A close correlation between the formation of stable pores and the antimicrobial activities was recently shown by Last and Miranker (20).
Here, we design experiments to observe and measure the states of the membrane before and after the formation of stable pores in giant unilamellar vesicles (GUVs) and in peptide–lipid multilayers. We also perform an X-ray diffraction experiment to resolve the contour of the lipidic structure in the stable pores. From these results, we can understand how and why melittin induces stable pores in membranes and why stable pores occur at melittin concentrations in the micromolar range.
The molecular interaction between a melittin monomer and a lipid bilayer was first described by Terwilliger et al. (9), who obtained the X-ray structure of melittin from the crystals grown from salt solutions. The 26-residue polypeptide has the conformation of a bent α-helical rod; residues 1–10 form a straight α-helix, as do residues 13–26; however, due to the residue Pro-14, the axes of the two helices form an obtuse angle of ∼120°. The melittin helix exhibits a distinctive orientational segregation of hydrophobic and hydrophobic side chains, a characteristic of membrane-active peptides. The hydrophobic side chains are oriented mainly toward the inside of the bend of the helix, and the charged and polar side chains are oriented mainly toward the outside of the bend. Terwilliger et al. (9) proposed that melittin integrates into the surface of the lipid bilayers with the helical axis parallel to the bilayer in which the hydrophobic inner surface penetrates shallowly in the apolar portion of the membrane. This membrane-binding configuration was largely in agreement with CD and NMR studies with micelle-bound melittin (21).
As pointed out by Terwilliger et al. (9), the key feature of melittin interaction is that melittin occupies space in the headgroup region of the phospholipid molecules in the bilayer but does not extend all the way to the center of the bilayer. In order that there not be any empty space underneath the melittin molecule, the lipid chains must be distorted from a smooth planar bilayer to fill the space, which is called a wedge effect. Any protein of uniform cross-section that penetrates all the way across the bilayer or exactly half of the way across the bilayer would not be expected to disturb the bilayer structure in the same manner as melittin. The amphipathic character also suggested that melittin might be stable at the edge of a planar bilayer, thereby being capable of generating membrane edges.
Based on the wedge and edge effects, Terwilliger et al. (9) proposed the following model for the melittin actions. At low concentrations in a membrane, melittin lies parallel to the membrane surface. The wedge effect increases the area of the outer leaflet relative to the unperturbed inner leaflet. As the melittin concentration increases, the area imbalance leads to the spontaneous formation of lipid pores stabilized by melittin (the edge effect). As the melittin concentration increases further, the size of these pores increases until they connect and the membrane disintegrates, causing cell lysis.
The model of Terwilliger et al. (9) was based on the molecular structure of melittin. The model did not take into account the response behavior of the lipid bilayer. To understand the cause and effect of the melittin–membrane interaction, we need to know the initial and final states of the reaction (i.e., the state of the membrane acted upon by melittin before pore formation and the structure of the resultant pore). The action of melittin on cell membranes can be tested using lipid vesicles in a solution containing melittin. The question is how to measure the state of membrane in a vesicle. Our method is to correlate the state of the membrane in lipid vesicles with the state of the membrane in multilayers in which the melittin–lipid mixtures are in equilibrium so that we can use the precise measurements in the latter to infer the former. We show that for melittin concentrations in the micromolar range, the states of membranes in vesicles are the same as in fully hydrated multilayers. We also exploit the lipid phase transitions to induce the melittin pores in multilayers to form a rhombohedral lattice (22). Using a bromine-label lipid and a method of multiwavelength anomalous diffraction (MAD), we obtained the contour of the lipidic structure in the melittin pore.
The results suggest that the pore-forming mechanism of the model of Terwilliger et al. (9) is for transient pores: Through the transient pores, melittin redistributes to both sides of the membrane in lipid vesicles before the formation of stable pores. Having clarified the initial and final states of pore formation, we offer a modified version of the theory of Terwilliger et al. (9) to explain the molecular process for stable pores, which is likely the mechanism of antimicrobial activities (20).
Results
Correlating Melittin Binding on a Lipid Vesicle with Structural Studies in Multilayers.
Melittin has been shown to cause molecular leakage from varieties of zwitterionic and anionic lipid vesicles while leaving the membranes intact (23–25). Melittin binding invariably expanded the surface area of the lipid vesicle before molecular leakage occurred (24, 25). However, the relation between the membrane area expansion and the leakage was never precisely measured.
We used the method of aspiration (25, 26) to monitor the membrane area change of a GUV that encapsulated a solution dye. For technical reasons (e.g., water evaporation), the GUV experiment is least complicated and most accurately measured if completed in 2–5 min (27). For this reason, we used a lipid composition that included an anionic lipid [i.e., dioleoyl phosphatidylcholine (DOPC) and dioleoyl phosphatidylglycerol (DOPG) at a 7:3 ratio] to achieve a suitable rate of melittin binding. An aspirated GUV was transferred to a solution containing dye-labeled melittin (FITC-melittin) varying from 1 to 5 μM in different runs. A reproducible reaction was observed as shown in Fig. 1 (Movie S1). The same experiment was repeated with melittin without a dye label. The membrane area increase is proportional to the amount of melittin binding. The solution dye encapsulated in the GUV began to leak out when the membrane area increased by a fraction of 2.8–4.5% in 10 runs, with no apparent dependence on the melittin concentration or whether FITC-melittin or melittin was used, averaged to 3.4 ± 0.5% (Table S1). This range of variability in membrane expansion is comparable to previous GUV measurements on rupture tension (28).
Fig. 1.

Run of the GUV experiment (Movie S1). (Upper) Confocal images of an aspirated GUV colored green to measure the binding of FITC-melittin on the GUV and colored red to measure the fluorescence intensity of TRsc (625 Mr) inside the GUV. A GUV of DOPC/DOPG at a 7:3 ratio encapsulating the TRsc was introduced into a solution containing 2 μM FITC-melittin at time 0. Within ∼400 s, photobleaching of the dyes was negligible. (Scale bar = 20 μm.) (The red line on the micropipette is an optical artifact.) (Lower)  (interpretation is provided in Materials and Methods) and relative fluorescence intensities in time. The strongest fluorescence intensity for each color is taken as 1.
  was converted to
  assuming no GUV volume change, and therefore was correct only before the leakage (solid diamonds); only this part is used for analysis. The open diamonds merely indicate the length change of the aspirated protrusion. (A qualitative explanation for the whole course of the protrusion length increase and decrease is provided in SI Text, Giant Unilamellar Vesicle Protrusion.) TRsc, Texas Red sulfonyl chloride.
We then compared this result with the mixtures of melittin and DOPC/DOPG at a 7:3 ratio in fully hydrated, aligned multiple bilayers in which the peptide and lipid bilayers were in equilibrium. X-ray diffraction showed that the lipid bilayers had a well-defined, average phosphate peak-to-phosphate peak distance, PtP, across the bilayer (Fig. 2), from which we obtained the thickness of the hydrocarbon region, h. The same samples were measured by oriented circular dichroism (OCD) (11, 29) for the orientation of melittin helices in membranes (Fig. 2). The membrane thickness initially decreased linearly with the peptide-to-lipid molar ratio (P/L), but above a critical value, P/L*∼1/45, the membrane thickness leveled off. The fractional membrane thinning was  at P/L = P/L*. Correspondingly, all melittin helices were found to lie parallel to the plane of the membrane in the region in which the thickness decreased linearly with the P/L, but above the critical P/L*∼1/45, an increasing fraction of melittin helices changed orientation to being perpendicular to the membrane (Fig. 2). This correlation between the membrane thinning and the peptide orientation change has been observed for melittin and other antimicrobial peptides in many different lipid compositions (30–32). Only the value of P/L* and the degree of thinning varied with peptide and lipid composition. Most importantly, we have used the method of neutron in-plane scattering to detect the presence of pores in these multilayers. Invariably, we found that pores were present when the P/L was above the P/L* but not when it was below (11, 33). The pores in the GUV that allow molecular leakage and the pores in multilayers detected by neutrons are stable (or steady) pores. Neutron results show that the density and size of pores in multilayers are constant in time. A GUV with stable pores can last for hours, apparently reaching an equilibrium state (20, 24).
Fig. 2.

Melittin helices and lipid bilayers in fully hydrated multilayers of peptide–lipid (DOPC/DOPG at a 7:3 ratio) mixtures in the P/L. (A) Membrane thickness, PtP, as a function of the P/L measured by lamellar diffraction. The PtP linearly decreases with the P/L until P/L*∼1:45 is attained. (B) Same samples were measured by the method of OCD to determine the fraction of melittin helices oriented normal to the plane of bilayers (the remaining fraction was parallel to the plane). The fraction is linear when plotted against 1/(P/L) (31) for a P/L above a transition point, P/L*∼1:45. The error bars are the ranges of reproducibility using two to three independently prepared samples.
Thus, we have found a close correlation between the state of the membrane in the GUV before dye leakage and the state of the membrane in multilayers before pore formation: (i) In the GUV, the membrane area expansion is linearly proportional to the amount of melittin binding, and in multilayers, the membrane thinning is linearly proportional to the P/L, and (ii) the fractional membrane area expansion reached  when dye leakage began, and the fractional membrane thickness decrease was
  when stable pores began to appear in the multilayers. This close correlation reasonably suggests that the state of the membrane in the GUV and the state of the membrane in the multilayers were the same before the formation of stable pores. In turn, this suggests that melittin monomers initially bound to the outer leaflet of the GUV had redistributed to both sides of the membrane before the formation of stable pores.
The equality of  and
and  comes from the volume conservation of the hydrocarbon region (area, A; thickness, h), assuming that melittin binding has insignificant penetration into the hydrocarbon region (9). It is instructive to compare the experimental agreement between the values of
  and
and  in melittin experiments with a counterexample in which the peptide does not translocate across the membrane. The peptide penetration is soluble in water and binds to GUVs, and it expands the membrane area just like melittin (34). However, when the membrane expansion reached
  , penetration helices transformed to β-sheet aggregates and exited from the outer leaflet of the GUV (34). On the other hand, penetration helices mixed in lipid multilayers caused membrane thinning linearly proportional to the P/L, also like melittin. Only when the thinning reached
  did the penetration helices transform to β-sheet aggregates and exit from both sides of the lipid bilayers (35). Note the large deviation between the values of
  and
and  when the peptide bound on the outer leaflet did not translocate across the bilayer. Thus, a careful comparison of the GUV and multilayer experiments can distinguish whether a peptide translocates across the membrane or not.
Structure of the Melittin Pore.
That melittin induces stable pores in membranes is evident in the GUV experiment, because melittin caused dye molecules to leak out, whereas the membrane remained intact. As mentioned above, the pores are also detectable by neutron scattering in fully hydrated multilayers of lipid–melittin mixtures (11, 33). Viewing the aligned multilayers along the plane of membranes, the neutron scattering-length density is uniform in the plane if there are no pores. On the other hand, if there are transmembrane pores and the water is exchanged to heavy water (D2O), the D2O columns through the pores provide a strong neutron scattering-length contrast against the lipid background in the plane. Indeed, neutron scattering detected D2O columns diffusing two-dimensionally in the plane of the membrane (11, 33). The radial distribution function deduced from the scattering curve had a narrow peak indicating a uniform pore size (11, 33, 36). The inner diameter of the melittin pore was found to be ∼4.4 nm in both 1-palmitoyl-2-oleoyl-sn-glycero-3-phosphocholine (at P/L = 1/15) and dilauroyl phosphatidylcholine (at P/L = 1/30) bilayers (11). As discussed by Yang et al. (11), these pores could not be formed by barrel-like assemblies of peptide helices [the so-called “barrel-stave” model (37, 38)] because the fraction of melittin helices measured to be oriented perpendicular to the membrane was much less than what was required to line the inner circumferences of all the pores [in contrast, this was possible for alamethicin, which forms barrel-stave pores (39)]. Therefore, it was argued that the pore must be at least partially lined by the lipid headgroups, which is called a toroidal (or wormhole) pore (33). The same structure was proposed by Matsuzaki et al. (23, 40) based on their kinetic experiments. This structure is now proved by the method of X-ray reconstruction.
An X-ray reconstruction is possible because it is possible to crystallize melittin pores. The pores, which are freely diffusing in fully hydrated multilayers, become correlated between layers when the hydration is decreased, and they eventually undergo a phase transition to a rhombohedral crystalline lattice (R phase) as shown by its diffraction pattern in Fig. 3 (11, 22). In such a crystal, the unit cell is composed of a liquid-like distribution of lipids and peptides. As a result, the diffraction is limited to small angles (38, 41), even though the diffraction peaks are sharp (implying an excellent long-range order). To make use of the low-resolution diffraction, we simplified the detected component to view only the contour of the pore. We used a Br-labeled lipid, 1,2-distearoyl(9-10dibromo)-sn-glycero-3-phosphocholine [di18:0(9,10Br)PC], and developed a method of MAD to obtain the diffraction amplitudes for the Br atoms alone (38). Because the layer formed by Br atoms is exactly parallel to the lipid monolayer, this is sufficient to determine the lipidic structure. The reconstruction of Br atom distribution clearly shows the lipidic structure of the melittin pore (Fig. 4). [Note that melittin has been studied in a great variety of lipid compositions; the behavior of stable pore formation is similar in all, including the phase transition from the lamellar phase to the R phase (11, 24, 31, 32); there is nothing special about di18:0(9,10Br)PC.]
Fig. 3.
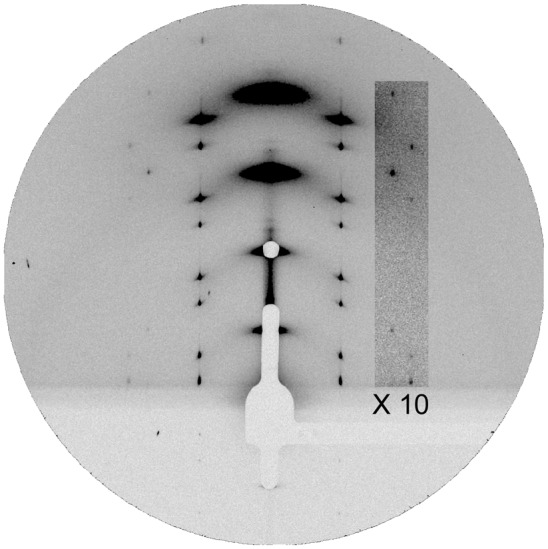
Grazing-angle diffraction pattern of the R phase of the melittin–di18:0(9,10Br)PC mixture at a P/L of 1:40 at 45% RH, 30 °C.
Fig. 4.

X-ray contour of the melittin pore in the R phase of a melittin–di18:0(9,10Br)PC mixture (1:40 P/L). To show the contour of the melittin pore clearly, we used the MAD method to obtain the diffraction amplitudes for Br atoms alone. The solid lines define the unit cell of the R phase. The electron density is expressed in a relative scale by color. Br atoms are distributed in the high-density (yellow-red-black) region. The nonuniformity in the low-density region is due to the limited resolution of small-angle diffraction. The electron density of the whole system is shown in Fig. S1. (Upper Right) Cartoon for the lipid structure of the melittin pore. The silver layer represents the headgroup layer of the lipid bilayer. The red layer represents the Br layer, which was detected by X-ray diffraction.
The unit cell is a hexagonal section of a lipid bilayer with a pore at the center (dimensions are shown in Fig. 4). In a pure lipid bilayer, the Br atoms in each leaflet form a planar layer parallel to the plane of the membrane (42). The diffraction result in Fig. 4 shows that the top and bottom monolayers bend and merge through the pore. To distinguish it from the barrel-stave model [e.g., the alamethicin pore (38)] in which the two monolayers remain separate without bending or merging, the melittin pore is called a toroidal pore (11). This distinction is important when one considers the internal dimension of the transmembrane pore and the molecular property of its luminal surface. For example, the fusion pores of secretory vesicles were compared with the melittin pores (13) by the permeation of styryl dyes through them.
The size of a barrel-stave pore in a fully hydrated lipid bilayer (39) is the same as in the crystal (38). This is because a barrel-stave pore is framed by a peptide assembly; it does not change with the hydration level of the sample. In contrast, a toroidal pore shrinks with dehydration. In fully hydrated multilayers, neutron scattering determined the internal diameter of the melittin pores to be 4.4 nm (11). Upon dehydration to the R phase, the inner diameter of the melittin pore was reduced to ∼0.7 nm (SI Text, Pore Size, and Fig. S1). The purpose of the crystal reconstruction is to provide the proof that the melittin pore is lined by the bilayer interface.
There are four to seven melittin helices in the luminal surface of a fully hydrated pore. This was deduced from the result of OCD (i.e., the fraction of melittin helices oriented normal to the membrane as a function of the P/L) and the density of pores in the membrane (11, 33). The molecular cross-section of a melittin helix along its axis has been measured to be 4.00 nm2 (9, 15). The total area contributed by a maximum of seven melittin helices to the luminal surface is ∼28 nm2 (11) out of a total area of  nm2 (assuming a bilayer height of 3.7 nm based on the PtP in Fig. 2). Thus, 50% or more of the luminal surface is lined by the lipid headgroups. This presents a rather different pore surface to permeating molecules, compared with a protein channel. The luminal surface of the melittin pore is an extension of the bilayer interface, except that the surface density of melittin in the pore may be higher than in the planar interface. The toroidal pore has a positive mean curvature. A toroidal pore in a pure lipid bilayer would incur a considerable bending energy (43), making it unlikely to occur. The participation of melittin helices in the luminal surface should significantly reduce this curvature energy (44), making the energy level of a pore not too much higher than the interfacial state on the planar bilayer; hence, a transition to the pore state is possible in the presence of melittin (45).
Discussion
Recently, Moon and Fleming (46) measured the free energy scale for transferring amino acid side chains from water to the lipid bilayer interior. Using the model of membrane-binding melittin of Terwilliger et al. (9), we estimate 27  (kB is the Boltzmann constant, and T is room temperature) is required for transferring a melittin helix from interfacial binding to transmembrane insertion into a lipid bilayer. If we use the translocon-to-bilayer energy scale measured by Hessa et al. (47), the transfer energy is about 37
  . By these estimates, the transfer is probabilistically forbidden; melittin stays on the interface as long as it binds to the membrane. In comparison, melittin induces stable pores when the membrane area is expanded by 3.4%. The energy cost of membrane area expansion elevates the chemical potential of peptide by 1.1
  before the onset of stable pores (SI Text, Energy Calculation).
The most reasonable assumption for melittin translocation across the membrane before the formation of stable pores is by way of transient pore fluctuations. It is known that melittin (and other antimicrobial peptides) induce transient ion conduction at nanomolar peptide concentrations (4, 7, 16). The ion conductivity increases with the peptide concentration all the way to the submicromolar range (4, 16). We define the pores that induce atomic ion conduction but do not allow transmembrane passage of glucose and larger molecules as transient pores. Transient pores of melittin (and other antimicrobial peptides) do not exhibit well-defined single-channel step conductance, contrary to alamethicin (7, 16). The molecular configurations of transient pores are unknown. Given how tightly melittin binds to the interface and the relatively low energy barrier for pore formation, the transient pore formation is likely due to the mechanism of the model of Terwilliger et al. (9) (i.e., the stress is due to one-sided binding that increases the area of the outer leaflet relative to the unperturbed inner leaflet). This can occur locally by fluctuations. A single transient pore in an ∼100-μm-sized lipid bilayer has been detected (4, 16). However, such pores are transient and not stabilized by the edge effect as speculated by Terwilliger et al. (9).
In contrast, stable pores allow a steady transmembrane passage of molecules up to tens of kilodaltons (13, 17, 18). As shown in Fig. 1, stable pores appear only when the P/L is above a threshold value P/L*; no molecular leakage was detected before the onset of stable pores. Our experiments have clarified the state of the membrane in the GUV before the formation of stable pores (i.e., melittin monomers have redistributed to both sides of the bilayer). The two-sided binding stretches the lipid bilayer by the wedge effect of melittin, and thus builds up a membrane strain that increases with the P/L. When the strain exceeds a critical value, the free energy of the strain is lowered by curving the interface through wormhole-like pores as shown in Fig. 4 (45, 48). A qualitative description of the pore-forming energetics is to view the melittin binding on the interface as generating a positive spontaneous curvature in the lipid monolayer in proportion to the P/L (44). In this view, the membrane before pore formation has built up a bending energy by forcing two monolayers of positive spontaneous curvature in the planar configuration (43). Thus, creating an interface of positive mean curvature through the pores would lower the total bending energy of the membrane. By this argument, the peptide density in the pores should be higher than the peptide density on the planar interfaces.
However, why does the formation of stable pores exhibit a threshold [or nucleation-dependent (20)] behavior at a critical value P/L*? This is understandable if we view each pore as an aggregation of four to seven melittin monomers, whereas melittin monomers are randomly distributed on the planar interfaces (49). It has been shown that the critical P/L* is equivalent to a critical micelle concentration (48).
In essence, melittin has a strong binding affinity to the lipid bilayer interface, relative to its water solubility or any other possible binding state with lipid molecules. Also, its interfacial bound state is compatible with the curved surface in a toroidal pore. The action caused by melittin in membranes can be viewed as the response of a lipid bilayer to its excessive interfacial area due to melittin binding. The asymmetrical interfacial tension due to one-sided binding may be released by peptide translocation via transient pore formation. Experiments show that stable pores are formed only when the P/L is in the range of ∼1/100 or more (31, 32). This typically occurs when the peptide concentration is in the micromolar range (the precise value depends on the concentration of membranes in the solution) (6, 7, 19, 20). Given the similarity between many antimicrobial peptides and melittin (3, 7), we expect a large number of host-defense antimicrobial peptides to function by the melittin mechanism. Indeed, Last and Miranker (20) have recently demonstrated that even amyloid peptides induce stable pores in membranes by the same mechanism. The existence of a threshold peptide concentration P/L* is important. Stable pores are formed only if a cell membrane attracts an amount of peptide in excess of its P/L*. Thus, different membranes (e.g., due to the differences of their surface charge) can have different susceptibilities to a given peptide (6).
Materials and Methods
Materials.
Lipid 1,2-distearoyl(9-10dibromo)-sn-glycero-3-phosphocholine [di18:0(9,10Br)PC], 18:1 (Δ9-Cis) PC (DOPC), 18:1 (Δ9-Cis) PG (DOPG), and 1,2-dioleoyl-sn-glycero-3-phosphoethanolamine-N-(7-nitro-2-1,3-benzoxadiazol-4-yl) (NBD-PE) were purchased from Avanti Polar Lipids. Melittin purified from honey bee venom was purchased from Sigma–Aldrich [this product was compared with synthetic melittin, and they produced indistinguishable results (11)]. FITC-melittin of >95% purity as determined by HPLC was synthesized by Mimotopes. Texas red sulfonyl chloride (TRsc; 625 Mr) was from Invitrogen Probe. All other reagents were from Sigma–Aldrich.
Aspirated GUV Experiment.
This experiment was a modification of the original method of Kwok and Evans (26) and of Longo et al. (25) as described by Sun et al. (27). GUVs of the 7:3 DOPC/DOPG mixture were produced by the electroformation method (50) in a solution containing 199 mM sucrose for the purpose of controlling the osmolality, 1 mM Tris at pH 7, and 10 μM TRsc for monitoring the membrane leakage. A selected GUV (diameter of ∼40 μm) was aspirated at a low constant negative pressure (∼100 Pa, producing a membrane tension of ∼0.4 mN/m) with a micropipette, which was connected to an oil-filled U tube, where a negative pressure was produced and controlled by reference to the atmosphere pressure (27). A separate observation chamber contained 190 mM glucose, 10 mM Tris at pH 7, and 1–5 μM FITC-melittin. We used FITC-melittin to observe its binding to the membrane. The osmolality of each solution was measured. Equiosmolality between the inside and outside of the GUV was the initial condition in all GUV experiments. The aspirated GUV was transferred through a movable pipe (27) from the GUV production chamber to the observation chamber. The response of the GUV to the peptide binding was observed by a confocal microscope recorded in two channels (488 nm for FITC, 561 nm for TRsc). The same experiment was repeated with melittin (without FITC). In this case, 5% NBD-PE was added to the GUV lipid so that the boundary of the GUV could be precisely measured by the 488-nm images.
In response to peptide binding, a GUV can change its membrane area A and volume V. The protrusion inside the micropipette serves as an amplifier for the measurement of such changes under a constant tension. From the microscopic images, the following measurements were carefully taken:  , the length of the protrusion;
  , the radius of the micropipette; and
  , the radius of the GUV. Then, it is straightforward to show
  and
and  (51). In general, the changes of the GUV radius,
  , are too small to be measured accurately. However, if there is no molecular leakage and the inside and outside of the GUVs are in equiosmolality, there should be no change of volume. Under the condition
  ,
,  is directly proportional to
  :
:  . In Fig. 1, this formula was used to convert
  to
to  for the entire process. This relation is correct only before the molecular leakage, and only the
  values before leakage are used for analysis.
Melittin in Hydrated Multiple Bilayers.
Following the procedure described by Ludtke et al. (52), melittin and lipid (DOPC/DOPG at a 7:3 ratio) were codissolved at a chosen P/L in trifluoroethanol-chloroform (1:1) and deposited on a thoroughly cleaned quartz plate measuring 10 × 20 mm2. After the evaporation of the organic solvent in a vacuum, the sample was incubated in a temperature-humidity chamber with saturated water vapor at 35 °C until the peptide–lipid mixture on the substrate was visibly smooth and uniform in thickness (∼3 μm). The results were well-aligned parallel bilayers, as proven by X-ray diffraction.
Lamellar diffraction of melittin–lipid multilayers was measured by θ-2θ scan in a diffractometer specialized for wet samples. The θ circle of the goniometer was vertical to allow the melittin–lipid multilayers on a horizontal substrate. This is important because the samples tend to flow in the fully hydrated condition. The raw diffraction data are shown in Fig. S2. To use the swelling method to determine the phases of the diffraction amplitudes, each sample was also scanned in less than fully hydrated conditions. The diffraction amplitudes were then converted to the electron density profile of the bilayer (Fig. S2). Across the bilayer profile, the PtP was measured for the bilayer thickness. This technique has been practiced on a variety of peptide–lipid mixtures for more than a decade (31, 35, 53). The errors of the PtP values (∼±0.1 Å) were estimated by reproducibility using independently prepared samples. The value of h can be obtained from the PtP by  , namely, PtP minus twice the length of the glycerol region (from the phosphate to the first methylene of the hydrocarbon chains) (54).
The orientation of melittin helices in multiple bilayers was measured by the method of OCD (29). The reference spectra, one for the helices oriented parallel to the plane of bilayers (the S spectrum) and one for the helices oriented perpendicular to the plane of bilayers (the I spectrum), were obtained from one melittin sample in dimyristoyl phosphatidylcholine bilayers at 15 °C and 30 °C, respectively (11). Each sample was measured at least five times and averaged. The background spectrum for each sample was measured for the same amount of lipid on the same substrate. After the background correction, each OCD spectrum of melittin in the 7:3 DOPC/DOPG mixture was fit as a linear superposition of I and S spectra (Fig. S3). The fraction of melittin helices oriented normal to the plane of membrane as a function of the P/L is shown in Fig. 2.
Grazing-Angle X-Ray Anomalous Diffraction.
Grazing-angle diffraction was used to reconstruct the lipidic structure of the melittin pore. The experiment was performed at beamlines BL23A and BL13A of the National Synchrotron Radiation Research Center in Hsin-Chu, Taiwan. The detail of the experimental setup was described by Qian et al. (38). Samples of melittin–lipid [di18:0(9,10Br)PC] mixtures at P/Ls of 1:25 and 1:40 were each prepared and organized into oriented multiple layers in full hydration. OCD (29) of the sample showed that a finite fraction of melittin helices were oriented perpendicular to the plane of the bilayers in each sample. We know from previous neutron studies that the formation of pores in multilayers is coincidental with the appearance of peptide helices in the normal orientation (11, 33, 39). When such a lamellar phase was gradually dehydrated, we could see by the changes of the diffraction pattern that the pores became correlated and developed into a periodically ordered lattice of the rhombohedral symmetry (22, 36, 55). The R phase of the melittin–di18:0(9,10Br)PC mixture appeared as the relative humidity (RH) if the sample chamber was lowered to less than 57% RH at 30 °C. We chose to analyze the data of the 1:40 P/L sample for its better diffraction quality. Fig. 3 shows the grazing-angle diffraction of this R phase at 45% RH.
The rhombohedral diffraction pattern in Fig. 3 is on a lattice of reciprocal vectors  ,
,  , and
, and  with the c axis normal to the lipid bilayers. The correspondent crystal axes are
  ,
,  , and
, and  . The lattice constants are
  and
and  . The cell defined by
  contains three primitive unit cells positioned at
  , and
, and  . The grazing-angle diffraction was completed by a combination of two separate scans: a grazing angle (∼0.3° relative to the substrate) off-specular scan for all (H,K,L) except (0,0,L) and a θ-2θ scan for (0,0,L) peaks. Then, the two scans were normalized to each other (38). All together, 19 independent Bragg peaks were detected and are listed in Table S2, where the symmetry-related peaks are counted as one.
We applied the method of MAD to each scan as described in previous work (38, 42). Briefly, we measured the real  and imaginary
  parts of the Br atom’s anomalous scattering factor at 10 X-ray energies below the Br K-edge at 13.474 keV. Then, we measured the diffraction at these 10 subedge X-ray energies (38). The integrated intensities of the diffraction peaks were reduced to the relative magnitudes of the diffraction amplitude
  at 10 X-ray wavelengths λ. Denote the normal diffraction amplitudes of the Br atoms as F2, the normal diffraction amplitudes of the whole system as F0, and the anomalous scattering factor of Br as
  . The lipidic structure under consideration arose spontaneously from a symmetrical bilayer of the peptide–lipid mixture. Therefore, its molecular distribution in the unit cell must be centrosymmetrical. We assume that this is the case and that the assumption will be justified by the result. Then, the amplitudes F0 and F2 are real quantities, which leads to the equation
  . On the right-hand side of this equation, the second term is about 1% of the first term due to the fact that at energies below the K edge, the values of
  are about 10% of
  (38). Therefore, we obtain the linear relation
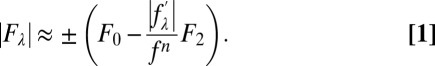 |
From Eq. 1, the magnitudes of F0, F2, and their relative phase can be obtained by a linear fit,  vs.
vs.  , as shown in Fig. S4. The result is shown in Table S2. The strong correlations of the linear fits (Fig. S4 and Table S2) indicate the excellent quality of the data and also justify the assumption of centrosymmetry (because the linear relation of Eq. 1 would not be valid without this assumption).
Phase Determination.
We have extensive experience in using the Br-MAD method to solve the structures of lipid phases, including a hexagonal phase (56), a distorted hexagonal phase (57), two different transmembrane pore structures in the R phase (38, 41), and the structure of a prestalk intermediate state of membrane fusion in a tetragonal phase (58). To solve the phase problems for these structures, we have made use of the Patterson function (38, 56, 57), the swelling method (41), and modeling methods (38, 56, 57). Through this experience, we have realized that we could have chosen the correct phases by examining all the possible phase combinations and obtained the same results.
This is possible because the correct electron distributions must satisfy the constraint that lipid molecules in water always form continuous layers (59). In the present case, the Br atoms must form layers that make physical sense. We examined all the possible phase combinations by allowing each  to take a phase of either 0 or π. We found the only phase combination that makes the electron density distribution a continuous layer of Br atoms, as shown in Fig. 4. This phase combination is shown in Table S2. We also found that these phases are identical to the phases for the toroidal pore formed by Bax-α5, in which case the phases were determined by the combination of the swelling method and simultaneous determination of the structures for both F0 and F2 amplitudes (41).
The MAD analysis also determines the relative phases between F0 and F2 (Table S2). Thus, once the phases of F2 amplitudes are determined, so are the phases of F0. The electron density distribution of the whole system constructed from F0 (Fig. S1) is much less clear compared with Fig. 4, because the whole lipid structure is too complex for the small-angle diffraction. Nevertheless, the F0 construction still contains useful information (SI Text, Pore Size).
Supplementary Material
Acknowledgments
This work was supported by Taiwan National Science Council (NSC) Grant 99-2112-M-213-001 (to M.-T.L.) and NSC Grant 98-2112-M-145-001-MY3 (to W.-C.H.), as well as by National Institutes of Health Grant GM55203 and Robert A. Welch Foundation Grant C-0991 (to H.W.H.).
Footnotes
The authors declare no conflict of interest.
This article is a PNAS Direct Submission.
This article contains supporting information online at www.pnas.org/lookup/suppl/doi:10.1073/pnas.1307010110/-/DCSupplemental.
References
- 1.Habermann E. Bee and wasp venoms. Science. 1972;177(4046):314–322. doi: 10.1126/science.177.4046.314. [DOI] [PubMed] [Google Scholar]
- 2.Habermann E, Kowallek H. Modifikationen der Aminogruppen und des Tryptophans im Melittin als Mittel zur Erkennung von Struktur-Wirkungs-Beziehungen. Hoppe Seylers Z Physiol Chem. 1970;351(7):884–890. German. [PubMed] [Google Scholar]
- 3.Bucki R, et al. Antibacterial activities of rhodamine B-conjugated gelsolin-derived peptides compared to those of the antimicrobial peptides cathelicidin LL37, magainin II, and melittin. Antimicrob Agents Chemother. 2004;48(5):1526–1533. doi: 10.1128/AAC.48.5.1526-1533.2004. [DOI] [PMC free article] [PubMed] [Google Scholar]
- 4.Tosteson MT, Tosteson DC. The sting. Melittin forms channels in lipid bilayers. Biophys J. 1981;36(1):109–116. doi: 10.1016/S0006-3495(81)84719-4. [DOI] [PMC free article] [PubMed] [Google Scholar]
- 5.Boman HG, Marsh J, Goode JA, editors. Antimicrobial Peptides. Vol 186. Chichester, UK: Wiley; 1994. [Google Scholar]
- 6.Zasloff M. Antimicrobial peptides of multicellular organisms. Nature. 2002;415(6870):389–395. doi: 10.1038/415389a. [DOI] [PubMed] [Google Scholar]
- 7.Merrifield RB, Merrifield EL, Juvvadi P, Andreu D, Boman HG. Design and synthesis of antimicrobial peptides. In: Boman HG, Marsh J, Goode JA, editors. Antimicrobial Peptides. Chichester, UK: Wiley; 1994. pp. 5–26. [PubMed] [Google Scholar]
- 8.Dawson CR, Drake AF, Helliwell J, Hider RC. The interaction of bee melittin with lipid bilayer membranes. Biochim Biophys Acta. 1978;510(1):75–86. doi: 10.1016/0005-2736(78)90131-1. [DOI] [PubMed] [Google Scholar]
- 9.Terwilliger TC, Weissman L, Eisenberg D. The structure of melittin in the form I crystals and its implication for melittin’s lytic and surface activities. Biophys J. 1982;37(1):353–361. doi: 10.1016/S0006-3495(82)84683-3. [DOI] [PMC free article] [PubMed] [Google Scholar]
- 10.Dempsey CE. The actions of melittin on membranes. Biochim Biophys Acta. 1990;1031(2):143–161. doi: 10.1016/0304-4157(90)90006-x. [DOI] [PubMed] [Google Scholar]
- 11.Yang L, Harroun TA, Weiss TM, Ding L, Huang HW. Barrel-stave model or toroidal model? A case study on melittin pores. Biophys J. 2001;81(3):1475–1485. doi: 10.1016/S0006-3495(01)75802-X. [DOI] [PMC free article] [PubMed] [Google Scholar]
- 12.Sansom MS. The biophysics of peptide models of ion channels. Prog Biophys Mol Biol. 1991;55(3):139–235. doi: 10.1016/0079-6107(91)90004-c. [DOI] [PubMed] [Google Scholar]
- 13.Wu Y, et al. Permeation of styryl dyes through nanometer-scale pores in membranes. Biochemistry. 2011;50(35):7493–7502. doi: 10.1021/bi2006288. [DOI] [PMC free article] [PubMed] [Google Scholar]
- 14.Boman HG, Wade D, Boman IA, Wåhlin B, Merrifield RB. Antibacterial and antimalarial properties of peptides that are cecropin-melittin hybrids. FEBS Lett. 1989;259(1):103–106. doi: 10.1016/0014-5793(89)81505-4. [DOI] [PubMed] [Google Scholar]
- 15.DeGrado WF, Kezdy FJ, Kaiser ET. Design, synthesis and characterization of a cytotoxic peptide with melittin-like activity. J Am Chem Soc. 1981;103(3):679–681. [Google Scholar]
- 16.Hanke W, et al. Melittin and a chemically modified trichotoxin form alamethicin-type multi-state pores. Biochim Biophys Acta. 1983;727(1):108–114. doi: 10.1016/0005-2736(83)90374-7. [DOI] [PubMed] [Google Scholar]
- 17.Katsu T, et al. Action mechanism of amphipathic peptides gramicidin S and melittin on erythrocyte membrane. Biochim Biophys Acta. 1988;939(1):57–63. doi: 10.1016/0005-2736(88)90047-8. [DOI] [PubMed] [Google Scholar]
- 18.Ladokhin AS, Selsted ME, White SH. Sizing membrane pores in lipid vesicles by leakage of co-encapsulated markers: pore formation by melittin. Biophys J. 1997;72(4):1762–1766. doi: 10.1016/S0006-3495(97)78822-2. [DOI] [PMC free article] [PubMed] [Google Scholar]
- 19.Steiner H, Andreu D, Merrifield RB. Binding and action of cecropin and cecropin analogues: Antibacterial peptides from insects. Biochim Biophys Acta. 1988;939(2):260–266. doi: 10.1016/0005-2736(88)90069-7. [DOI] [PubMed] [Google Scholar]
- 20.Last NB, Miranker AD. Common mechanism unites membrane poration by amyloid and antimicrobial peptides. Proc Natl Acad Sci USA. 2013;110(16):6382–6387. doi: 10.1073/pnas.1219059110. [DOI] [PMC free article] [PubMed] [Google Scholar]
- 21.Lauterwein J, Bösch C, Brown LR, Wüthrich K. Physicochemical studies of the protein-lipid interactions in melittin-containing micelles. Biochim Biophys Acta. 1979;556(2):244–264. doi: 10.1016/0005-2736(79)90046-4. [DOI] [PubMed] [Google Scholar]
- 22.Yang L, Weiss TM, Lehrer RI, Huang HW. Crystallization of antimicrobial pores in membranes: Magainin and protegrin. Biophys J. 2000;79(4):2002–2009. doi: 10.1016/S0006-3495(00)76448-4. [DOI] [PMC free article] [PubMed] [Google Scholar]
- 23.Matsuzaki K, Yoneyama S, Miyajima K. Pore formation and translocation of melittin. Biophys J. 1997;73(2):831–838. doi: 10.1016/S0006-3495(97)78115-3. [DOI] [PMC free article] [PubMed] [Google Scholar]
- 24.Lee MT, Hung WC, Chen FY, Huang HW. Mechanism and kinetics of pore formation in membranes by water-soluble amphipathic peptides. Proc Natl Acad Sci USA. 2008;105(13):5087–5092. doi: 10.1073/pnas.0710625105. [DOI] [PMC free article] [PubMed] [Google Scholar]
- 25.Longo ML, Waring AJ, Gordon LM, Hammer DA. Area expansion and permeation of phospholipid membrane bilayer by influenza fusion peptides and melittin. Langmuir. 1998;14:2385–2395. [Google Scholar]
- 26.Kwok R, Evans E. Thermoelasticity of large lecithin bilayer vesicles. Biophys J. 1981;35(3):637–652. doi: 10.1016/S0006-3495(81)84817-5. [DOI] [PMC free article] [PubMed] [Google Scholar]
- 27.Sun Y, Hung WC, Chen FY, Lee CC, Huang HW. Interaction of tea catechin (-)-epigallocatechin gallate with lipid bilayers. Biophys J. 2009;96(3):1026–1035. doi: 10.1016/j.bpj.2008.11.007. [DOI] [PMC free article] [PubMed] [Google Scholar]
- 28.Evans E, Heinrich V, Ludwig F, Rawicz W. Dynamic tension spectroscopy and strength of biomembranes. Biophys J. 2003;85(4):2342–2350. doi: 10.1016/s0006-3495(03)74658-x. [DOI] [PMC free article] [PubMed] [Google Scholar]
- 29.Wu Y, Huang HW, Olah GA. Method of oriented circular dichroism. Biophys J. 1990;57(4):797–806. doi: 10.1016/S0006-3495(90)82599-6. [DOI] [PMC free article] [PubMed] [Google Scholar]
- 30.Huang HW. Action of antimicrobial peptides: Two-state model. Biochemistry. 2000;39(29):8347–8352. doi: 10.1021/bi000946l. [DOI] [PubMed] [Google Scholar]
- 31.Lee MT, Chen FY, Huang HW. Energetics of pore formation induced by membrane active peptides. Biochemistry. 2004;43(12):3590–3599. doi: 10.1021/bi036153r. [DOI] [PubMed] [Google Scholar]
- 32.Lee MT, Hung WC, Chen FY, Huang HW. Many-body effect of antimicrobial peptides: On the correlation between lipid’s spontaneous curvature and pore formation. Biophys J. 2005;89(6):4006–4016. doi: 10.1529/biophysj.105.068080. [DOI] [PMC free article] [PubMed] [Google Scholar]
- 33.Ludtke SJ, et al. Membrane pores induced by magainin. Biochemistry. 1996;35(43):13723–13728. doi: 10.1021/bi9620621. [DOI] [PubMed] [Google Scholar]
- 34.Sun Y, Lee CC, Chen TH, Huang HW. Kinetic process of beta-amyloid formation via membrane binding. Biophys J. 2010;99(2):544–552. doi: 10.1016/j.bpj.2010.04.045. [DOI] [PMC free article] [PubMed] [Google Scholar]
- 35.Lee CC, Sun Y, Huang HW. Membrane-mediated peptide conformation change from alpha-monomers to beta-aggregates. Biophys J. 2010;98(10):2236–2245. doi: 10.1016/j.bpj.2010.02.001. [DOI] [PMC free article] [PubMed] [Google Scholar]
- 36.Yang L, Weiss TM, Harroun TA, Heller WT, Huang HW. Supramolecular structures of peptide assemblies in membranes by neutron off-plane scattering: Method of analysis. Biophys J. 1999;77(5):2648–2656. doi: 10.1016/S0006-3495(99)77099-2. [DOI] [PMC free article] [PubMed] [Google Scholar]
- 37.Baumann G, Mueller P. A molecular model of membrane excitability. J Supramol Struct. 1974;2(5-6):538–557. doi: 10.1002/jss.400020504. [DOI] [PubMed] [Google Scholar]
- 38.Qian S, Wang W, Yang L, Huang HW. Structure of the alamethicin pore reconstructed by x-ray diffraction analysis. Biophys J. 2008;94(9):3512–3522. doi: 10.1529/biophysj.107.126474. [DOI] [PMC free article] [PubMed] [Google Scholar]
- 39.He K, Ludtke SJ, Worcester DL, Huang HW. Neutron scattering in the plane of membranes: Structure of alamethicin pores. Biophys J. 1996;70(6):2659–2666. doi: 10.1016/S0006-3495(96)79835-1. [DOI] [PMC free article] [PubMed] [Google Scholar]
- 40.Matsuzaki K, Murase O, Fujii N, Miyajima K. An antimicrobial peptide, magainin 2, induced rapid flip-flop of phospholipids coupled with pore formation and peptide translocation. Biochemistry. 1996;35(35):11361–11368. doi: 10.1021/bi960016v. [DOI] [PubMed] [Google Scholar]
- 41.Qian S, Wang W, Yang L, Huang HW. Structure of transmembrane pore induced by Bax-derived peptide: Evidence for lipidic pores. Proc Natl Acad Sci USA. 2008;105(45):17379–17383. doi: 10.1073/pnas.0807764105. [DOI] [PMC free article] [PubMed] [Google Scholar]
- 42.Wang W, et al. Method of x-ray anomalous diffraction for lipid structures. Biophys J. 2006;91(2):736–743. doi: 10.1529/biophysj.105.080267. [DOI] [PMC free article] [PubMed] [Google Scholar]
- 43.Helfrich W. Elastic properties of lipid bilayers: Theory and possible experiments. Z Naturforsch C. 1973;28(11):693–703. doi: 10.1515/znc-1973-11-1209. [DOI] [PubMed] [Google Scholar]
- 44.Campelo F, McMahon HT, Kozlov MM. The hydrophobic insertion mechanism of membrane curvature generation by proteins. Biophys J. 2008;95(5):2325–2339. doi: 10.1529/biophysj.108.133173. [DOI] [PMC free article] [PubMed] [Google Scholar]
- 45.Huang HW, Chen FY, Lee MT. Molecular mechanism of Peptide-induced pores in membranes. Phys Rev Lett. 2004;92(19):198304. doi: 10.1103/PhysRevLett.92.198304. [DOI] [PubMed] [Google Scholar]
- 46.Moon CP, Fleming KG. Side-chain hydrophobicity scale derived from transmembrane protein folding into lipid bilayers. Proc Natl Acad Sci USA. 2011;108(25):10174–10177. doi: 10.1073/pnas.1103979108. [DOI] [PMC free article] [PubMed] [Google Scholar]
- 47.Hessa T, et al. Recognition of transmembrane helices by the endoplasmic reticulum translocon. Nature. 2005;433(7024):377–381. doi: 10.1038/nature03216. [DOI] [PubMed] [Google Scholar]
- 48.Huang HW. Free energies of molecular bound states in lipid bilayers: Lethal concentrations of antimicrobial peptides. Biophys J. 2009;96(8):3263–3272. doi: 10.1016/j.bpj.2009.01.030. [DOI] [PMC free article] [PubMed] [Google Scholar]
- 49.Schümann M, Dathe M, Wieprecht T, Beyermann M, Bienert M. The tendency of magainin to associate upon binding to phospholipid bilayers. Biochemistry. 1997;36(14):4345–4351. doi: 10.1021/bi962304x. [DOI] [PubMed] [Google Scholar]
- 50.Angelova MI. Liposome electroformation. In: Luisi PL, Walde P, editors. Giant Vesicles. Chichester, UK: Wiley; 2000. pp. 27–36. [Google Scholar]
- 51.Wimley WC, Hristova K. Antimicrobial peptides: Successes, challenges and unanswered questions. J Membr Biol. 2011;239(1-2):27–34. doi: 10.1007/s00232-011-9343-0. [DOI] [PMC free article] [PubMed] [Google Scholar]
- 52.Ludtke S, He K, Huang H. Membrane thinning caused by magainin 2. Biochemistry. 1995;34(51):16764–16769. doi: 10.1021/bi00051a026. [DOI] [PubMed] [Google Scholar]
- 53.Weiss TM, van der Wel PC, Killian JA, Koeppe RE, 2nd, Huang HW. Hydrophobic mismatch between helices and lipid bilayers. Biophys J. 2003;84(1):379–385. doi: 10.1016/S0006-3495(03)74858-9. [DOI] [PMC free article] [PubMed] [Google Scholar]
- 54.McIntosh TJ, Simon SA. Area per molecule and distribution of water in fully hydrated dilauroylphosphatidylethanolamine bilayers. Biochemistry. 1986;25(17):4948–4952. doi: 10.1021/bi00365a034. [DOI] [PubMed] [Google Scholar]
- 55.Yang L, Harroun TA, Heller WT, Weiss TM, Huang HW. Neutron off-plane scattering of aligned membranes. I. Method Of measurement. Biophys J. 1998;75(2):641–645. doi: 10.1016/S0006-3495(98)77554-X. [DOI] [PMC free article] [PubMed] [Google Scholar]
- 56.Pan D, Wang W, Liu W, Yang L, Huang HW. Chain packing in the inverted hexagonal phase of phospholipids: A study by X-ray anomalous diffraction on bromine-labeled chains. J Am Chem Soc. 2006;128(11):3800–3807. doi: 10.1021/ja058045t. [DOI] [PMC free article] [PubMed] [Google Scholar]
- 57.Wang W, Yang L, Huang HW. Evidence of cholesterol accumulated in high curvature regions: Implication to the curvature elastic energy for lipid mixtures. Biophys J. 2007;92(8):2819–2830. doi: 10.1529/biophysj.106.097923. [DOI] [PMC free article] [PubMed] [Google Scholar]
- 58.Qian S, Huang HW. A novel phase of compressed bilayers that models the prestalk transition state of membrane fusion. Biophys J. 2012;102(1):48–55. doi: 10.1016/j.bpj.2011.11.4009. [DOI] [PMC free article] [PubMed] [Google Scholar]
- 59.Luzzati V, Gulik-Krzywicki T, Rivas E, Reiss-Husson F, Rand RP. X-ray study of model systems: Structure of the lipid-water phases in correlation with the chemical composition of the lipids. J Gen Physiol. 1968;51(5):37–43. [PMC free article] [PubMed] [Google Scholar]
Associated Data
This section collects any data citations, data availability statements, or supplementary materials included in this article.