

Significance
Hypertension, one of the most common morbidity factors worldwide, is caused mostly by a deregulation of salt transport by the kidney, but underlying mechanisms remain elusive. The serine-threonine kinase With No lysine (K) 1 (WNK1) has been identified as a regulator of ion transport in the distal nephron, because its mutations cause Familial Hyperkalemic Hypertension (FHHt), a rare form of human hypertension. We generated a mouse model of WNK1-FHHt that fully recapitulates the disease and studied changes in expression of the Na+ and K+ transporters and channels involved in the maintenance of a correct blood pressure. Our study provides insights into the mechanisms underlying the pathogenesis of WNK1-FHHt and further corroborates the importance of WNK1 in ion homeostasis and blood pressure.
Keywords: sodium transport, transgenic mouse, potassium balance
Abstract
Large deletions in the first intron of the With No lysine (K) 1 (WNK1) gene are responsible for Familial Hyperkalemic Hypertension (FHHt), a rare form of human hypertension associated with hyperkalemia and hyperchloremic metabolic acidosis. We generated a mouse model of WNK1-associated FHHt to explore the consequences of this intronic deletion. WNK1+/FHHt mice display all clinical and biological signs of FHHt. This phenotype results from increased expression of long WNK1 (L-WNK1), the ubiquitous kinase isoform of WNK1, in the distal convoluted tubule, which in turn, stimulates the activity of the Na–Cl cotransporter. We also show that the activity of the epithelial sodium channel is not altered in FHHt mice, suggesting that other mechanisms are responsible for the hyperkalemia and acidosis in this model. Finally, we observe a decreased expression of the renal outer medullary potassium channel in the late distal convoluted tubule of WNK1+/FHHt mice, which could contribute to the hyperkalemia. In summary, our study provides insights into the in vivo mechanisms underlying the pathogenesis of WNK1-mediated FHHt and further corroborates the importance of WNK1 in ion homeostasis and blood pressure.
Familial Hyperkalemic Hypertension (FHHt) is a rare disorder featuring hypertension, hyperkalemia, and hyperchloremic metabolic acidosis (Online Mendelian Inheritance in Man, OMIM, 145260) (1, 2). Twelve years ago, mutations in the With No lysine (K) 1 (WNK1) and WNK4 genes were shown to cause FHHt (3), initiating a field of extensive research on the regulation of blood pressure and ion homeostasis by these two serine-threonine kinases of the WNK family (review in ref. 4). Many questions, however, regarding their physiological roles and the mechanisms of WNK1-related FHHt still remain.
The human mutations identified at the WNK1 locus do not modify the coding sequence but are large deletions in the 60-kb-long first intron, which result in an overexpression of WNK1 in the leukocytes of patients (3). The WNK1 gene generates two isoforms through alternative promoters. The long isoform, long WNK1 (L-WNK1), is expressed ubiquitously, whereas the shorter isoform, kidney-specific WNK1 (KS-WNK1), which lacks a functional kinase domain, is expressed specifically in the kidney (5). In the kidney, L-WNK1 is expressed at a low level in all nephron segments, whereas KS-WNK1 is expressed only in the distal nephron (6). We previously generated a transgenic mouse model that exhibited an ectopic expression of KS-WNK1 and an increased expression of L-WNK1 in the distal nephron on deletion of the first intron (7). This model, however, did not allow the study of the functional consequences of the deletion of WNK1 first intron, because a reporter gene was inserted under the control of each WNK1 promoter within the transgene.
Several in vitro experiments suggest that an increase in L-WNK1 expression in the distal nephron could trigger the development of FHHt. The kinase can, indeed, stimulate the activity of the Na+–Cl− cotransporter (NCC), which has been established as an essential component of the FHHt phenotype, through its interaction with either WNK4 and/or Ste20-related proline-alanine rich kinase (SPAK) (review in ref. 4). WNK4 inhibits NCC, and L-WNK1 relieves the cotransporter from this inhibition. L-WNK1 phosphorylates and thus, activates SPAK, which in turn, stimulates NCC membrane expression by phosphorylation. However, the characterization of L-WNK1 function in the distal nephron has been hampered by the absence of a valid mouse model, because L-WNK1 inactivation results in embryonic death caused by cardiovascular defects (8, 9).
To understand how the intronic deletion leads to FHHt, we generated a mouse model harboring a heterozygous deletion in the endogenous first intron of WNK1 to reproduce the human genetic situation. These mice exhibit hyperkalemia, hypertension, and metabolic acidosis, which seem to result from NCC activation. This phenotype results from a twofold increase in L-WNK1 expression in the distal convoluted tubule (DCT) and a slightly increased expression of L-WNK1 in the connecting tubule (CNT), with no modification of KS-WNK1 expression. We also show that the activity of epithelial sodium (Na) channel (ENaC) is not altered in WNK1+/FHHt mice, whereas the expression of renal outer medullary potassium (K) channel (ROMK) is decreased in the late DCT and CNT; this finding suggests that the hyperkalemia observed in WNK1+/FHHt is not caused by decreased ENaC activity but, at least in part, by a decreased K+ excretion caused by the inhibition of ROMK by L-WNK1.
Results
Generation of WNK1+/FHHt Mice.
We used homologous recombination in ES cells to create a mutant allele of WNK1 (WNK1+/i1loxneo), in which two loxP sites were inserted at each extremity of the first intron of the gene (Fig. S1). Details on the generation of the targeting vector, ES cell clones, and corresponding mice are given in SI Materials and Methods. Chimeric males, obtained by injection of one ES cell clone, were crossed with C57BL/6N females to produce WNK1+/i1loxneo animals, which were then bred with hACTBFLPe mice to remove both the neo and puro resistance cassettes, inserted with the loxP sites. The resulting mice, WNK1+/i1lox, were then crossed with pgk-Crem transgenic mice, thereby generating the WNK1+/FHHt animals by deletion of the WNK1 first intron. For all experiments, WNK1+/i1lox littermates were used as controls; these animals display normal WNK1 expression, plasma electrolytes, and blood gas (Fig. S2).
WNK1+/FHHt Mice Display Hyperkalemic Hypertension.
Compared with WNK1+/i1lox mice, WNK1+/FHHt mice exhibited hyperkalemia and hyperchloremic metabolic acidosis, two typical features of FHHt (Table 1). The 24-h urinary aldosterone excretion was increased in WNK1+/FHHt mice compared with their control WNK1+/i1lox littermates, presumably in response to the elevated plasma K+ concentration (Table 1). WNK1+/FHHt mice had similar K+ and NH4+ urinary excretion to WNK1+/i1lox mice, indicating the inability of WNK1+/FHHt kidneys to increase K+ and H+ secretion in response to the hyperkalemic acidosis. Glomerular filtration rate was normal. There was no difference in serum Ca2+, Mg2+, and PO43− between genotypes (Table 1). However, WNK1+/FHHt mice displayed hypercalciuria, which was greatly amplified when mice were fed a high Na+ (3%) diet (8.7 ± 0.9 mmol/mmol creatinine in WNK1+/FHHt mice vs. 1.6 ± 0.2 mmol/mmol creatinine in WNK1+/i1lox mice; P < 5 × 10⁻⁴).
Table 1.
Blood and urine electrolytes and 24-h urinary aldosterone level in WNK1+/i1lox and WNK1+/FHHt mice at baseline
| Electrolytes | WNK1+/i1lox (n = 8) | WNK1+/FHHt (n = 8) |
| Plasma | ||
| Na+ (mmol/L) | 149.6 ± 0.5 | 151.4 ± 0.5* |
| K+ (mmol/L) | 4.55 ± 0.15 | 6.00 ± 0.27† |
| Cl− (mmol/L) | 112.1 ± 0.3 | 116.3 ± 0.3† |
| pH | 7.31 ± 0.02 | 7.21 ± 0.03* |
| HCO3− (mmol/L) | 23.5 ± 0.8 | 18.4 ± 0.03‡ |
| Ca2+ (mmol/L) | 2.18 ± 0.02 | 2.18 ± 0.03 |
| Mg2+ (mmol/L) | 0.91 ± 0.03 | 0.90 ± 0.03 |
| PO43− (mmol/L) | 2.82 ± 0.17 | 2.81 ± 0.10 |
| Hematocrit | 47.6 ± 1.6 | 46.2 ± 1.3 |
| Urine | ||
| Na+ (mmol/mmol Creat) | 35.9 ± 3.1 | 35.4 ± 2.2 |
| K+ (mmol/mmol Creat) | 114.1 ± 8.2 | 114.2 ± 9.9 |
| Cl− (mmol/mmol Creat) | 56.9 ± 3.9 | 56.9 ± 4.6 |
| NH4+ (mmol/mmol Creat) | 7.98 ± 1.17 | 6.68 ± 0.54 |
| Ca2+ (mmol/mmol Creat) | 0.37 ± 0.04 | 0.98 ± 0.13‡ |
| Mg2+ (mmol/mmol Creat) | 6.63 ± 1.10 | 7.86 ± 0.73 |
| PO43− (mmol/mmol Creat) | 25.6 ± 2.2 | 23.6 ± 1.6 |
| 24-h aldosterone (pmol) | 14.6 ± 2.0 | 27 ± 1.9† |
| GFR (µL/min) | 142.3 ± 12.6 | 122.1 ± 12.6 |
Creat, creatinine; GFR, glomerular filtration rate.
P < 0.05 compared with the control group.
P < 0.0005 compared with the control group.
P < 0.005 compared with the control group.
Hematocrit values were significantly lower in WNK1+/FHHt mice (Table 1), suggesting the presence of hypervolemia. Accordingly, renin mRNA expression in the kidney cortex, assessed by quantitative RT-PCR (RT-qPCR), was significantly lower in WNK1+/FHHt mice (Fig. 1A). Systolic blood pressure (SBP), recorded by radiotelemetry, was higher in WNK1+/FHHt mice than WNK1+/i1lox mice (Fig. 1 B and C and Fig. S3). In addition, SBP was slightly and transiently increased in the WNK1+/FHHt group when their diet was changed from a normal (0.3% Na+) to a high (3% Na+) salt diet, whereas the SBP of the control group was not modified (Fig. 1 D and E).
Fig. 1.

WNK1+/FHHt mice display signs of hypervolemia. (A) Quantification of the expression level of Renin transcripts in the kidney cortex of mice WNK1+/FHHt (n = 7) and control littermates (WNK1+/i1lox; n = 6) by real-time RT-qPCR showed that expression of Renin is significantly decreased in WNK1+/FHHt males (**P < 0.01). Results (mean ± SEM) are expressed in arbitrary units relative to the expression of ubc, and the expression level in WNK1+/i1lox mice was arbitrarily set to one. (B) Profiles over 24 h in SBP under a 12:12-h day:night (7:00 AM to 7:00 PM and 7:00 PM to 7:00 AM) schedule in WNK1+/i1lox (n = 7) and WNK1+/FHHt (n = 6) mice kept under a control diet (NNa; 0.3% of Na+) instrumented with a telemetric system under basal condition. Data are mean ± SEM, and each point corresponds to a 1-h average. (C) SBP is increased in WNK1+/FHHt mice (n = 6) compared with WNK1+/i1lox littermates (n = 7). Data correspond to the 12-h night period mean ± SEM. *P < 0.05 (repeated measures two-way ANOVA). (D–F) Twelve-hour average SBP (night period) was slightly and transiently increased by administration of a high salt diet (HNa; 3% NaCl) in WNK1+/FHHt mice, whereas the SBP of WNK1+/i1lox mice was not affected (E). Data are mean ± SEM. *P < 0.05 compared with WNK1+/FHHt kept under NNa (Dunnett multiple comparisons test after a one-way repeated measures ANOVA). (F) Twelve-hour average SBP (night period) was normalized in WNK1+/FHHt mice by a hydrochlorothiazide treatment during 3 d, whereas the SBP of WNK1+/i1lox mice was not modified. **P < 0.01 compared with WNK1+/FHHt mice kept under a HNa (paired Student t test). For all panels, data correspond to the 12-h night period mean ± SEM.
Deletion of WNK1 First Intron Increased Expression of L-WNK1 in the Distal Nephron.
We next assessed the consequences of the deletion of the first intron of WNK1 on the expression of L- and KS-WNK1 in microdissected nephron segments (Fig. 2). L-WNK1 transcripts levels were increased twofold in the DCT and by 20% in the CNT of WNK1+/FHHt mice. KS-WNK1 expression was not modified in any segment. Outside of the kidney, neither L-WNK1 nor KS-WNK1 mRNA expression was modified in WNK1+/FHHt mice (Fig. S4).
Fig. 2.

The deletion of WNK1 first intron leads to increased expression of L-WNK1 in the DCT and CNT. Quantification of the expression levels of (A) L-WNK1 and (B) KS-WNK1 transcripts in the cortical segments of the nephron of WNK1+/i1lox (n = 6) and WNK1+/FHHt (n = 6) mice by real-time RT-qPCR showed that expression of L-WNK1 was increased in the DCT and CNT of WNK1+/FHHt males. Results (mean ± SEM) are expressed in arbitrary units relative to the expression of ubc. *P < 0.05; ***P < 0.001 (unpaired Student t test).
L-WNK1 is expressed in mouse arteries, where it regulates vasoconstriction in response to α-adrenergic stimulation (10). An activation of L-WNK1 in the vasculature could, therefore, contribute to the modest increase in blood pressure observed in WNK1+/FHHt mice. However, L-WNK1 mRNA expression tended to be decreased in the aorta of WNK1+/FHHt mice (1.00 ± 0.15 in WNK1+/i1lox mice vs. 0.48 ± 0.19 in WNK1+/FHHt mice, P = 0.054). This decrease probably reflects an adaptation to the increased blood pressure rather than a direct consequence of the intronic deletion.
Deletion of WNK1 First Intron Leads to Increased NCC Expression and Activity.
Treating patients or mouse models of FHHt caused by WNK4 mutations with hydrochlorothiazide, a blocker of the NCC, corrects all of the symptoms of FHHt. The phenotype of WNK1+/FHHt mice was also dramatically improved by this treatment, because a 3-d administration of hydrochlorothiazide (HCTZ) normalized both the biological and blood pressure abnormalities of WNK1+/FHHt mice (Fig. 1 D and E and Table S1). Correction of metabolic acidosis was even more rapid, because hyperchloremia was corrected 3 h after injection of HCTZ (Fig. S5).
We, therefore, quantified NCC expression and phosphorylation. Immunoblots, performed on membrane-enriched fraction of the renal cortex, showed that NCC abundance and phosphorylation were increased twofold (Fig. 3, Left). This increase was associated with a significant increase in the DCT fractional volume in WNK1+/FHHt mice (7.4 ± 0.4 in WNK1+/i1lox mice vs. 11.5 ± 0.2 in WNK1+/FHHt mice, P = 0.03) (Fig. S6). NCC transcription was also increased by the same order of magnitude in the renal cortex of WNK1+/FHHt mice (1.0 ± 0.1 in WNK1+/i1lox mice vs. 1.7 ± 0.1 in WNK1+/FHHt mice, P < 0.001, n = 6 per group).
Fig. 3.
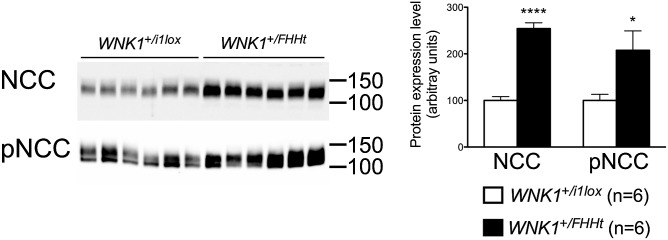
The expression, phosphorylation, and transcriptional expression of the NCC are increased in WNK1+/FHHt mice. (Left) Representative immunoblots performed on the membrane-enriched fractions of the renal cortex of control and WNK1+/FHHt males (n = 6 per group) incubated with anti-NCC and antiphospho-NCC (pNCC) antibodies. (Right) Densitometric analysis showed that the abundance and phosphorylation of NCC were significantly increased in WNK1+/FHHt mice (black bars) compared with controls (open bars). Data are mean ± SEM. *P < 0.05; ****P < 0.0001 (unpaired Student t test).
In vitro studies indicate that L-WNK1 could activate NCC through the phosphorylation of the SPAK kinase on the Thr243 residue (T loop) (11). WNK1 also phosphorylates SPAK on Ser383 (S motif), but the role of this residue remains unclear (11). SPAK expression and phosphorylation on Ser383 were similar between WNK1+/FHHt mice and their control littermates on immunoblots performed on whole-kidney cortex homogenates (Fig. 4). SPAK is, however, expressed in not only the DCT but also the thick ascending limb of Henle’s loop, thereby precluding the quantification of SPAK modifications specifically in the DCT (12). We, therefore, used immunofluorescence and confocal microscopy to evaluate SPAK phosphorylation in the DCT. This technique also allowed us to study the phosphorylation of the T loop, which is too low in whole-kidney homogenate to be quantified by immunoblot (12). Using an antibody recognizing the phosphorylated T loop of SPAK, we observed a twofold increase in signal intensity near the apical membrane in the DCT of WNK1+/FHHt mice (1 µm from the apical membrane) (Fig. S7). The same observation was made using an antibody recognizing the phosphorylated S motif (Fig. S7). These observations suggest that SPAK cellular localization is modified by L-WNK1 overexpression.
Fig. 4.
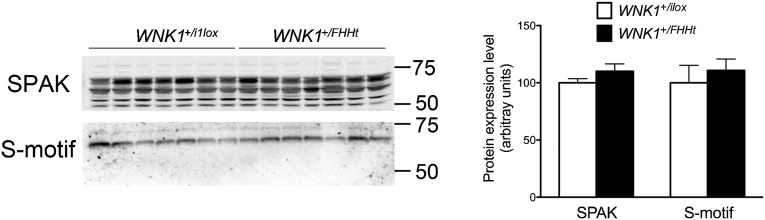
The abundance of the phosphorylated form of SPAK is not affected in homogenates of kidney cortex from WNK1+/FHHt mice. (Left) Representative immunoblots performed on renal cortex homogenates from control and WNK1+/FHHt males (n = 7 per group) incubated with antibodies raised against SPAK and the phosphorylated SPAK/OSR1 S motif. (Right) Densitometric analysis showed that the abundance of SPAK and its phosphorylated form on Ser343 is not modified in homogenates of cortex isolated from WNK1+/FHHt kidneys compared with control kidneys. Data are mean ± SEM.
Conserved ENaC Activity and Decreased ROMK Expression in WNK1+/FHHt Mice.
The proposed model used to explain all of the clinical signs of FHHt is described as follows: the increased Na+ and Cl− reabsorption by NCC results in a decreased electrogenic Na+ reabsorption through ENaC and thus, an impaired electrochemical gradient essential for K+ secretion by ROMK, thereby leading to hyperkalemia. H+ secretion would be similarly impaired, thus explaining the metabolic acidosis. We tested this hypothesis in vivo in WNK1+/FHHt mice. We first quantified the expression of the full-length α-, β-, and γ-subunits of ENaC as well as the expression of the cleaved forms of the α- and γ-subunits, which are believed to reflect the activation of the channel (13, 14). Immunoblots performed on membrane-enriched preparation of renal cortex showed that the abundance of the three ENaC subunits was similar in both groups of mice (Fig. 5A). Because the level of expression is not always correlated with the level of activity of the channel, we submitted WNK1+/FHHt and WNK1+/i1lox mice to an acute injection of amiloride, a pharmacological inhibitor of ENaC. Six hours after the injection, the natriuretic and K+-sparing response to amiloride was similar between the two groups of mice (Fig. 5B), strongly suggesting that the amount of Na+ reabsorbed by ENaC in WNK1+/FHHt mice is comparable with the amount of Na+ reabsorbed in WNK1+/i1lox animals and that other mechanisms must be responsible for the hyperkalemia and hyperchloremic metabolic acidosis observed in FHHt patients and mouse models.
Fig. 5.

The expression and activity of ENaC are similar in WNK1+/i1lox and WNK1+/FHHt mice. (A, Upper) Representative immunoblots performed on membrane-enriched fractions of the renal cortex from control and WNK1+/FHHt males (n = 5 per group) incubated with antibodies raised against the α-, β-, or γ-subunit of the channel. (A, Lower) Densitometric analysis showed that the abundance of the three ENaC subunits is not modified in WNK1+/FHHt mice compared with control littermates. Data are mean ± SEM. (B) Effects of amiloride on urinary excretion of (Left) Na+ and (Right) K+ in WNK1+/i1lox and WNK1+/FHHt mice. One single dose of amiloride (12.5 mg/kg body weight; black bars) or vehicle (white bars) was administered i.p. to WNK1+/i1lox (n = 8) and WNK1+/FHHt (n = 8) mice. Urine samples were collected from 0 to 6 h after injection to measure urinary Na+ and K+ excretion. Results (mean ± SEM) are expressed as the ratio to urinary creatinine. **P < 0.01, ****P < 0.001 vs. vehicle (Bonferroni multiple comparisons test after one-way ANOVA). Ns, not significant.
Several groups have shown in vitro that L-WNK1 inhibits ROMK activity by stimulating its endocytosis (15–17). We have characterized the pattern of ROMK expression by immunofluorescence on kidney sections of control and mutant mice. The predominant expression of ROMK in the thick ascending limb of Henle's loop precluded evaluation of ROMK expression in the DCT by immunoblotting (Fig. S8). However, confocal evaluation showed that ROMK signal is decreased in the late DCT and CNT of WNK1+/FHHt mice (Fig. 6). Moreover, the late DCT and CNT of control kidneys showed prominent apical ROMK signal, which seemed rather diffused and cytoplasmic in the late DCT and CNT of WNK1+FHHt kidneys, suggesting enhanced lysosomal routing of the channel (Fig. 6). This observation was confirmed by quantification of the ROMK signal intensity near the apical membrane, which evidenced a 70% decrease in mutant late DCT and CNT compared with ROMK apical expression in control ones (50,978 ± 3,441 in WNK1+/i1lox mice vs. 16,371 ± 5,303 in WNK1+/FHHt mice, n = 4 per group, P = 0.03). In contrast, ROMK expression in the cortical collecting duct (CCD) was similar in WNK1+/i1lox and WNK1+/FHHt mice (Fig. S8). ROMK expression is, therefore, modified only in WNK1+/FHHt nephron segments where L-WNK1 expression is increased.
Fig. 6.
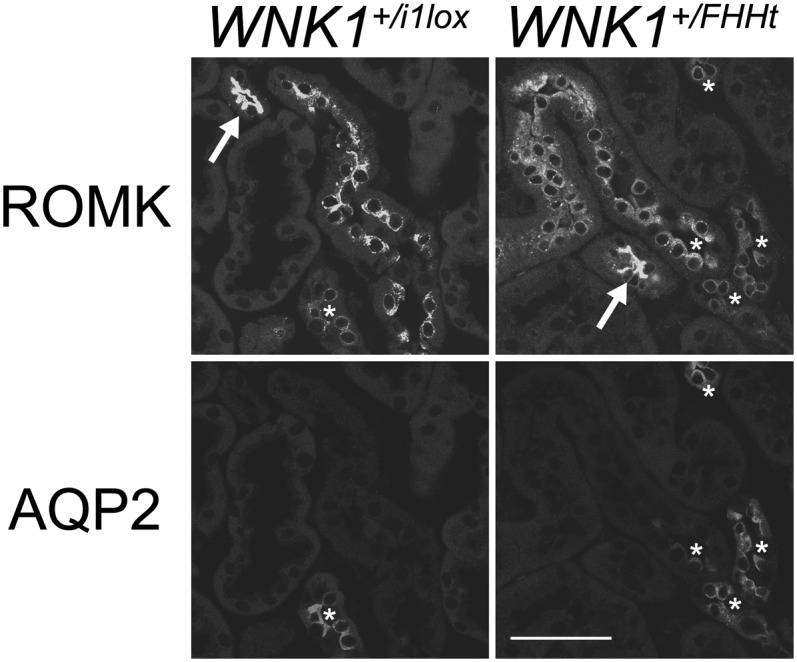
The expression of the potassium channel ROMK is decreased in the late DCT of WNK1+/FHHt. Representative images of WNK1+/i1lox and WNK1+/FHHt kidneys after double labeling for ROMK and the water channel aquaporin 2 (AQP2). (Scale bar: 50 µm.) Thick ascending limb was identified by the typical strong expression of ROMK (arrows), late DCT was identified by presence of intercalated cells but weak to absent AQP2 signal, and collecting duct was identified by presence of significant AQP2 signal. Note substantially weaker ROMK signal in the late DCT and CNT of WNK1+/FHHt kidneys compared with the controls (asterisks). Note also that the late DCT of WNK1+/i1lox kidneys shows prominent apical ROMK signal, whereas the late DCT of WNK1+FHHtx kidneys shows rather diffused and dotted cytoplasmic ROMK signal.
Discussion
To better understand the mechanisms by which the mutations identified at the WNK1 locus lead to the development of FHHt, we generated mice harboring a heterozygous deletion in the WNK1 first intron. The mice display all of the features of human FHHt (i.e., hypertension, hyperkalemia, hyperchloremic metabolic acidosis, and sensitivity to thiazide diuretics). We showed that this phenotype results from a twofold increase of L-WNK1 in the DCT and a 20% increase of L-WNK1 in the CNT, with no modification in the expression of KS-WNK1. Combined with the fact that complete inactivation of KS-WNK1 does not lead to FHHt (18), this result suggest that the net level of L-WNK1, rather than the ratio of L-WNK1 to KS-WNK1, is important for triggering WNK1-related FHHt. Interestingly, WNK1 expression level was recently reported to be inhibited through ubiquitination by the ubiquitin–ligase complex formed, in part, by KLHL3 and Cullin-3 (19), the mutations that are responsible for FHHt in almost 50% of the patients in our cohort (20). Disease-causing mutations in KLHL3 disrupt the interaction with WNK1, thus leading to an increased expression of the kinase (19, 21–23). It is, therefore, very likely that the mechanisms responsible for FHHt in patients with KLHL3 or CUL3 mutations are the same as the mechanisms at play in patients carrying a WNK1 intronic deletion.
We previously generated a mouse model bearing a transgene containing the mouse WNK1 gene modified by a conditional deletion of the first intron and insertion of two reporter genes in exons 2 and 4a to monitor the expression of L-WNK1 and KS-WNK1, respectively (7). This transgenic model led us to conclude that deletion of WNK1 first intron promotes the overexpression of both isoforms in the distal nephron and ubiquitous extrarenal expression of KS-WNK1. In contrast, WNK1+/FHHt mice showed only increased renal expression of L-WNK1 following WNK1 first intron deletion, suggesting that the renal and extrarenal increase in KS-WNK1 expression in the previous transgenic model was likely caused by an inappropriate regulation of the transgene.
The two major sites of KS-WNK1 expression in the mouse nephron are the DCT and CNT (6). L-WNK1, therefore, adopts a KS-WNK1–like pattern of expression in the nephron of WNK1+/FHHt mice. We previously identified an insulator sequence (C5) in the intronic portion deleted in all FHHt patients conserved between mice and humans (7). This insulator is able to prevent transcriptional activation by the renal enhancer located upstream of KS-WNK1 promoter. Its deletion in WNK1+/FHHt mice and FHHt patients could, therefore, cause the activation of L-WNK1 promoter by the renal enhancer, resulting in an increased expression of L-WNK1 in the DCT and CNT without affecting KS-WNK1 expression.
The complete correction of the phenotype by thiazide diuretics in both patients and mouse models (1, 24, 25), including our model, suggests that increased NCC activity is sufficient to generate hyperkalemia and metabolic acidosis. The increased Na+ reabsorption by NCC would decrease Na+ delivery to ENaC, thus impairing the electrochemical gradient required for K+ secretion by ROMK and H+ by the vacuolar H+-ATPase. Other mouse models with increased NCC activity do not, however, display hyperkalemia or metabolic acidosis (18, 26, 27). In addition, we found that ENaC activity is conserved in WNK1+/FHHt animals. Taken together, these results suggest that NCC activation is required but not sufficient to trigger FHHt. We show here that ROMK expression is inhibited in segments where L-WNK1 is overexpressed on deletion of the first intron (i.e., the DCT and CNT), whereas it is not modified in other segments (thick ascending limb and collecting duct). Moreover, ROMK expression in WNK1+/FHHt late DCT and CNT seems to be more diffuse and cytoplasmic than in WNK1+/i1lox ones, suggesting enhanced endocytosis of the channel. These observations are in agreement with in vitro studies, which showed that L-WNK1 decreases the surface expression and thus, activity of ROMK by facilitating its clathrin-mediated endocytosis (15, 16). The decrease in ROMK expression could, at least in part, account for the hyperkalemia observed in WNK1+/FHHt mice in the absence of any modification of ENaC activity.
In summary, the generation and analysis of a model of WNK1-related FHHt allowed us to formally show that the heterozygous deletion of the WNK1 first intron is, indeed, responsible for the development of the syndrome in patients carrying this type of mutation. It also allowed us to characterize the molecular consequences of this deletion and show that a net increase of L-WNK1 in the distal tubule triggers the development of FHHt through the activation of NCC, probably in a SPAK-dependent manner. The model will also be helpful to test future pharmacological agents interacting with the WNK1 pathway.
Materials and Methods
Physiological Studies.
All studies were conducted on 3- to 5-mo-old male mice and performed in accordance with the relevant guidelines of the French Ministry of Agriculture (Authorization Executive Order A751532) for scientific experimentation on animals, the European Communities Council Directive, and international ethical standards.
For basal urine collection, animals were housed in metabolic cages and fed a standard diet with free access to tap water. After a 3-d adaptation period, urines were collected daily for 3 consecutive d. For the amiloride study, a 3-d adaptation period was followed by a 2-d experimental period, with i.p. injection of the vehicle on day 1 and amiloride (1.45 µg/g in 0.9% NaCl) on day 2. Urine was collected 6 and 24 h after each injection. HCTZ (Sigma) was administered orally by mixing 2.4 mg HCTZ per 10 g body weight with 4 g grounded food, 1 mL water, and 0.08 g agar per day.
Urine and plasma creatinine and urine electrolytes were determined using an AU400 analyzer (Olympus). Urine aldosterone was measured by RIA (Siemens Healthcare). Blood gas and electrolytes were analyzed on an ABL80 analyzer (Radiometer). At the end of the experimental period, animals were anesthetized with ketamine and xylazine (0.1 and 0.01 mg/g body weight, respectively), and the tissues were collected.
Telemetry.
The catheter of the telemeter was inserted into the left carotid artery. The transmitter probe was positioned s.c. on the flank. After a 1-wk recovery period in individual cages, mice were placed on a receiver, and blood pressure and locomotor activity were recorded continuously in freely moving mice in a light/dark-cycled recording room (7:00 AM to 7:00 PM) for 3 consecutive d on a normal diet. The mice then received a high salt diet [3% (wt/wt) Na+] for 2 wk, during which time blood pressure was recorded for the first 5 and the last 3 d. Blood pressure was finally recorded during 3 d after adding thiazide treatment to the high salt diet. Additional information is provided in SI Materials and Methods.
RNA Extraction and qPCR.
Total RNA extraction, reverse transcription, and RT-qPCR were performed as described in ref. 6. Primers sequences are indicated in Table S2. Ubiquitin c (ubc) was used a reference gene, and comparative quantification of the gene of interest between the two genotypes was obtained using the 2−∆∆Ct method.
RT-qPCR from Microdissected Tubules.
Renal cortex segments from six WNK1+/Δi1 and six WNK1+/i1lox males were microdissected from liberase-treated kidneys as previously reported (28). RNA extraction, reverse transcription, and RT-qPCR were performed as described in ref. 29.
Immunoblots Analysis.
Plasma membrane-enriched fractions and whole-kidney cortex homogenates were prepared as described (28). These fractions were then submitted to SDS/PAGE electrophoresis, and immunoblotting was performed as described (30). The following antibodies were used: NCC (gift from D. Ellison, Department of Nephrology and Hypertension, Oregon Helath and Science University, Portland, OR), ENaC (α-, β-, and γ-subunits; gift from J. Loffing, Institute of Anatomy, University of Zurich, Zurich), ROMK (HPA026962; Sigma-Aldrich), NCC phospho-Thr55, SPAK, SPAK-OSR1 phospho-T243-SPAK (T loop), and phospho-S383-SPAK (S motif) (31). The last four antibodies were obtained from the Division of Signal Transduction Therapy of the University of Dundee. The specificity of the ROMK antibody was confirmed on kidney sections of ROMK−/− animals (Fig. S8).
Immunohistochemistry and Confocal Evaluation.
Mice were anesthetized with ketamine and xylazine (0.1 and 0.01 mg/g body weight, respectively) and perfusion-fixed with 3% paraformaldehyde through the heart. The kidneys were then each cut in four slices and further fixed with 3% paraformaldehyde overnight. Immunohistochemistry was performed on cryostat sections using the same antibodies as for immunoblotting, except full-length SPAK (Santa Cruz Biotechnology) was used as described in ref. 12. For confocal evaluation of DCT profiles, intensities of the fluorescent signals were scored across each profile using ZEN2008 software (Zeiss), and mean values within 1 µm distance at the apical side of each tubule were obtained. Background fluorescence determined over cell nuclei was subtracted from the signal. At least 20 similar tubular profiles per individual animal were evaluated.
Statistical Analysis.
The tests used are given in the figures. When the number of samples per group is less than five, individual values + median are shown, and comparison between genotypes or conditions was performed using a nonparametric Mann–Whitney ranking test. When there were more than five samples per group, data are given as mean ± SEM, and comparison between genotypes was performed using an unpaired Student t test. Multiple comparisons were performed using a Bonferroni multiple comparison test following one- or two-way ANOVA. Telemetry data were analyzed using a repeated-measures one- or two-way ANOVA or paired Student t test. A difference between groups was considered significant when P < 0.05.
Supplementary Material
Acknowledgments
The authors thank all the technicians of the Elevage Rongeurs Inserm for the care given to the mice and D. Eladari, R. Chambrey, and A. Rickard for careful and critical reading of the manuscript. ES cell electroporation and injection into blastocysts were performed by French National Infrastructure for Mouse Phenogenomics (PHENOMIN) [Transgénèse et Archivage d'Animaux Modèles (TAAM), Unité Propre de Service UPS44, SErvice des Animaux Transgéniques (SEAT), Centre National de la Recherche Scientifique]. E.V.-P. was a recipient of a Poste d'accueil Inserm. E.E.-M. received a fellowship from the Ministère de l'Enseignement Supérieur et de la Recherche, and S.W. received a fellowship from Institut National de la Santé et de la Recherche Médicale (INSERM). This work was supported by INSERM, the European Community's 7th Framework Program [HEALTH-F2-2007-201590; EUropean Network For the study of Orphan Nephropathies (EUNEFRON) Program], the Fondation Leducq Transatlantic Network on Hypertension, and the Agence Nationale pour la Recherche (ANR-05-MRAR-010-01).
Footnotes
The authors declare no conflict of interest.
This article is a PNAS Direct Submission.
This article contains supporting information online at www.pnas.org/lookup/suppl/doi:10.1073/pnas.1304230110/-/DCSupplemental.
References
- 1.Gordon RD, Hodsman GP. The syndrome of hypertension and hyperkalaemia without renal failure: Long term correction by thiazide diuretic. Scott Med J. 1986;31(1):43–44. doi: 10.1177/003693308603100114. [DOI] [PubMed] [Google Scholar]
- 2.Schambelan M, Sebastian A, Rector FC., Jr Mineralocorticoid-resistant renal hyperkalemia without salt wasting (type II pseudohypoaldosteronism): Role of increased renal chloride reabsorption. Kidney Int. 1981;19(5):716–727. doi: 10.1038/ki.1981.72. [DOI] [PubMed] [Google Scholar]
- 3.Wilson FH, et al. Human hypertension caused by mutations in WNK kinases. Science. 2001;293(5532):1107–1112. doi: 10.1126/science.1062844. [DOI] [PubMed] [Google Scholar]
- 4.McCormick JA, Ellison DH. The WNKs: Atypical protein kinases with pleiotropic actions. Physiol Rev. 2011;91(1):177–219. doi: 10.1152/physrev.00017.2010. [DOI] [PMC free article] [PubMed] [Google Scholar]
- 5.Delaloy C, et al. Multiple promoters in the WNK1 gene: One controls expression of a kidney-specific kinase-defective isoform. Mol Cell Biol. 2003;23(24):9208–9221. doi: 10.1128/MCB.23.24.9208-9221.2003. [DOI] [PMC free article] [PubMed] [Google Scholar]
- 6.Vidal-Petiot E, et al. A new methodology for quantification of alternatively spliced exons reveals a highly tissue-specific expression pattern of WNK1 isoforms. PLoS One. 2012;7(5):e37751. doi: 10.1371/journal.pone.0037751. [DOI] [PMC free article] [PubMed] [Google Scholar]
- 7.Delaloy C, et al. Deletion of WNK1 first intron results in misregulation of both isoforms in renal and extrarenal tissues. Hypertension. 2008;52(6):1149–1154. doi: 10.1161/HYPERTENSIONAHA.108.120899. [DOI] [PubMed] [Google Scholar]
- 8.Xie J, et al. Endothelial-specific expression of WNK1 kinase is essential for angiogenesis and heart development in mice. Am J Pathol. 2009;175(3):1315–1327. doi: 10.2353/ajpath.2009.090094. [DOI] [PMC free article] [PubMed] [Google Scholar]
- 9.Zambrowicz BP, et al. Wnk1 kinase deficiency lowers blood pressure in mice: A gene-trap screen to identify potential targets for therapeutic intervention. Proc Natl Acad Sci USA. 2003;100(24):14109–14114. doi: 10.1073/pnas.2336103100. [DOI] [PMC free article] [PubMed] [Google Scholar]
- 10.Bergaya S, et al. WNK1 regulates vasoconstriction and blood pressure response to α 1-adrenergic stimulation in mice. Hypertension. 2011;58(3):439–445. doi: 10.1161/HYPERTENSIONAHA.111.172429. [DOI] [PubMed] [Google Scholar]
- 11.Vitari AC, Deak M, Morrice NA, Alessi DR. The WNK1 and WNK4 protein kinases that are mutated in Gordon’s hypertension syndrome phosphorylate and activate SPAK and OSR1 protein kinases. Biochem J. 2005;391(Pt 1):17–24. doi: 10.1042/BJ20051180. [DOI] [PMC free article] [PubMed] [Google Scholar]
- 12.Saritas T, et al. SPAK differentially mediates vasopressin effects on sodium cotransporters. J Am Soc Nephrol. 2013;24(3):407–418. doi: 10.1681/ASN.2012040404. [DOI] [PMC free article] [PubMed] [Google Scholar]
- 13.Hughey RP, et al. Maturation of the epithelial Na+ channel involves proteolytic processing of the alpha- and gamma-subunits. J Biol Chem. 2003;278(39):37073–37082. doi: 10.1074/jbc.M307003200. [DOI] [PubMed] [Google Scholar]
- 14.Masilamani S, Kim GH, Mitchell C, Wade JB, Knepper MA. Aldosterone-mediated regulation of ENaC alpha, beta, and gamma subunit proteins in rat kidney. J Clin Invest. 1999;104(7):R19–R23. doi: 10.1172/JCI7840. [DOI] [PMC free article] [PubMed] [Google Scholar]
- 15.Cope G, et al. WNK1 affects surface expression of the ROMK potassium channel independent of WNK4. J Am Soc Nephrol. 2006;17(7):1867–1874. doi: 10.1681/ASN.2005111224. [DOI] [PubMed] [Google Scholar]
- 16.Lazrak A, Liu Z, Huang CL. Antagonistic regulation of ROMK by long and kidney-specific WNK1 isoforms. Proc Natl Acad Sci USA. 2006;103(5):1615–1620. doi: 10.1073/pnas.0510609103. [DOI] [PMC free article] [PubMed] [Google Scholar]
- 17.Wade JB, et al. WNK1 kinase isoform switch regulates renal potassium excretion. Proc Natl Acad Sci USA. 2006;103(22):8558–8563. doi: 10.1073/pnas.0603109103. [DOI] [PMC free article] [PubMed] [Google Scholar]
- 18.Hadchouel J, et al. Decreased ENaC expression compensates the increased NCC activity following inactivation of the kidney-specific isoform of WNK1 and prevents hypertension. Proc Natl Acad Sci USA. 2010;107(42):18109–18114. doi: 10.1073/pnas.1006128107. [DOI] [PMC free article] [PubMed] [Google Scholar]
- 19.Ohta A, et al. The CUL3-KLHL3 E3 ligase complex mutated in Gordon’s hypertension syndrome interacts with and ubiquitylates WNK isoforms: Disease-causing mutations in KLHL3 and WNK4 disrupt interaction. Biochem J. 2013;451(1):111–122. doi: 10.1042/BJ20121903. [DOI] [PMC free article] [PubMed] [Google Scholar]
- 20.Louis-Dit-Picard H, et al. KLHL3 mutations cause familial hyperkalemic hypertension by impairing ion transport in the distal nephron. Nat Genet. 2012;44(4):456–460. doi: 10.1038/ng.2218. [DOI] [PubMed] [Google Scholar]
- 21.Shibata S, Zhang J, Puthumana J, Stone KL, Lifton RP. Kelch-like 3 and Cullin 3 regulate electrolyte homeostasis via ubiquitination and degradation of WNK4. Proc Natl Acad Sci USA. 2013;110(19):7838–7843. doi: 10.1073/pnas.1304592110. [DOI] [PMC free article] [PubMed] [Google Scholar]
- 22.Wakabayashi M, et al. Impaired KLHL3-mediated ubiquitination of WNK4 causes human hypertension. Cell Rep. 2013;3(3):858–868. doi: 10.1016/j.celrep.2013.02.024. [DOI] [PubMed] [Google Scholar]
- 23.Wu G, Peng JB. Disease-causing mutations in KLHL3 impair its effect on WNK4 degradation. FEBS Lett. 2013;587(12):1717–1722. doi: 10.1016/j.febslet.2013.04.032. [DOI] [PMC free article] [PubMed] [Google Scholar]
- 24.Yang SS, et al. Molecular pathogenesis of pseudohypoaldosteronism type II: Generation and analysis of a Wnk4(D561A/+) knockin mouse model. Cell Metab. 2007;5(5):331–344. doi: 10.1016/j.cmet.2007.03.009. [DOI] [PubMed] [Google Scholar]
- 25.Lalioti MD, et al. Wnk4 controls blood pressure and potassium homeostasis via regulation of mass and activity of the distal convoluted tubule. Nat Genet. 2006;38(10):1124–1132. doi: 10.1038/ng1877. [DOI] [PubMed] [Google Scholar]
- 26.McCormick JA, Nelson JH, Yang CL, Curry JN, Ellison DH. Overexpression of the sodium chloride cotransporter is not sufficient to cause familial hyperkalemic hypertension. Hypertension. 2011;58(5):888–894. doi: 10.1161/HYPERTENSIONAHA.110.167809. [DOI] [PMC free article] [PubMed] [Google Scholar]
- 27.Ronzaud C, et al. Renal tubular NEDD4-2 deficiency causes NCC-mediated salt-dependent hypertension. J Clin Invest. 2013;123(2):657–665. doi: 10.1172/JCI61110. [DOI] [PMC free article] [PubMed] [Google Scholar]
- 28.Morla L, et al. Proteinase-activated receptor 2 stimulates Na,K-ATPase and sodium reabsorption in native kidney epithelium. J Biol Chem. 2008;283(42):28020–28028. doi: 10.1074/jbc.M804399200. [DOI] [PMC free article] [PubMed] [Google Scholar]
- 29.Cheval L, et al. Atlas of gene expression in the mouse kidney: New features of glomerular parietal cells. Physiol Genomics. 2011;43(3):161–173. doi: 10.1152/physiolgenomics.00093.2010. [DOI] [PubMed] [Google Scholar]
- 30.Picard N, et al. Defective ENaC processing and function in tissue kallikrein-deficient mice. J Biol Chem. 2008;283(8):4602–4611. doi: 10.1074/jbc.M705664200. [DOI] [PubMed] [Google Scholar]
- 31.Rafiqi FH, et al. Role of the WNK-activated SPAK kinase in regulating blood pressure. EMBO Mol Med. 2010;2(2):63–75. doi: 10.1002/emmm.200900058. [DOI] [PMC free article] [PubMed] [Google Scholar]
Associated Data
This section collects any data citations, data availability statements, or supplementary materials included in this article.