Abstract
A decrease in tissue oxygen levels (aka hypoxia) mediates a number of vascular retinal diseases. Despite introduction of novel therapeutics, treatment of retinal disorders remains challenging, possibly due to complex nature of hypoxia signaling. To date, the differential effect of hypoxia on expression of efflux and influx transporters in retinal cells has not been studied. Therefore, the objective of this study was to delineate molecular and functional expression of membrane transporters in human retinal pigment epithelial (RPE) cells cultured under normoxic and hypoxic conditions. Quantitative real time polymerase chain reaction (qPCR), ELISA and immunoblot analysis were performed to examine the RNA and protein expression levels of transporters. Further, functional activity was evaluated by performing the uptake of various substrates in both normoxic and hypoxic conditions. qPCR analysis showed elevated expression of efflux transporters (P-glycoprotein, multidrug resistant protein 2, breast cancer resistant protein) and influx transporters (folate receptor-α, cationic and neutral amino acid transporter, sodium dependent multivitamin transporter) in a time dependent manner. Immunoblot analysis further confirmed elevated expression of breast cancer resistant protein and sodium dependent multivitamin transporter. A decrease in the uptake of efflux transporter substrates (digoxin, lopinavir and abacavir) and enhanced uptake of influx transporter substrates (arginine, folic acid and biotin) in hypoxia relative to normoxia further confirmed elevated expression of transporters, respectively. This study demonstrates for the first time that hypoxic conditions may alter expression of efflux and influx transporters in RPE cells. These findings suggest that hypoxia may further alter disposition of ophthalmic drugs.
Keywords: Efflux and influx transporters, hypoxia, molecular expression and functional activity, retinal pigment epithelial cells
1.INTRODUCTION
Retina, a light sensitive tissue, forms the inner lining of posterior segment of the eye and is metabolically one of the most active tissues. It is highly sensitive to oxygen tension. Mammalian cells require oxygen as an electron acceptor during oxidative phosphorylation for ATP production to maintain normal metabolic functions. Oxygen serves as a major contributor for regulating membrane transport, intracellular signaling, expression of many genes, and initiation of apoptosis (Giaccia et al., 2004; Gibson et al., 2000; Lopez-Barneo et al., 2001; Semenza, 2000). Exposure to low oxygen tension even for short time periods may bring about alterations in the maintenance of oxygen homeostasis (Arjamaa and Nikinmaa, 2006). Hypoxia is a condition in which oxygen is found to be below the normal level. Many regulatory systems in the human body are activated by hypoxia and consequently cells under this hypoxic stress elicit various adaptive responses.
A master regulator of hypoxic response is hypoxia inducible factor (HIF). It is a heterodimer consisting of oxygen dependent HIF-α subunit and independent HIF-β subunit (Wang et al., 1995; Wang and Semenza, 1995). Under normal oxygen levels, HIF-α subunit is hydroxylated by prolyl hydroxylases (PHD1-3) and rapidly degraded by E3 ubiquitin-proteasome system (Epstein et al., 2001; Jaakkola et al., 2001; Jewell et al., 2001). Under hypoxic conditions, hydroxylation is inhibited due to inactive PHDs leading to translocation of HIF-α to the nucleus. HIF-α heterodimerizes with HIF-β, recruits various co-activators and binds to the pentanucleotide hypoxic response element sequence (RCGTG) to modulate the expression of various genes. To date several HIF responsive genes have been identified, which play a key role in regulating many cellular processes. Few important genes include vascular endothelial growth factor (VEGF), erythropoietin (EPO), glucose transporter-1 (GLUT-1), angiopoietin 2, endothelin-1 (ET1), heme oxygenease-1 (HO-1), nitric oxide synthase, placental growth factor (PGF), platelet derived growth factor-B (PDGF-B) and stromal derived growth factor-1 (SDF-1) (Hirota and Semenza, 2006; Ke and Costa, 2006; Li and Ye, 2010; Semenza, 2012).
There is a general consensus that hypoxic conditions contribute to many retinal diseases such as von Hippel-Lindau (VHL) disease, diabetic retinopathy (DR), retinopathy of prematurity (ROP), macular edema, glaucoma, age-related macular degeneration (AMD) and retinitis pigmentosa (Arden and Sivaprasad, 2011; Arjamaa and Nikinmaa, 2006; Hayreh, 2008; Penn et al., 2000; Pierce et al., 1995; Smith, 2003; Stefansson, 2001; Tezel and Wax, 2004). In response to hypoxia, retinal cells release various growth factors which produce paracrine effects, resulting in angiogenesis, fibro vascular tissue formation, retinal ablation and ultimately loss of vision. Inspite of recent advances in therapeutic intervention for these diseases, currently available agents demonstrate only modest effects. It could be attributed to cascade of reactions underlying hypoxia signaling. Since drug disposition is predominantly regulated by membrane transporters, evaluating the molecular response of efflux and influx transporters to reduced oxygen levels is of considerable interest. Efflux transporters such as P-glycoprotein (P-gp/MDR1), multidrug resistance protein 2 (MRP2), breast cancer resistant protein (BCRP) are the leading membrane bound protein families in both prokaryotes and eukaryotes. These proteins are also referred as ATP binding cassette (ABC) transporters since these efflux pumps derive energy from ATP hydrolysis. Expression and functional activity of various efflux transporters was characterized on human and rabbit retinal cells (Kennedy and Mangini, 2002; Mannermaa et al., 2009). These efflux pumps are mainly responsible for extruding molecules out of cytoplasm. In order to facilitate enhanced cellular absorption and evasion of efflux transporters, several strategies were examined (Anand et al., 2002; Katragadda et al., 2006; Majumdar et al., 2004). One of such approaches include utilization of influx transporters such as neutral and cationic amino acid transporter (B(0, +)), folate receptor-alpha (FR-α) and sodium dependent multivitamin transporter (SMVT). B(0, +) is an amino acid transporter which recognizes neutral as well as cationic amino acids for membrane translocation. FR-α is a membrane receptor anchored to the plasma membrane by glycosylphosphatidylinositol (GPI), with greater affinity for folic acid and reduced forms such as methyltetrahydrofolate (Ganapathy and Ganapathy, 2005; Smith et al., 1999). SMVT is an important transmembrane protein responsible for translocation of vitamins and other essential cofactors such as biotin, pantothenic acid and lipoic acid (Vadlapudi et al., 2012a). The role of these influx transporters in ocular drug delivery has also been explored. Therefore, in this study, we have examined the differential expressions of efflux transporters (MDR1, MRP2 and BCRP) and influx transporters (B(0, +), FR-α and SMVT) in human retinal pigment epithelial (RPE) (D407 and ARPE-19) cells under hypoxic and normoxic conditions.
2. MATERIALS AND METHODS
2.1 Materials
Human retinal pigment epithelial (D407) cells were obtained as a generous gift from Dr. Richard Hunt (University of South Carolina, Columbia, SC). ARPE-19 cells were procured from American Type Culture Collection (ATCC) (Manassas, VA). Dulbecco’s modified eagle’s medium (DMEM), DMEM: Nutrient Mixture F-12 (DMEM/F12), trypsin replacement (TrypLE™ Express), non-essential amino acids, and TRIzol® were obtained from Invitrogen (Carlsbad, CA). Fetal bovine serum (FBS) was purchased from Atlanta Biologicals (Lawrenceville, GA). Culture flasks (75cm2 and 25cm2growth area), 12-well plates (3.8cm2 growth area per well) and 96-well plates (0.32cm2 growth area per well) were procured from Corning Costar Corp. (Cambridge, MA). [14C] Arginine (specific activity: 346mCi/mMol), [3H] Abacavir (specific activity: 40Ci/mMol) and [3H] Biotin (specific activity: 53.4Ci/mMol) were procured from PerkinElmer (Waltham, MA). [3H] Digoxin (specific activity: 0.1Ci/mMol), [3H] Folic acid (specific activity: 25.6Ci/mMol) and [3H] Lopinavir (specific activity: 0.5Ci/mMol) were purchased from Moravek Biochemicals (Brea, CA). OligodT, dNTP, M-MLV reverse transcriptase and CellTiter 96® Aqueous Non-Radioactive cell proliferation assay were obtained from Promega Corporation (Madison, WI). Light Cycler 480® SYBR I green master mix was obtained from Roche Applied Science (Indianapolis, IN). Human VEGF ELISA kit was purchased from Thermo Fisher Scientific Inc. (Rockford, IL). Unless otherwise mentioned, all other chemicals were purchased from Sigma Chemicals (St. Louis, MO) and used without further purification.
2.2 Cell Culture
D407 cells (passage numbers 65-70) were employed in this study (Ponnaluri et al., 2011). Cells were maintained in DMEM medium supplemented with 10% FBS (heat inactivated), 1% nonessential amino acids, 20mM HEPES, 29mM sodium bicarbonate and 100U/mL of penicillin and 100μg/mL of streptomycin. ARPE-19 cells (passage numbers 20-25) were cultured in D-MEM/F-12 supplemented with 10% FBS (heat inactivated), 15mM HEPES, 29mM sodium bicarbonate, 100U/mL penicillin, 100μg/mL streptomycin (Janoria et al., 2009). Cells were cultured in T-75 flasks at 37°C in a humidified atmosphere of 5% CO2 and 90% relative humidity. The medium was replaced every alternate day and passaged using TrypLE™ Express after reaching 80% confluency. Cells were seeded at a density of 1 million cells in T-25 flasks and 250,000 cells/well in 12-well plates. After reaching 80% confluency, cells were subjected to hypoxic conditions for a specific period of time in a bactron anaerobic chamber with a gas mix consisting of 1% O2, 5% CO2 and 94% N2, following a previously published method (Ponnaluri et al., 2011; Vavilala et al., 2012).
2.3 Extraction of RNA
Cells cultured under hypoxic conditions were processed in the anaerobic chamber itself to avoid any exposure to normoxic conditions. Cells were lysed in TRIzol® reagent and the lysate was transferred into an eppendorf tube. To this lysate, chloroform was added to facilitate phase separation. The aqueous layer was separated and isopropanol was added to precipitate RNA. The RNA pellet obtained was washed twice with 75% ethanol and dissolved in DNase/RNase free water. The concentration of RNA was determined by detecting UV absorbance at 260 nm with Nanodrop (Thermo Fisher Scientific, Wilmington, DE). RNA (4μg) was reverse transcribed into complementary DNA (cDNA) with OligodT as a template and M-MLV reverse transcriptase. The conditions for reverse transcription were denaturation for 5 min at 70°C, reverse transcription for 1 hour at 42°C and final extension for 5 min at 72°C.
2.4 Quantitative Real-Time Polymerase Chain Reaction (qPCR) Studies
Primers were custom designed with Primer Blast tool from Pubmed and listed in Table 1. All the primers were designed such that 100-150 bp long amplicons could be generated to increase the efficiency of amplification. For quantitative gene expression analysis, 80μg of cDNA was amplified using 10μM of forward and reverse primers and Light cycler SYBR®-green master mix using ABI Prism 5700 Sequence Detection System (Applied Biosystems, Foster city, CA). The reactions were carried out with initial denaturation at 70°C for 5 min, followed by 45 cycles of denaturation at 95°C for 10 sec, annealing at 55°C for 10 sec and extension at 72°C for 10 sec. The specificity of PCR products was confirmed by melting curve analysis. Relative amount of RNA levels was normalized to the internal standard GAPDH (Glyceraldehyde 3-phosphate dehydrogenase) in each sample. GAPDH was selected as an internal control from previously published results (Tan et al., 2012). Initial experiments were carried out to ensure that the target and control genes were amplified with equal efficiencies. Any difference in RNA levels in treated vs control samples was quantified by comparative Ct method as mentioned in data analysis section.
Table 1.
Primers used in quantitative gene expression (qPCR) analysis. Sequence is given from 5′- >3.
| Gene | Forward primer | Reverse primer |
|---|---|---|
| GAPDH | ATCCCTCCAAAATCAAGTGG | GTTGTCATGGATGACCTTGG |
| MDR1 | CTTATGCTCTGGCCTTCTGG | TGCTTCAATGCTTGGAGATG |
| MRP2 | AAATATTTTGCCTGGGAACC | TGTGACCACAGATACCAGGA |
| BCRP | AGCTGCAAGGAAAGATCCAA | TGCCCATCACAACATCATCT |
| B(0,+) | AGCCGAGGGAGTGAACCATG | GGACCAGTTACCACGGTCCT |
| FR-α | AGGACAGACATGGCTCAGCG | TGTGGTGCTTGGCGTTCATG |
| SMVT | TACCAGTTCTGCCAGCCACAGTG | CAGGGACACCAAAACCTCCCTCT |
| HIF-1α | GTACCCTAACTAGCCGAGGAAGAA | GTGAATGTGGCCTGTGCAGT |
| VEGF | CTTGCCTTGCTGCTCTAC | TGGCTTGAAGATGTACTCG |
| GLUT-1 | CGGGCCAAGAGTGTGCTAAA | TGACGATACCGGAGCCAATG |
| PEPT1 | CAAGAAGTTCAAGCCACAGG | GAAATGCCTTACTCCGATGC |
| PEPT2 | CCTTCAGCAGCCTCTGTTAT | AGGACTGTGTGTACCACTTG |
| OCT1 | GTGGGATAATCACCCCCTTC | TCTGGAAGAAGTAGCGTCAC |
| OCT2 | TTGGCTCTATGAGTATCGGC | AGGACTGTAGTTAGGAGGCA |
2.5 Enzyme-Linked Immunosorbent Assay (ELISA)
A sandwich ELISA was performed to determine the amount of VEGF secreted in cell culture medium post exposure to normoxic and hypoxic conditions, following manufacturer’s instructions. Briefly, an anti-human VEGF165 antibody was precoated to the 96-well microplate. The samples/standards (50μL) were added to the wells and incubated for 2 hours. After removing unbound antigen, biotinylated secondary detecting antibody (100μL) was added and further incubated for 1 hour. Excess detecting antibody was removed and streptavidin - horseradish peroxidase (HRP) was added which subsequently reacts with TMB (3,3′,5,5′-tetramethylbenzidine) substrate to produce a colorimetric signal. This signal was estimated by detecting the absorbance at 450 nm using a plate spectrophotometer (SpectraFluor Plus, Maennedorf, Switzerland).
2.6 Immunoblot Analysis
Following growth under normoxic and hypoxic conditions, cells were washed with PBS (3.2mM Na2HPO4, 0.5mM KH2PO4, 1.3mM KCl and 135mM NaCl) and lysed in PBS with 1% Triton X-100 and protease inhibitor cocktail maintained at pH 7.4, for 15-20 min on ice. Upon homogenization, cells were centrifuged at 12,000 rpm for 10 min and the protein lysate was collected. The amount of protein in the lysate was determined using Bio-Rad protein estimation kit (BioRad, Hercules, CA) using bovine serum albumin (BSA) as the standard. An equal amount of protein (20μg) in all samples was separated using poly acrylamide gel electrophoresis (PAGE). The separated protein bands were transferred onto a polyvinylidene fluoride (PVDF) membrane and blocked overnight at 4°C with 2% non-fat dry milk and 0.25% BSA prepared in 0.05 M tris buffered saline. The blot was exposed to primary antibody at 25°C for 4 hours. After subsequent washes the blot was again exposed to secondary antibody-HRP conjugate for 1 hour. Finally the blot was visualized for the protein of interest using chemiluminescent substrate (Pierce Biotechnology, Rockford, IL) in chemiImager 8900 (Alpha Innotech, San Leandro, CA).
2.7 Uptake Studies
Uptake studies were performed on confluent cell monolayers cultured in 12-well plates. Uptake experiments for hypoxic conditions were performed in the anaerobic chamber itself to prevent cell exposure to normal oxygen levels during the study. After culturing in normoxic or hypoxic conditions, the medium was removed and cells were washed three times with 1mL of dulbecco’s phosphate buffered saline (DPBS) (130mM NaCl, 0.03mM KCl, 7.5mM Na2HPO4, 1.5mM KH2PO4, 1mM CaCl2, 0.5mM MgSO4, 20mM HEPES and 5mM glucose) maintained at pH 7.4. Test solution (500μL) was added and cells were incubated for 30 min at 37°C. Uptake was arrested with ice cold PBS and 1mL of lysis solution (0.1% (v/v) Triton-X in 0.3N NaOH) was added. Cells were lysed overnight and the lysate was then quantified for radioactivity with scintillation cocktail (Fisher Scientific, Fair Lawn, NJ) in a scintillation counter (Model LS-6500; BeckmanCounter, Fullerton, CA). Uptake in each well was normalized to the respective protein content, as determined by Bio-Rad protein estimation kit (Bio-Rad, Hercules, CA). [3H] Digoxin, [3H] Lopinavir and [3H] Abacavir were used as model substrates for MDR1, MRP2 and BCRP mediated transport respectively. [14C] Arginine, [3H] Folic acid and [3H] Biotin were used as model influx transporter substrates for B(0,+), FR-α and SMVT respectively.
2.8 Cell proliferative assay
A cell proliferative assay (MTS assay) was performed to determine the effect of hypoxia on RPE cells. Post exposure to normoxic or hypoxic conditions, medium was aspirated and 100μL of serum free media and 20μL of MTS and PMS reagent were added. Following incubation for 3 hours, the quantity of formazan formed from MTS is measured at 490 nm using a plate spectrophotometer. The amount of formazan formed is directly proportional to the number of viable cells.
2.9 Data and Statistical Analysis
Relative expression of each gene was quantified following delta-delta (ΔΔCt) method according to Eq.s 1, 2 and 3
| Eq.1 |
Treated represents hypoxic samples and control represents normoxic samples
| Eq.2 |
Target gene represents either MDR1, MRP2, BCRP, B(0, +), FR-α, SMVT, HIF-1α, VEGF or GLUT-1 and reference gene represents GAPDH. Relative fold expression is calculated according to Eq.3
| Eq.3 |
Cellular accumulation of radioactive substrates was calculated with Eq.4
| Eq.4 |
DPM represents disintegrations per minute and C represents concentration.
All the experiments were performed in quadruplicates. The results are expressed as mean ± standard deviation (SD). One way analysis of variance (ANOVA) or student’s t test (Graph Pad INSTAT, version 4.0) was performed to confirm statistical significance of the experimental values. A P-value of less than 0.05 was considered to be statistically significant.
3. RESULTS
3.1 Quantitative Gene Expression Analysis
Among the different cell culture models of retinal pigment epithelial cells, D407 and ARPE-19 cells were selected for their expression of efflux and influx transporters (Constable et al., 2006; Jwala et al., 2012; Mannermaa et al., 2009; Vadlapudi et al., 2012b). Further, both these cells induce VEGF expression under hypoxic conditions (Geisen et al., 2006; Slomiany and Rosenzweig, 2004). D407 is a spontaneously transformed cell line that has been cloned from human RPE cells. These cells retain epithelial characteristics even after subculturing for more than 200 times. ARPE-19 cells have been shown to exhibit characteristic epithelial morphology and transporter expression similar to human RPE. Both D407 and ARPE-19 cells represent RPE with respect to polarization (Davis et al., 1995; Janoria et al., 2009). D407 cells were cultured for 3, 6, 12, 24, 48 and 72 hours under both normoxic and hypoxic conditions to determine the optimum time for induction of membrane transporters. RNA was extracted and cDNA was synthesized. Real-time PCR analysis was performed to determine the quantitative gene expression levels of efflux transporters (MDR1, MRP2 and BCRP), influx transporters (B(0, +), FR-α, and SMVT), hypoxic regulator (HIF-1α) and hypoxic markers (VEGF and GLUT-1).
Expression of Efflux Transporters
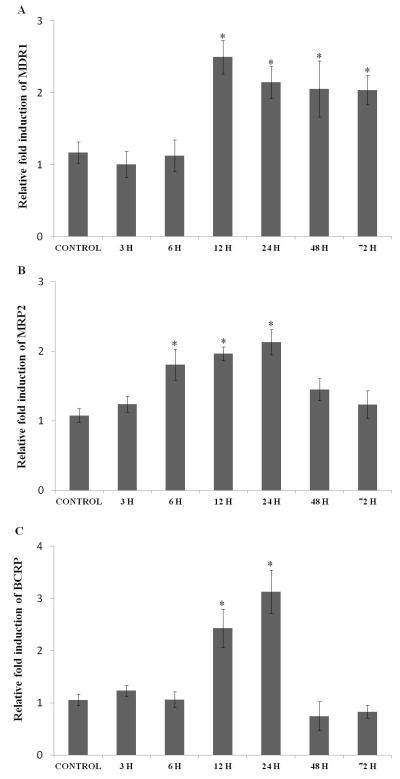
MDR1 expression did not change significantly following exposure to hypoxic conditions for 3 and 6 hours. The expression was elevated to almost 2.5 fold within 12 hours of hypoxic exposure which was maintained for over 72 hours (Fig. 1A). The expression of MRP2 remained the same within 3 hours of hypoxic exposure. Once again expression level was significantly induced from 6 to 24 hours, with highest induction noticed at 24 hours and then an attenuation of MRP2 mRNA levels was observed within 48 and 72 hours (Fig. 1B). Exposure to hypoxia for 3 and 6 hours did not alter the expression levels of BCRP. A significant rise in BCRP expression was evident when cells were exposed to hypoxia for 12 (2.5 fold) and 24 hours (3.1 fold). A sudden drop in RNA expression compared to control levels was observed as time progressed from 48 to 72 hours (Fig. 1C).
Fig. 1.
Relative fold RNA expression of various efflux transporters (A) MDR1, (B) MRP2, and (C) BCRP in D407 cells exposed to hypoxic conditions for various time points (3, 6, 12, 24, 48 and 72 hours). Values are represented as mean ± SD (n=4). A P-value of less than 0.05 was considered to be statistically significant and represented by *.
Expression of Influx Transporters
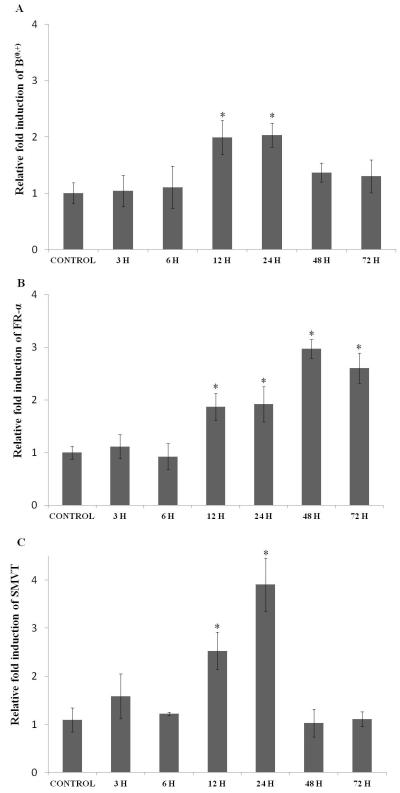
The expression levels of influx transporters-B(0, +), FR-α, and SMVT did not rise significantly following hypoxic exposure over 3 and 6 hours. The expression level of B(0, +) was induced by 2 fold upon hypoxic exposure for 12 and 24 hours and then dropped to basal levels upon prolonged exposure to 72 hours (Fig. 2A). FR-α showed incremental induction as hypoxic exposure was prolonged. A maximum of 3 fold induction was observed in 48 to 72 hours (Fig. 2B). The expression level of SMVT elevated to 2.5 fold after 12 hours and reached to a peak of 4 fold with 24 hours of hypoxic exposure. Interestingly, prolonged exposure to hypoxia dramatically reduced SMVT expression to basal levels (Fig. 2C).
Fig. 2.
Relative fold RNA expression of various influx transporters (A) B(0, +), (B) FR-α, and (C) SMVT in D407 cells exposed to hypoxic conditions for various time points (3, 6, 12, 24, 48 and 72 hours). Values are represented as mean ± SD (n=4). A P-value of less than 0.05 was considered to be statistically significant and represented by *.
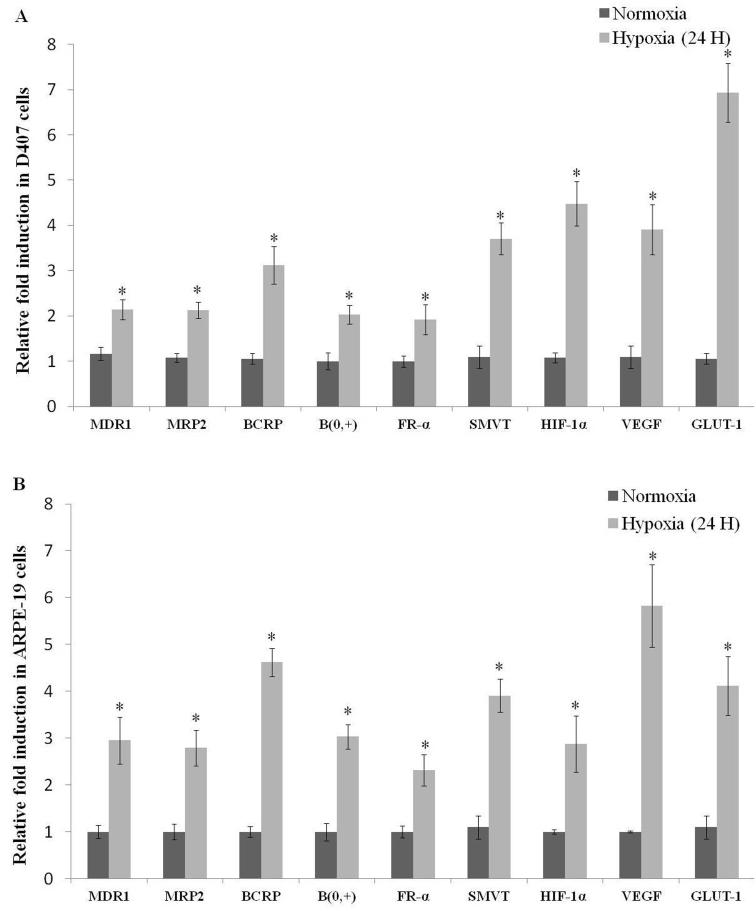
Among all the time points studied, hypoxic exposure to 24 hours demonstrated elevated RNA expression levels of efflux and influx transporters, HIF-1α, VEGF and GLUT-1 in D407 cells (Fig. 3A). Therefore, 24 hour exposure duration was selected for all subsequent studies. With these promising results, ARPE-19 cells were exposed to hypoxia for 24 hours. A similar trend in RNA expression levels of efflux and influx transporters, HIF-1α, VEGF and GLUT-1 was also noticed in ARPE-19 cells (Fig. 3B).
Fig. 3.
Relative fold RNA expression of efflux transporters (MDR1, MRP2 and BCRP), influx transporters (B(0, +), FR-α and SMVT) and hypoxic markers (HIF-1α, VEGF and GLUT-1) post hypoxic exposure for 24 hours in (A) D407 and (B) ARPE-19 cells. Values are represented as mean ± SD (n=4). A P-value of less than 0.05 was considered to be statistically significant from normoxia and represented by *.
3.2 ELISA
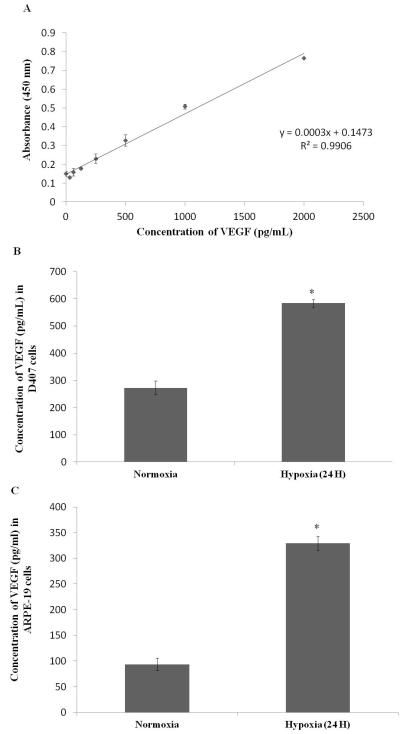
D407 and ARPE-19 cells were cultured for 24 hours in both normoxic and hypoxic conditions, and the culture medium was collected. This medium was assayed to determine the amount of VEGF secreted, using sandwich ELISA method. This assay can detect different concentrations of VEGF varying from 31.25 - 2000pg/mL (R2 = 0.99) (Fig. 4A). From this standard graph, the concentration of VEGF in D407 normoxic conditions was calculated to be 272.83±25.69pg/mL. However, exposure to hypoxia for 24 hours increased the concentration of VEGF to 583.83±14.84pg/mL (2 fold increase) (Fig. 4B). Similarly, the concentration of VEGF in ARPE-19 cells increased to 329.33±14.14pg/mL (3.5 fold increase) in hypoxic conditions compared to 93.66±11.83pg/mL in normoxic conditions (Fig. 4C). The induction observed at the RNA level for VEGF was well correlated with the values obtained from ELISA.
Fig. 4.
Sandwich ELISA measuring (A) absorbance at 450 nm post exposure to different concentrations of VEGF standards (31.25 - 2000pg/mL) (B) concentration of VEGF in D407 cell culture supernatant post exposure to normoxic and hypoxic conditions (24 hours) and (C) concentration of VEGF in ARPE-19 cell culture supernatant post exposure to normoxic and hypoxic conditions (24 hours). Values are represented as mean ± SD (n=4). A P-value of less than 0.05 was considered to be statistically significant from normoxia and represented by *.
3.3 Immunoblot Analysis
Immunoblot analysis was performed to evaluate if the induction in gene expression levels correlate with protein expression on exposure to hypoxia. Since BCRP and SMVT were highly upregulated as evident from qPCR analysis, these two transporters were examined for their protein expression. RPE cells were cultured for 24 hours in both normoxic and hypoxic conditions. Total protein was extracted, separated using PAGE and amount of specific protein was determined using antibody staining. The protein level of β-actin was measured as a loading control during the experiment. Both the proteins BCRP and SMVT demonstrated significant induction in hypoxic relative to normoxic conditions in both D407 and ARPE-19 cells (Figs.5A and 5B). The induction observed at the protein level for representative efflux and influx transporters correlated well with the mRNA change observed in qPCR analysis.
Fig. 5.
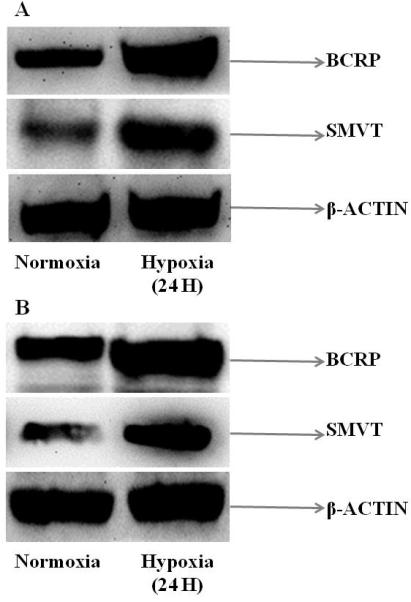
Immunoblot analysis showing the protein expression of BCRP and SMVT in (A) D407 and (B) ARPE-19 cells post exposure to normoxic and hypoxic conditions (24 hours). β-actin was used as an internal control.
3.4 Uptake Studies
Uptake studies with efflux or influx transporter substrates were performed to delineate the functional activity of these membrane transporters in hypoxic conditions.
Uptake of Efflux Transporter Substrates
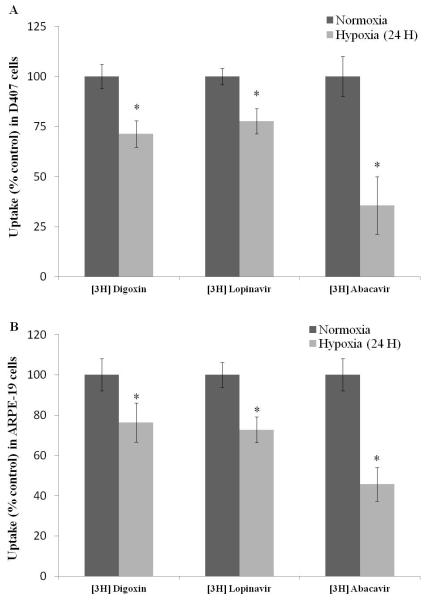
[3H] Digoxin, [3H] Lopinavir and [3H] Abacavir were used as model substrates to study MDR1, MRP2 and BCRP mediated efflux, respectively. A significant decrease in cellular accumulation of these substrates in hypoxic conditions was evident in D407 cells. Uptake of [3H] Digoxin and [3H] Lopinavir was lower by 30% and 25%, respectively. Notably, a 65% reduction in uptake of [3H] Abacavir was noticed. In ARPE-19 cells, uptake of [3H] Digoxin, [3H] Lopinavir and [3H] Abacavir was reduced by 25%, 30% and 55%, respectively. This data confirms increased activity of efflux transporters under hypoxic conditions in both the cells (Figs. 6A and 6B).
Fig. 6.
Uptake of efflux transporter substrates [3H] Digoxin (0.25μCi/mL), [3H] Lopinavir (0.5μCi/mL) and [3H] Abacavir (0.5μCi/mL) in (A) D407 and (B) ARPE-19 cells post exposure to normoxic and hypoxic conditions (24 hours). Values are represented as mean ± SD (n=4). A P-value of less than 0.05 was considered to be statistically significant from normoxia and represented by *.
Uptake of Influx Transporter Substrates
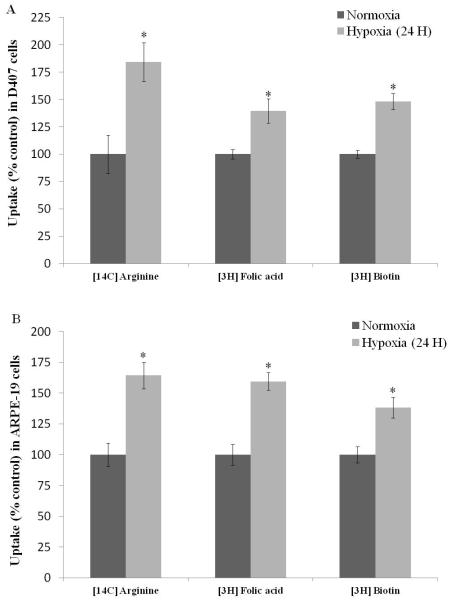
[14C] Arginine, [3H] Folic acid and [3H] Biotin were employed as model influx substrates to study the functional activity of B(0, +), FR-α, and SMVT respectively. [14C] Arginine demonstrated 85% rise in cellular accumulation under hypoxic conditions in D407 cells. [3H] Folic acid and [3H] Biotin also exhibited an elevation in cellular uptake in hypoxic conditions by 40% and 50%, respectively (Fig. 7A). Uptake of all the three influx transporter substrates raised by 65%, 60% and 40%, respectively in ARPE-19 cells exposed to hypoxia for 24 hours (Fig. 7B). This study demonstrates the enhanced activity of influx transporters under hypoxic conditions.
Fig. 7.
Uptake of influx transporter substrates [14C] Arginine (0.25μCi/mL), [3H] Folic acid (0.5μCi/mL) and [3H] Biotin (0.5μCi/mL) in (C) D407 and (D) ARPE-19 cells post exposure to normoxic and hypoxic conditions (24 hours). Values are represented as mean ± SD (n=4). A P-value of less than 0.05 was considered to be statistically significant from normoxia and represented by *.
3.5 Cell Proliferation Assay
MTS assay was performed to examine the cytotoxicity of cells post exposure to hypoxic conditions (24 hours). RPE cells (D407 and ARPE-19) did not exhibit any significant cell death (Fig. 8).
Fig. 8.
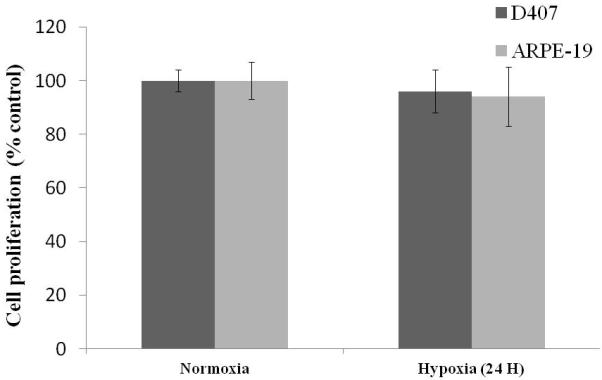
Cell proliferation assay of D407 and ARPE-19 cells post exposure to normoxic and hypoxic conditions (24 hours). Values are represented as mean ± SD (n=4).
4. DISCUSSION
Deficiencies in oxygenation (hypoxia) stimulate the expression of pro-angiogenic factors leading to the development of neovascularization in retinal diseases (Caprara and Grimm, 2012). In the past decade, significant research has been conducted to comprehend the pathogenesis and genetics of oxygen-dependent retinal diseases. Most of the therapies aimed at inhibiting this pathway demonstrated partial success owing to the underlying complex multifactorial signaling process. Significant attention has not been paid to transporter expression during retinal hypoxic complications, regardless of their potential value in drug absorption. Therefore, the aim of this study was to examine the changes in molecular expression and functional activity of efflux and influx transporters under hypoxic conditions in retinal pigment epithelial cells (D407 and ARPE-19 cells). These observations would be helpful for predicting drug accumulation under hypoxic conditions.
Real time-PCR studies revealed that RNA levels of efflux transporters were strongly induced in hypoxic cells. Exposure of D407 cells induced the expression of MDR1 gene levels after 12 hours and continued induction upto 72 hours. These results are consistent with earlier studies which demonstrated that the basal expression of MDR1 is indeed regulated by HIF-1α (Comerford et al., 2002). The expression of MRP2 in hypoxic cells was upregulated after incubation from 6 to 24 hours, with the differences being statistically significant. However, such induction of MRP2 expression was diminished after continuous exposure to hypoxia for 48 and 72 hours. Also, a similar trend was observed for BCRP expression in D407 cells. These results suggest that the induction of both MRP2 and BCRP genes at hypoxic state was transient. Elevation in BCRP levels was also suggested to be upregulated by HIF-α, thus conferring a survival advantage under hypoxic conditions (Krishnamurthy et al., 2004; Krishnamurthy and Schuetz, 2005; Staud and Pavek, 2005). Cheng et al. have identified a region within BCRP promoter site in close proximity to the reported HIF-1α response element, which is responsible for regulation of BCRP via HIF-1α (Cheng and To, 2012). BCRP has also been reported to play a major role in heme and folate homeostasis, which may help in cell survival under hypoxic conditions. Thus, malignant or diseased cells may utilize the over expressing efflux transporters to survive against hypoxic stress (Nakanishi and Ross, 2012; Natarajan et al., 2012).
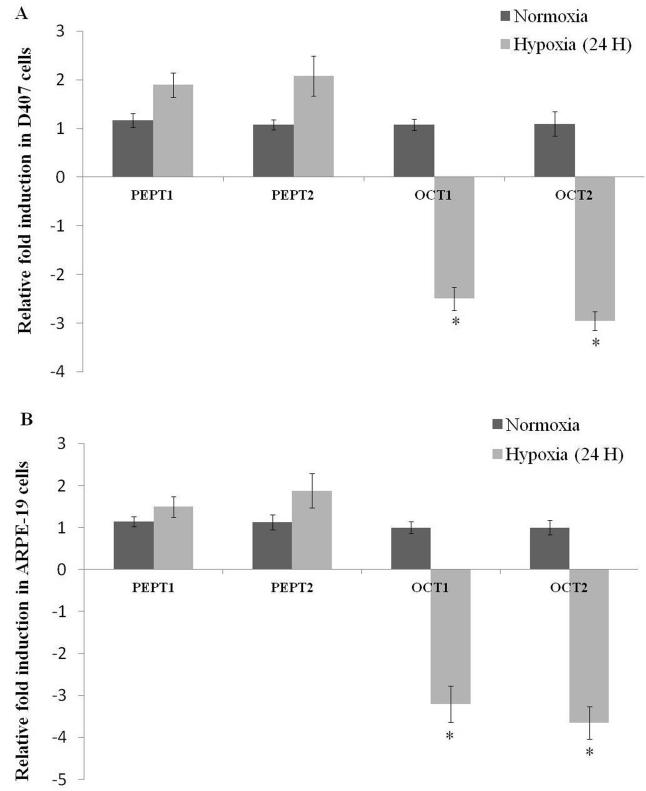
Besides efflux transporters, the expression level of influx transporters including B(0, +), FR-α, and SMVT were also examined in these studies. Elevated expression of B(0, +), FR-α, and SMVT after hypoxic exposure suggest that these transporters are also susceptible to oxygen tension. It appears that cells exposed to hypoxic stress may require high intake of amino acids, vitamins and other nutrients as compared to normal cells. This requirement is generally met by acquisition of genetic mutations that functionally alter receptor-initiated signaling pathways in malignant or diseased cells. Consequently such pathways aid in activating the uptake and metabolism of amino acids, vitamins and other nutrients necessary for promotion of cell survival and growth. Enhanced expression of nutrient transporters occurs as a result of adaptive response to hypoxic insult (Boidot et al., 2012; Soh et al., 2007). Apart from B(0, +), FR-α, and SMVT, other influx transporters including peptide transporters (PEPT1 and PEPT2) and organic cation transporters (OCT1 and OCT2) are also identified on RPE cells and their importance in ocular drug disposition has been documented in literature (Mannermaa et al., 2006). Hence, a preliminary study was conducted to evaluate the differential expression of PEPT1, PEPT2, OCT1 and OCT2 in hypoxic conditions. Surprisingly, RNA expression of PEPT1 and PEPT2 did not alter significantly while the expression of OCT1 and OCT2 was downregulated in RPE cells following 24 hours of hypoxic exposure (Figs. 9A and 9B). However, protein expression analysis and functional activity studies are further warranted to delineate the mechanistic and differential regulation of influx transporters in hypoxic conditions.
Fig. 9.
Relative fold RNA expression of peptide transporters (PEPT1 and PEPT2) and organic cation transporters (OCT1 and OCT2) post hypoxic exposure for 24 hours in (A) D407 and (B) ARPE-19 cells. Values are represented as mean ± SD (n=4). A P-value of less than 0.05 was considered to be statistically significant from normoxia and represented by *.
A sandwich ELISA assay confirmed the increased secretion of VEGF during hypoxic conditions. This assay further validates the hypoxic conditions used in our studies. Results from immunoblot analysis further indicated that the RNA expression of these transporters is being well translated to protein expression. Results from gene expression studies were further confirmed by performing uptake studies to delineate the functional activity of various transporters in hypoxic conditions. Lower uptake of [3H] Digoxin, [3H] Lopinavir and [3H] Abacavir was observed as a result of elevated efflux by MDR1, MRP2 and BCRP, respectively in RPE cells. This decrease in intracellular accumulation of radiolabeled substrates suggested that hypoxia may inhibit the uptake of various active molecules that are substrates of efflux transporters. An interesting observation was that uptake of [3H] Abacavir was reduced to a greater degree in cells exposed to hypoxia for 24 hours suggesting that BCRP is more susceptible to hypoxic stress compared to MDR1 and MRP2. We also examined the functional activity of influx transport systems-B(0, +), FR-α and SMVT by measuring uptake of [14C] Arginine, [3H] Folic acid and [3H] Biotin, respectively. Enhanced uptake of these substrates suggest that rise in cellular accumulation may be due to induction of B(0, +), FR-α and SMVT respectively, further confirming the results from gene expression studies. [14C] Arginine accumulation was higher compared to [3H] Folic acid and [3H] Biotin in both the RPE cells, suggesting that B(0, +) transporter is functionally more active under hypoxic conditions relative to FR-α and SMVT. MTS assay was carried out to check cell proliferation under normoxic and hypoxic conditions. Results from this assay revealed that hypoxic insult for 24 hours did not induce RPE cell death. This result is consistent with earlier report in which another human RPE cell line (R-50) did not exhibit any cytotoxic effects even after 48 hours of hypoxic exposure (Wu et al., 2007).
In conclusion, this study demonstrates for the first time that hypoxic conditions alter expression levels of efflux and influx transporters in human RPE cells. These molecular and functional alterations in the expression of membrane transporters/receptors may facilitate cell survival and growth under hypoxic conditions. Also, hypoxic conditions in retinal diseases may alter cellular accumulation of various molecules targeted to ocular tissues. Better knowledge of physiological and pathological conditions of hypoxia induced disorders offers a promising approach for effective ocular drug delivery.
ACKNOWLEDGEMENTS
This research work has been supported by NIH Grants R01 EY09171-16 and R01 EY10659-14. We would like to thank Dr. Kun Cheng from the Department of Pharmaceutical Sciences at UMKC School of Pharmacy for allowing us to the use real-time PCR (qPCR) machine for our studies.
Footnotes
Publisher's Disclaimer: This is a PDF file of an unedited manuscript that has been accepted for publication. As a service to our customers we are providing this early version of the manuscript. The manuscript will undergo copyediting, typesetting, and review of the resulting proof before it is published in its final citable form. Please note that during the production process errors may be discovered which could affect the content, and all legal disclaimers that apply to the journal pertain.
REFERENCES
- Anand BS, Dey S, Mitra AK. Current prodrug strategies via membrane transporters/receptors. Expert Opin Biol Ther. 2002;2:607–620. doi: 10.1517/14712598.2.6.607. [DOI] [PubMed] [Google Scholar]
- Arden GB, Sivaprasad S. Hypoxia and oxidative stress in the causation of diabetic retinopathy. Curr Diabetes Rev. 2011;7:291–304. doi: 10.2174/157339911797415620. [DOI] [PubMed] [Google Scholar]
- Arjamaa O, Nikinmaa M. Oxygen-dependent diseases in the retina: role of hypoxia-inducible factors. Exp Eye Res. 2006;83:473–483. doi: 10.1016/j.exer.2006.01.016. [DOI] [PubMed] [Google Scholar]
- Boidot R, Vegran F, Meulle A, Le Breton A, Dessy C, Sonveaux P, Lizard-Nacol S, Feron O. Regulation of monocarboxylate transporter MCT1 expression by p53 mediates inward and outward lactate fluxes in tumors. Cancer Res. 2012;72:939–948. doi: 10.1158/0008-5472.CAN-11-2474. [DOI] [PubMed] [Google Scholar]
- Caprara C, Grimm C. From oxygen to erythropoietin: relevance of hypoxia for retinal development, health and disease. Prog Retin Eye Res. 2012;31:89–119. doi: 10.1016/j.preteyeres.2011.11.003. [DOI] [PubMed] [Google Scholar]
- Cheng GM, To KK. Adverse Cell Culture Conditions Mimicking the Tumor Microenvironment Upregulate ABCG2 to Mediate Multidrug Resistance and a More Malignant Phenotype. ISRN Oncol. 2012;2012:746025. doi: 10.5402/2012/746025. [DOI] [PMC free article] [PubMed] [Google Scholar]
- Comerford KM, Wallace TJ, Karhausen J, Louis NA, Montalto MC, Colgan SP. Hypoxia-inducible factor-1-dependent regulation of the multidrug resistance (MDR1) gene. Cancer Res. 2002;62:3387–3394. [PubMed] [Google Scholar]
- Constable PA, Lawrenson JG, Dolman DE, Arden GB, Abbott NJ. P-Glycoprotein expression in human retinal pigment epithelium cell lines. Exp Eye Res. 2006;83:24–30. doi: 10.1016/j.exer.2005.10.029. [DOI] [PubMed] [Google Scholar]
- Davis AA, Bernstein PS, Bok D, Turner J, Nachtigal M, Hunt RC. A human retinal pigment epithelial cell line that retains epithelial characteristics after prolonged culture. Invest Ophthalmol Vis Sci. 1995;36:955–964. [PubMed] [Google Scholar]
- Epstein AC, Gleadle JM, McNeill LA, Hewitson KS, O’Rourke J, Mole DR, Mukherji M, Metzen E, Wilson MI, Dhanda A, Tian YM, Masson N, Hamilton DL, Jaakkola P, Barstead R, Hodgkin J, Maxwell PH, Pugh CW, Schofield CJ, Ratcliffe PJ. C. elegans EGL-9 and mammalian homologs define a family of dioxygenases that regulate HIF by prolyl hydroxylation. Cell. 2001;107:43–54. doi: 10.1016/s0092-8674(01)00507-4. [DOI] [PubMed] [Google Scholar]
- Ganapathy ME, Ganapathy V. Amino Acid Transporter ATB0,+ as a delivery system for drugs and prodrugs. Curr Drug Targets Immune Endocr Metabol Disord. 2005;5:357–364. doi: 10.2174/156800805774912953. [DOI] [PubMed] [Google Scholar]
- Geisen P, McColm JR, King BM, Hartnett ME. Characterization of barrier properties and inducible VEGF expression of several types of retinal pigment epithelium in medium-term culture. Curr Eye Res. 2006;31:739–748. doi: 10.1080/02713680600837408. [DOI] [PubMed] [Google Scholar]
- Giaccia AJ, Simon MC, Johnson R. The biology of hypoxia: the role of oxygen sensing in development, normal function, and disease. Genes Dev. 2004;18:2183–2194. doi: 10.1101/gad.1243304. [DOI] [PMC free article] [PubMed] [Google Scholar]
- Gibson JS, Cossins AR, Ellory JC. Oxygen-sensitive membrane transporters in vertebrate red cells. J Exp Biol. 2000;203:1395–1407. doi: 10.1242/jeb.203.9.1395. [DOI] [PubMed] [Google Scholar]
- Hayreh SS. Role of retinal hypoxia in diabetic macular edema: a new concept. Graefes Arch Clin Exp Ophthalmol. 2008;246:353–361. doi: 10.1007/s00417-007-0678-2. [DOI] [PubMed] [Google Scholar]
- Hirota K, Semenza GL. Regulation of angiogenesis by hypoxia-inducible factor 1. Crit Rev Oncol Hematol. 2006;59:15–26. doi: 10.1016/j.critrevonc.2005.12.003. [DOI] [PubMed] [Google Scholar]
- Jaakkola P, Mole DR, Tian YM, Wilson MI, Gielbert J, Gaskell SJ, Kriegsheim A, Hebestreit HF, Mukherji M, Schofield CJ, Maxwell PH, Pugh CW, Ratcliffe PJ. Targeting of HIF-alpha to the von Hippel-Lindau ubiquitylation complex by O2-regulated prolyl hydroxylation. Science. 2001;292:468–472. doi: 10.1126/science.1059796. [DOI] [PubMed] [Google Scholar]
- Janoria KG, Boddu SH, Wang Z, Paturi DK, Samanta S, Pal D, Mitra AK. Vitreal pharmacokinetics of biotinylated ganciclovir: role of sodium-dependent multivitamin transporter expressed on retina. J Ocul Pharmacol Ther. 2009;25:39–49. doi: 10.1089/jop.2008.0040. [DOI] [PMC free article] [PubMed] [Google Scholar]
- Jewell UR, Kvietikova I, Scheid A, Bauer C, Wenger RH, Gassmann M. Induction of HIF-1alpha in response to hypoxia is instantaneous. FASEB J. 2001;15:1312–1314. [PubMed] [Google Scholar]
- Jwala J, Vadlapatla RK, Vadlapudi AD, Boddu SH, Pal D, Mitra AK. Differential expression of folate receptor-alpha, sodium-dependent multivitamin transporter, and amino acid transporter (B (0, +)) in human retinoblastoma (Y-79) and retinal pigment epithelial (ARPE-19) cell lines. J Ocul Pharmacol Ther. 2012;28:237–244. doi: 10.1089/jop.2011.0155. [DOI] [PMC free article] [PubMed] [Google Scholar]
- Katragadda S, Talluri RS, Mitra AK. Modulation of P-glycoprotein-mediated efflux by prodrug derivatization: an approach involving peptide transporter-mediated influx across rabbit cornea. J Ocul Pharmacol Ther. 2006;22:110–120. doi: 10.1089/jop.2006.22.110. [DOI] [PubMed] [Google Scholar]
- Ke Q, Costa M. Hypoxia-inducible factor-1 (HIF-1) Mol Pharmacol. 2006;70:1469–1480. doi: 10.1124/mol.106.027029. [DOI] [PubMed] [Google Scholar]
- Kennedy BG, Mangini NJ. P-glycoprotein expression in human retinal pigment epithelium. Mol Vis. 2002;8:422–430. [PubMed] [Google Scholar]
- Krishnamurthy P, Ross DD, Nakanishi T, Bailey-Dell K, Zhou S, Mercer KE, Sarkadi B, Sorrentino BP, Schuetz JD. The stem cell marker Bcrp/ABCG2 enhances hypoxic cell survival through interactions with heme. J Biol Chem. 2004;279:24218–24225. doi: 10.1074/jbc.M313599200. [DOI] [PubMed] [Google Scholar]
- Krishnamurthy P, Schuetz JD. The ABC transporter Abcg2/Bcrp: role in hypoxia mediated survival. Biometals. 2005;18:349–358. doi: 10.1007/s10534-005-3709-7. [DOI] [PubMed] [Google Scholar]
- Li Y, Ye D. Cancer therapy by targeting hypoxia-inducible factor-1. Curr Cancer Drug Targets. 2010;10:782–796. doi: 10.2174/156800910793605857. [DOI] [PubMed] [Google Scholar]
- Lopez-Barneo J, Pardal R, Ortega-Saenz P. Cellular mechanism of oxygen sensing. Annu Rev Physiol. 2001;63:259–287. doi: 10.1146/annurev.physiol.63.1.259. [DOI] [PubMed] [Google Scholar]
- Majumdar S, Duvvuri S, Mitra AK. Membrane transporter/receptor-targeted prodrug design: strategies for human and veterinary drug development. Adv Drug Deliv Rev. 2004;56:1437–1452. doi: 10.1016/j.addr.2004.02.006. [DOI] [PubMed] [Google Scholar]
- Mannermaa E, Vellonen KS, Ryhanen T, Kokkonen K, Ranta VP, Kaarniranta K, Urtti A. Efflux protein expression in human retinal pigment epithelium cell lines. Pharm Res. 2009;26:1785–1791. doi: 10.1007/s11095-009-9890-6. [DOI] [PubMed] [Google Scholar]
- Mannermaa E, Vellonen KS, Urtti A. Drug transport in corneal epithelium and blood-retina barrier: emerging role of transporters in ocular pharmacokinetics. Adv Drug Deliv Rev. 2006;58:1136–1163. doi: 10.1016/j.addr.2006.07.024. [DOI] [PubMed] [Google Scholar]
- Nakanishi T, Ross DD. Breast cancer resistance protein (BCRP/ABCG2): its role in multidrug resistance and regulation of its gene expression. Chin J Cancer. 2012;31:73–99. doi: 10.5732/cjc.011.10320. [DOI] [PMC free article] [PubMed] [Google Scholar]
- Natarajan K, Xie Y, Baer MR, Ross DD. Role of breast cancer resistance protein (BCRP/ABCG2) in cancer drug resistance. Biochem Pharmacol. 2012;83:1084–1103. doi: 10.1016/j.bcp.2012.01.002. [DOI] [PMC free article] [PubMed] [Google Scholar]
- Penn JS, Li S, Naash MI. Ambient hypoxia reverses retinal vascular attenuation in a transgenic mouse model of autosomal dominant retinitis pigmentosa. Invest Ophthalmol Vis Sci. 2000;41:4007–4013. [PubMed] [Google Scholar]
- Pierce EA, Avery RL, Foley ED, Aiello LP, Smith LE. Vascular endothelial growth factor/vascular permeability factor expression in a mouse model of retinal neovascularization. Proc Natl Acad Sci U S A. 1995;92:905–909. doi: 10.1073/pnas.92.3.905. [DOI] [PMC free article] [PubMed] [Google Scholar]
- Ponnaluri VK, Vadlapatla RK, Vavilala DT, Pal D, Mitra AK, Mukherji M. Hypoxia induced expression of histone lysine demethylases: implications in oxygen-dependent retinal neovascular diseases. Biochem Biophys Res Commun. 2011;415:373–377. doi: 10.1016/j.bbrc.2011.10.075. [DOI] [PubMed] [Google Scholar]
- Semenza GL. HIF-1: mediator of physiological and pathophysiological responses to hypoxia. J Appl Physiol. 2000;88:1474–1480. doi: 10.1152/jappl.2000.88.4.1474. [DOI] [PubMed] [Google Scholar]
- Semenza GL. Hypoxia-inducible factors in physiology and medicine. Cell. 2012;148:399–408. doi: 10.1016/j.cell.2012.01.021. [DOI] [PMC free article] [PubMed] [Google Scholar]
- Slomiany MG, Rosenzweig SA. IGF-1-induced VEGF and IGFBP-3 secretion correlates with increased HIF-1 alpha expression and activity in retinal pigment epithelial cell line D407. Invest Ophthalmol Vis Sci. 2004;45:2838–2847. doi: 10.1167/iovs.03-0565. [DOI] [PubMed] [Google Scholar]
- Smith LE. Pathogenesis of retinopathy of prematurity. Semin Neonatol. 2003;8:469–473. doi: 10.1016/S1084-2756(03)00119-2. [DOI] [PubMed] [Google Scholar]
- Smith SB, Kekuda R, Gu X, Chancy C, Conway SJ, Ganapathy V. Expression of folate receptor alpha in the mammalian retinol pigmented epithelium and retina. Invest Ophthalmol Vis Sci. 1999;40:840–848. [PubMed] [Google Scholar]
- Soh H, Wasa M, Fukuzawa M. Hypoxia upregulates amino acid transport in a human neuroblastoma cell line. J Pediatr Surg. 2007;42:608–612. doi: 10.1016/j.jpedsurg.2006.12.010. [DOI] [PubMed] [Google Scholar]
- Staud F, Pavek P. Breast cancer resistance protein (BCRP/ABCG2) Int J Biochem Cell Biol. 2005;37:720–725. doi: 10.1016/j.biocel.2004.11.004. [DOI] [PubMed] [Google Scholar]
- Stefansson E. The therapeutic effects of retinal laser treatment and vitrectomy. A theory based on oxygen and vascular physiology. Acta Ophthalmol Scand. 2001;79:435–440. doi: 10.1034/j.1600-0420.2001.790502.x. [DOI] [PubMed] [Google Scholar]
- Tan SC, Carr CA, Yeoh KK, Schofield CJ, Davies KE, Clarke K. Identification of valid housekeeping genes for quantitative RT-PCR analysis of cardiosphere-derived cells preconditioned under hypoxia or with prolyl-4-hydroxylase inhibitors. Mol Biol Rep. 2012;39:4857–4867. doi: 10.1007/s11033-011-1281-5. [DOI] [PMC free article] [PubMed] [Google Scholar]
- Tezel G, Wax MB. Hypoxia-inducible factor 1alpha in the glaucomatous retina and optic nerve head. Arch Ophthalmol. 2004;122:1348–1356. doi: 10.1001/archopht.122.9.1348. [DOI] [PubMed] [Google Scholar]
- Vadlapudi AD, Vadlapatla RK, Mitra AK. Sodium dependent multivitamin transporter (SMVT): a potential target for drug delivery. Curr Drug Targets. 2012a;13:994–1003. doi: 10.2174/138945012800675650. [DOI] [PMC free article] [PubMed] [Google Scholar]
- Vadlapudi AD, Vadlapatla RK, Pal D, Mitra AK. Functional and molecular aspects of biotin uptake via SMVT in human corneal epithelial (HCEC) and retinal pigment epithelial (D407) cells. AAPS J. 2012b;14:832–842. doi: 10.1208/s12248-012-9399-5. [DOI] [PMC free article] [PubMed] [Google Scholar]
- Vavilala DT, Ponnaluri VK, Vadlapatla RK, Pal D, Mitra AK, Mukherji M. Honokiol inhibits HIF pathway and hypoxia-induced expression of histone lysine demethylases. Biochem Biophys Res Commun. 2012;422:369–374. doi: 10.1016/j.bbrc.2012.04.143. [DOI] [PubMed] [Google Scholar]
- Wang GL, Jiang BH, Rue EA, Semenza GL. Hypoxia-inducible factor 1 is a basic-helix-loop-helix-PAS heterodimer regulated by cellular O2 tension. Proc Natl Acad Sci U S A. 1995;92:5510–5514. doi: 10.1073/pnas.92.12.5510. [DOI] [PMC free article] [PubMed] [Google Scholar]
- Wang GL, Semenza GL. Purification and characterization of hypoxia-inducible factor 1. J Biol Chem. 1995;270:1230–1237. doi: 10.1074/jbc.270.3.1230. [DOI] [PubMed] [Google Scholar]
- Wu WC, Kao YH, Hu PS, Chen JH. Geldanamycin, a HSP90 inhibitor, attenuates the hypoxia-induced vascular endothelial growth factor expression in retinal pigment epithelium cells in vitro. Exp Eye Res. 2007;85:721–731. doi: 10.1016/j.exer.2007.08.005. [DOI] [PubMed] [Google Scholar]


