

Abstract
Background
Adults with type 2 diabetes mellitus (T2DM) have broad impairments in β-cell function, including severe attenuation of the first-phase insulin response to glucose, and reduced β-cell mass. In adolescents with T2DM, there is some evidence that β-cell dysfunction may be less severe. Our objective was to determine β-cell sensitivity to glucose and maximal insulin secretory capacity (AIRmax) in teenagers with T2DM.
Methods
Fifteen adolescents with T2DM [11 F/4 M, age 18.4 ± 0.3 yr, body mass index (BMI) 39.8 ± 2.2 kg/m2] and 10 non-diabetic control subjects (7 F/3 M, age 17.4 ± 0.5 yr, BMI 41.5 ± 2.2 kg/m2) were studied. T2DM subjects had a mean duration of diabetes of 48.8 ± 6.4 months, were treated with conventional therapies, and had good metabolic control [hemoglobin A1c (HbA1c) 6.7 ± 1.2%]. Insulin and C-peptide were determined before and after a graded glucose infusion and after intravenous arginine at a whole blood glucose level of ≥22 mM.
Results
The insulin response to increasing plasma glucose concentrations was blunted in the diabetic compared with control subjects (34.8 ± 11.9 vs. 280.5 ± 57.8 pmol/mmol; p < 0.0001), and AIRmax was also significantly reduced in the diabetic group (1868 ± 330 vs. 4445 ± 606; p = 0.0005).
Conclusion
Even adolescents with well-controlled T2DM have severe impairments of insulin secretion. These data support β-cell dysfunction as central in the pathogenesis of T2DM in young people, and indicate that these abnormalities can develop over a period of just several years.
Keywords: adolescent type 2 diabetes, β-cell function, β-cell mass, β-cell sensitivity, Cincinnati Children’s Hospital Medical Center Hospital, first-phase insulin release, intravenous, oral glucose tolerance test, type 2 diabetes mellitus
Type 2 diabetes mellitus (T2DM), once thought to be a disease of adults, has become a serious problem in adolescents. In the past two decades, there has been a dramatic increase in the incidence of T2DM in adolescents. Pediatric T2DM has been reported in all major ethnic groups in the USA and now accounts for 10–45% of newly diagnosed diabetes in teenagers (1–3). The rise in rates of T2DM in children and adolescents parallels the alarming increase of obesity in this age-group (4, 5), and in the USA this condition is uniformly associated with significant overweight. Despite the dramatic epidemiology of T2DM in youth and the challenge this now presents to clinicians, the pathophysiology is only beginning to be understood, and it is not clear how closely this condition mimics T2DM in adults.
Most children and adolescents affected with T2DM have clinical evidence of insulin resistance, and nearly all of the formal evaluations of these patients have noted significant reductions in insulin action (6–8). Most studies of diabetic youth have also noted impaired insulin secretion, not surprising given the centrality of β-cell dysfunction to the etiology of T2DM in adults (6, 7, 9). In particular, there appears to be a reduction of first-phase insulin release (FPIR), although there is some question as to whether this defect is as pronounced as the near absence of FPIR in diabetic adults. For example, in a previous study of T2DM adolescents and non-diabetic lean and obese controls, we noted that while the T2DM subjects had an inappropriate first-phase insulin response to intravenous (IV) glucose for their degree of insulin resistance, this parameter of β-cell function was measurable and comparable to lean controls (6). In addition, insulin and C-peptide levels during an oral glucose tolerance test (OGTT) were comparable, although at different glycemic levels. A similar finding of reduced, but present, first-phase insulin secretion was reported by Weiss et al. (8). These findings are compatible with some retention of insulin secretion in T2 diabetic youth, albeit at higher glycemic levels, and is consistent with the necessarily shorter duration of disease in younger patients.
In the present study, we sought to test the hypothesis that parameters of β-cell function that are well known to be abnormal in adult diabetes are preserved in affected adolescents. Therefore, we assessed β-cell sensitivity to glucose and maximal insulin secretory capacity in groups of teenagers with T2DM and age-and weight-matched controls. These measures of β-cell function are severely impaired in adults with T2DM (9, 10), and thus are potentially useful for elucidating age-specific differences in pathophysiology.
Methods
Subjects
Fifteen adolescent patients with T2DM and 10 non-diabetic obese subjects with similar ages and weights were recruited from Cincinnati Children’s Hospital Medical Center Hospital (CCHMC). Individuals with active concurrent illness, secondary diabetes, medication known to impair glucose metabolism, or pregnant individuals were excluded from the study. There was no difference in age, gender, or racial distribution or BMI between the two adolescent groups (Table 1). The subjects with diabetes had been diagnosed with diabetes for at least 1 yr (mean duration of diabetes 48.8 ± 6.4 months, range 12–90 months; Table 2). At the time of diagnosis, the adolescents with diabetes met criteria set forth by the American Diabetes Association for diagnosis of T2DM (11). None of the patients had markers of islet cell autoimmunity, using the conventional clinical screening (glutamic acid decarboxylase 65, islet cell antibody 512, insulin auto-antibody), and all had evidence of insulin resistance (acanthosis nigricans, elevated fasting plasma insulin, or c-peptide concentrations or both) at diagnosis. The adolescents with T2DM were treated with the typical regimens used at the CCHMC diabetes clinic, using insulin, metformin or diet, alone or in combination (4 insulin/7 metformin/3 insulin and metformin/1 diet; Table 2). Pubertal assessment was performed by a pediatric endocrinologist by inspection and palpation of glandular tissue (females) and gonads (males). Menstrual history was reviewed with females. As a group the diabetic subjects had good glycemic control with mean fasting glucose levels of 6.8 ± 0.5 mmol/L and HbA1c of 6.7 ± 0.3% [range 5.0–8.8, median 6.8%, data shown as ± standard error of the mean (SEM); Table 2]. The obese controls had normal glucose tolerance as measured by a 75-g OGTT, but all had clinical evidence of insulin resistance based on the presence of mild to moderate acanthosis nigricans, and none were taking medications that affect blood glucose. The control group was recruited from an obesity research program at Cincinnati Children’s Hospital, and all had had recent OGTT testing. We did not identify or include subjects with impaired glucose tolerance or impaired fasting glucose into this study. The diabetic subjects were asked to withhold their diabetes medications prior to study visits (3 d prior to study visit for metformin and 24 hr for glargine insulin). This study was approved by the CCHMC Institutional Review Board, and all subjects (or their parents, for those <18 year old) provided written informed consent, and subjects under 18 provided written assent to participate. Consenting subjects reported to the General Clinical Research Center at Cincinnati Children’s Hospital after an overnight fast for evaluation.
Table 1.
Baseline parameters
| DM (n = 15) | Control (n = 10) | p-value | |
|---|---|---|---|
| Age (yr) | 18.4 ± 0.3 (16.5–20.7) | 17.4 ± 0.5 (16.1–19.9) | NS |
| Sex (male/female) | 4/11 | 3/7 | NS |
| Race (black/white/other) | 8/6/1 | 7/3/0 | NS |
| BMI (kg/m2) | 39.8 ± 2.2 (27.5–57.9) | 41.5 ± 2.2 (32.7–55.8) | NS |
| Fasting glucose (mmol/L) | 6.8 ± 0.5 (3.9–9.2) | 4.7 ± 0.1 (4.3–5.3) | <0.01 |
| Fasting insulin (pmol/L) | 270.6 ± 42.6 (59.2–649.1) | 273.1 ± 58.7 (133.2–739.8) | NS |
| Fasting C-peptide (nmol/L) | 3.8 ± 0.5 (1.1–7.2) | 4.1 ± 0.7 (0.9–7.4) | NS |
| HbA1c % | 6.7 ± 0.3 (5.0–8.8) | – – |
– – |
BMI, body mass index; DM, diabetes mellitus; HbA1c, hemoglobin A1c; NS, not significant.
Data shown as ± standard error of the mean (SEM).
Table 2.
Duration and management of T2DM by subject
| Subject number | Age (yr) | DM duration (yr) | DM treatment | HbA1c % | Tanner stage |
|---|---|---|---|---|---|
| 1 | 18.7 | 4.4 | Metformin | 6.7 | 5 |
| 2 | 17.3 | 5.2 | Metformin/Glargine | 6.8 | 5 |
| 3 | 19.6 | 1.0 | Metformin | 6.8 | 5 |
| 4 | 18.2 | 6.3 | Metformin | 5.8 | 5 |
| 5 | 20.7 | 7.4 | Humalog (infusion pump) | 7.1 | 5 |
| 6 | 16.5 | 1.8 | Metformin/Glargine | 6.2 | 5 |
| 7 | 18.2 | 7.1 | Novolog/Glargine | 7.5 | 5 |
| 8 | 19.7 | 3.6 | Novolog/Glargine | 8.4 | 5 |
| 9 | 18.1 | 5.6 | Humalog (infusion pump) | 8.8 | 5 |
| 10 | 19.7 | 3.1 | Metformin | 5.3 | 5 |
| 11 | 18.4 | 4.1 | Metformin | 5.0 | 5 |
| 12 | 17.2 | 2.9 | Metformin | 5.7 | 5 |
| 13 | 18.7 | 1.8 | Metformin | 5.2 | 5 |
| 14 | 17.1 | 2.4 | None | 6.9 | 5 |
| 15 | 17.3 | 1.0 | Metformin/Glargine | 7.7 | 5 |
DM, diabetes mellitus; HbA1c, hemoglobin A1c; T2DM, type 2 diabetes mellitus.
β-cell function testing
IV catheters were placed in both forearms for infusion of test substances and blood sampling; the arm designated for blood drawing was wrapped in a heating pad to arterialize venous blood. Non-diabetic subjects were given a small bolus of regular insulin (0.004 units/kg) to reduce blood glucose modestly and allow the dose-response curve to be started approximately 10 mg/dL below fasting levels (12). In addition to receiving insulin to achieve blood glucose levels approximately 10 mg/dL below fasting levels, depending on fasting blood glucose levels, subjects with T2DM were treated with insulin to achieve a whole blood glucose target of 4.7 mM. For subjects with a fasting glucose < 5.5 mM, a bolus of regular insulin similar to the control subjects was given; for those with a fasting glucose of 5.5–6.1 a 2 unit bolus or 6.1–7.0 mM a 3 unit bolus was given; subjects with values 7.0–8.3 mM were treated with a 2 unit bolus followed by a 2 unit insulin infusion over 20 min; and those with fasting glucose of 8.3–9.7 mM received a 3 unit bolus followed by a 3 unit insulin infusion over 20 min. For all subjects, 20 min were allotted for exogenous insulin to clear before samples were drawn at −20, −10, and 0 min to define baseline glucose, insulin, and C-peptide levels. At time 0, a stepped infusion of glucose (20% dextrose) was started at a rate of 1 mg/kg/min for 40 min, followed by rates of 2, 4, and 8 mg/kg/min each for 40 min. Samples were taken at 10, 20, 30, and 40 min into each 40-min period for the measurement of insulin, C-peptide, and glucose.
Immediately after completion of the dose-response assessment, the glucose infusion rate was increased (650–999 mL/h) until a target whole blood glucose of greater than 19.4 mmol/L (350 mg/dL) was achieved. Three control subjects required a supplemental bolus of D50% to achieve this blood glucose goal. Once the blood glucose was at target, two baseline samples were obtained (−2 and 0) and 5 g of 10% arginine was administered IV over 30 s. Blood samples were obtained at 2, 3, 4, 5, 7, and 10 min after arginine injection.
All blood samples were immediately placed on ice and centrifuged to separate plasma within an hour of collection. Samples were stored at −80°C until processing.
Biochemical measurements
Plasma insulin was measured by radioimmunoassay as previously described (6). This assay uses a guinea pig anti-insulin serum that does not distinguish between proinsulin and fully processed insulin. HbA1c was measured using a modification of a high-performance liquid chromatography method using an Alliance 2690/2695 HPLC (Waters Corporation, Milford, MA, USA) and a PolyCAT A column (PolyLC Inc., Columbia, MD, USA) to separate the hemoglobin fractions by cation-exchange chromatography; HbA1c results are reported as percent of total hemoglobin. Plasma glucose measurements were made on whole blood using a YSI glucose analyzer (Yellow Springs Instrument, Yellow Springs, OH, USA). C-peptide was measured using a commercial RIA kit following the manufacturer’s specifications (Linco Inc., St. Louis, MO, USA).
Statistical analysis
Data were analyzed using SAS 9.1 (SAS Institute, Cary, NC, USA). Differences in baseline characteristics between groups were analyzed using χ2 or t-tests, as appropriate. β-cell sensitivity was analyzed as the insulin and C-peptide response to circulating glucose during the graded infusion using participants’ mean insulin, glucose, and C-peptide concentrations for each glucose infusion rate. Data were analyzed using repeated measures analysis of variance (PROC MIXED), with intercepts and slopes permitted to vary among participants, and assuming no particular correlation pattern among an individual’s data points (i.e., unstructured correlation matrix). Mixed models account for correlations among data points from the same individual to estimate the slope and SE appropriately. Differences in slope between diabetic and non-diabetic subjects were determined by introducing an interaction term (diabetes status × glucose) into the mixed model. The potentiation of arginine-stimulated insulin secretion by hyperglycemia (AIRmax) was determined by computing the average increment in the insulin concentrations at 2, 3, 4, 5, 7, and 10 min after arginine administration over the average of the two prearginine baseline levels (10). Differences in AIRmax between the diabetic and non-diabetic subjects were assessed using an unpaired t-test. Data in tables are presented as mean ± standard deviation (SD), with figures depicting mean ± SEM. Statistically significant results were defined as those with p-values ≤ 0.05.
Results
β-cell sensitivity to glucose
Fasting plasma glucose on the morning of the study was 6.8 ± 0.5 in the diabetic subjects and 4.7 ± 0.1 in the non-diabetic controls (p < 0.01). There was no difference in insulin and c-peptide levels in the two groups at the initiation of the study (Table 1). Following insulin treatment, plasma glucose levels decreased in both groups toward the target level of 4.7 mM by time 0 (non-diabetic 4.1 ± 0.1 mM and diabetic 5.7 ± 0.4 mM; p = 0.002).
The circulating glucose, insulin, and C-peptide concentrations achieved at each stage of the graded glucose infusion are shown in Fig. 1. Starting from similar glucose levels at time 0, the diabetic subjects had significantly higher circulating glucose concentrations at each step in the glucose ramp (Fig. 1A). Insulin concentrations in the diabetic and non-diabetic subjects began to separate during the 2 mg/kg/min infusion rate, and were twice as high in the control subjects by the end of the infusion protocol (Fig. 1B). The C-peptide profiles were similar to that for insulin, with significantly lower levels in the adolescents with T2DM compared to the control subjects (Fig. 1C).
Fig. 1.

Glycemic and hormone responses to graded glucose infusion. Mean ± standard error of the mean (SEM) presented for each time point. (A) Circulating glucose, (B) insulin, and (C) C-peptide. Symbols used within figures: black triangles represent controls and black circles represent subjects with type 2 diabetes mellitus (T2DM).
Figure 2A displays the insulin-glucose dose responses for the diabetic and non-diabetic subjects and Fig. 2B shows the predicted C-peptide response to circulating glucose calculated from mixed models. Control subjects exhibited a significant insulin response to circulating glucose (β± SE: 280.5 ± 57.8 pmol insulin/mmol glucose, p < 0.0001), whereas diabetic subjects’ response was blunted (34.8 ± 11.9 pmol/mmol, p = 0.006; Fig. 2A). The difference in slopes between groups was highly significant (p for interaction < 0.0001). Similarly, the rise in C-peptide in response to increasing glucose was significant in both subject groups (control: 1.76 ± 0.17 nmol C-peptide/mmol glucose, p < 0.0001; T2DM: 0.44 ± 0.10 nmol/mmol, p < 0.0001; Fig. 2B), with a significantly higher response in the control group than the diabetic group (p < 0.0001 for interaction).
Fig. 2.

A) Insulin response to circulating glucose. Predicted slopes and 95% confidence limits presented from longitudinal mixed model. Black triangles represent controls and black circles represent subjects with type 2 diabetes mellitus (T2DM). Inset: estimates of the slope [±standard error (SE)] between insulin and circulating glucose. B) C-peptide response to circulating glucose. Predicted slopes and 95% confidence limits presented from longitudinal mixed model. Black triangles represent controls and black circles represent subjects with T2DM. Inset: estimates of the slope (±SE) between C-peptide and circulating glucose.
Maximal glucose potentiation of arginine-induced insulin secretion (AIRmax)
The potentiation of arginine-stimulated insulin secretion by glucose reaches an asymptote at glycemic levels > 22 mM and has been termed maximal insulin secretory capacity (9, 10). The whole blood glucose levels for testing AIRmax were similar in the two groups of subjects (control 20.7 ± 0.7, T2DM 20.8 ± 0.4 mmol/L, p = 0.84). This would convert to plasma glucoses of 402–437 mg/dL or 22–24 mM. AIRmax was substantially reduced in the diabetic group to a level approximately one third of the response observed in the non-diabetic control subjects (control 4445 ± 606, T2DM 1868 ± 330, p = 0.0005; Fig. 3A, B).
Fig. 3.
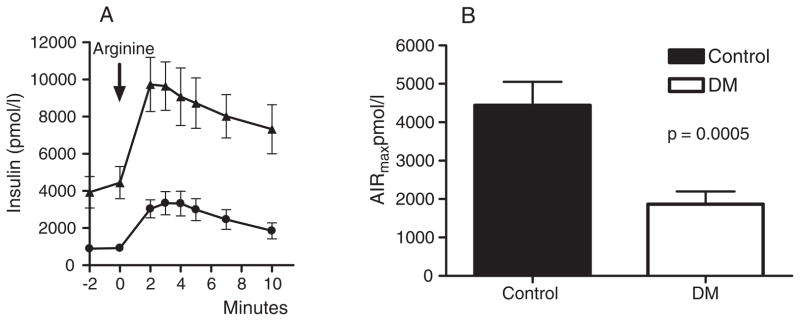
AIRmax in diabetic and control subjects. A) Insulin response to arginine. Mean ± standard error of the mean (SEM) presented for each time point. Black triangles represent controls and black circles represent subjects with type 2 diabetes mellitus (T2DM). B) AIRmax by subject group.
Discussion
In this study, we observed that adolescents with T2DM have marked impairment in β-cell responses to glucose, manifest as either a decreased sensitivity to changing plasma glucose concentrations or the potentiation of the non-glucose insulin secretagogue arginine. Unlike our previous study using oral and IV glucose tolerance tests, plasma insulin concentrations following stimulation did not approach those of the age- and weight-matched control group, whether at relative or matched levels of hyperglycemia. These findings suggest that when studied with matched β-cell stimuli, adolescent patients with T2DM have a severe impairment in the secretory response to hyperglycemia that is comparable in magnitude to what has been described for adult diabetic patients previously. On the basis of these results, the severe defects in insulin secretion that mark T2DM are present even in teenagers with a relatively short duration of disease.
In our previous study of a similar cohort of diabetic teens, we noted that the absolute levels of insulin and C-peptide in response to oral glucose or an IV glucose bolus was comparable to controls, although inappropriately reduced for the degree of hyperglycemia or insulin resistance (6). This differs with the classic descriptions of β-cell function in adults with type 2 diabetes in whom the insulin response to oral glucose is lower (13–15) and in whom first-phase insulin secretion in response to glucose is nearly absent (15, 16). In the current study, we included a group of diabetic subjects, typical for the expanding population of adolescent T2DM patients cared for in our clinic (17), and comparable to the subjects in our previous study in age and clinical characteristics (6). We chose methods to test β-cell function that were well established in studies of adults with T2DM (9, 10, 12), and which control for the differences in glucose regulation in the diabetic and control groups. Importantly, the techniques used in this study are better suited to delineate the degree of β-cell function than those we used in our previous study. Insulin concentrations during an OGTT can give a misleading impression of β-cell function when glucose levels differ substantially among study groups as they did in our first report. When insulin secretion was compared as a function of plasma glucose, or at matched levels of hyperglycemia, the substantial abnormalities in the teenage diabetics were readily apparent. The diabetic subjects in our initial report (6), who were very comparable to those in this study, retained first-phase insulin secretion, a response that is almost entirely lost in adult diabetics. We cannot explain this discrepancy given the similar impairments of β-cell glucose sensitivity and AIRmax in the adolescents described here and in adults with T2DM. However, before any claims of a distinct pathogenesis of insulin secretion in adolescents with T2DM can be made, comprehensive assessments of larger groups of subjects are needed.
The stepped glucose infusion, and analysis of plasma insulin and C-peptide as a function of plasma glucose, has become a reliable means of testing β-cell sensitivity to glucose (12). This technique has been used to distinguish systematic variation in insulin secretion in specific groups of patients with disorders of glucose metabolism such as impaired glucose tolerance (18), polycystic ovarian syndrome (19), type 2 diabetes in adults (9), and in subsets of maturity onset diabetes of youth (20). The key features in these studies were a linear increase in insulin secretion across the periphysiologic range of glucose obtained with the graded glucose infusion and a right shifted and blunted response in affected subjects relative to controls. When expressed as the mean of individual slopes of insulin or C-peptide response to increasing glucose, our diabetic teens had β-cell sensitivities to glucose that were approximately 10–20% of the control group. This is similar in magnitude to the relative decrement in β-cell secretion of adult diabetic subjects, using diet or oral medications as treatment (21). Druet and colleagues previously reported variability of insulin secretion to graded glucose among six obese adolescents with T2DM, with half having severely impaired responses and the others a more preserved response (22). However, this study did not include non-diabetic controls, and even the subjects reported as having better insulin secretion had responses similar to adults with T2DM or subjects with maturity onset diabetes of the youth (MODY) (21, 23). The results of the current study indicate that even in adolescents with well-controlled T2DM, β-cell sensitivity to glucose is markedly attenuated.
The diabetic subjects in this study also had severe impairment of AIRmax. Glucose potentiates the insulin response to non-glucose secretagogues such as arginine, an effect that reaches a maximum at plasma glucose levels of 20–25 mM (10). AIRmax has been proposed as a surrogate for islet cell mass based on studies in animal models with partial pancreatectomy (24), and in humans after islet autotransplantation (25), and is generally accepted as the best functional estimate of the number of β-cells in vivo. The diabetic subjects in this study had values for AIRmax that were approximately 40% of controls, similar to what has been reported in adults with T2DM (10), and indicative of a severe reduction in insulin secretory capacity. This finding suggests that AIRmax, a measure that has been taken to reflect slowly the adapting aspects of islet function, such as β-cell mass, can decline over the relatively short period of time that adolescents are thought to have T2DM. Another possibility raised by this result is that adolescents who will develop T2DM in the setting of insulin resistance have a decreased β-cell mass even before they have hyperglycemia.
The findings reported herein extend what is currently known about insulin secretion in adolescents with T2DM by demonstrating severe impairments in the response to glucose using two sensitive methods for distinct components of β-cell function. Our finding of blunted β-cell sensitivity to glucose is compatible with two previous studies that used modeling of insulin and C-peptide data from OGTTs (26) or hyperglycemic clamps (8). In both of these studies, model parameters of β-cell glucose sensing were notably diminished in diabetic compared to obese teenagers and young adults, and relatively more impaired than insulin sensitivity. From what is known about the pathophysiology of diabetes in adolescents it appears that β-cell dysfunction is the central component, although T2DM in this age-group is universally associated with obesity and insulin resistance.
There are several important limitations to this study that must be considered in the interpretation of our findings. One of the major questions surrounding T2DM in adolescents is whether, and how much, it resembles the condition in adults where there is considerably more information on mechanism of disease. However, it is difficult to obtain appropriate adult controls for adolescent diabetics. The time between onset of disease and diagnosis and treatment of T2DM in adults is estimated to be 5–10 yr, a period that seems implausible for the natural history of T2DM in teenagers. We have tried to juxtapose our findings with previous studies of β-cell glucose sensitivity and AIRmax in adults with T2DM, but while we have used similar methodologies these comparisons are by necessity indirect. A second limitation is the small and ethnically diverse sample making up our cohorts. While the diabetic and controls groups are representative of our clinic population, the small numbers of African-American and Caucasian subjects preclude definitive comparisons based on ethnicity. A third limitation of this manuscript is the heterogeneity of our study population. Three patients in the current study had a diabetes duration of > 6 yr. Although their HbA1c demonstrated good glycemic control (5.5, 7.1, 7.5), two of these subjects used insulin to manage their diabetes. However, sensitivity analysis excluding patients with longer duration of diabetes did not alter the results. A fourth limitation is that we do not have direct measurements of insulin sensitivity in our diabetic and control groups. In non-diabetic subjects, insulin secretion is proportional to insulin resistance such that persons with greater insulin sensitivity have lower insulin responses to a given stimulus. However, previous studies have been uniform in showing that adolescents with T2DM have greater or equivalent degrees of insulin resistance as weight-matched controls (6–8). Therefore, it seems unlikely that the reduced insulin secretion in our diabetic cohort is in any way a function of greater insulin sensitivity. Finally, we used an insulin RIA that did not distinguish between proinsulin and insulin. While some groups have reported increased levels of proinsulin in adolescents with T2DM (6), we and others have not seen this (7, 8). Regardless, accounting for any greater insulin resistance or a contribution of proinsulin to our plasma insulin measures would only have amplified the major findings in this study.
In summary, adolescents with T2DM have profound impairments of β-cell sensitivity to glucose and maximal insulin secretory capacity that are comparable in relative magnitude to what has been reported previously for adult subjects with diabetes. Our study cannot distinguish whether these abnormalities are long-standing, or even lifelong, with slow progression or whether they develop more rapidly in the years before clinical onset of disease. It seems clear that abnormal insulin secretion in combination with the insulin resistance present in obese teens is the key lesion leading to dysregulated glucose metabolism. The findings presented here show that adolescents with T2DM share key defects of β-cell function with diabetic adults, and raise the disconcerting possibility that islet cell dysfunction may also worsen over time in younger as it does in older diabetic patients.
Acknowledgments
We thank Kay Ellis and Clinton Elfers for their careful measurement of plasma hormones. These studies were carried out in the Clinical Research Center at CCHMC (#M01 RR 08084), and we thank the nurses for their expertise with the protocols and their care of the research subjects. The study was funded by NIH 5K23DK070775-03 (to D. E.) and R01DK57900 (to D. D.).
References
- 1.Hannon TS, Rao G, Arslanian SA. Childhood obesity and type 2 diabetes mellitus. Pediatrics. 2005;116:473–480. doi: 10.1542/peds.2004-2536. [DOI] [PubMed] [Google Scholar]
- 2.Bobo N, Evert A, Gallivan J, et al. An update on type 2 diabetes in youth from the National Diabetes Education Program. Pediatrics. 2004;114:259–263. doi: 10.1542/peds.114.1.259. [DOI] [PubMed] [Google Scholar]
- 3.Duncan GE. Prevalence of diabetes and impaired fasting glucose levels among US adolescents: National Health and Nutrition Examination Survey, 1999–2002. Arch Pediatr Adolesc Med. 2006;160:523–528. doi: 10.1001/archpedi.160.5.523. [DOI] [PubMed] [Google Scholar]
- 4.Hedley AA, Ogden CL, Johnson CL, Carroll MD, Curtin LR, Flegal KM. Prevalence of overweight and obesity among US children, adolescents, and adults, 1999–2002. Jama. 2004;291:2847–2850. doi: 10.1001/jama.291.23.2847. [DOI] [PubMed] [Google Scholar]
- 5.Ogden CL, Carroll MD, Curtin LR, McDowell MA, Tabak CJ, Flegal KM. Prevalence of overweight and obesity in the United States, 1999–2004. Jama. 2006;295:1549–1555. doi: 10.1001/jama.295.13.1549. [DOI] [PubMed] [Google Scholar]
- 6.Elder DA, Prigeon RL, Wadwa RP, Dolan LM, D’Alessio DA. Beta-cell function, insulin sensitivity, and glucose tolerance in obese diabetic and nondiabetic adolescents and young adults. J Clin Endocrinol Metab. 2006;91:185–191. doi: 10.1210/jc.2005-0853. [DOI] [PubMed] [Google Scholar]
- 7.Gungor N, Bacha F, Saad R, Janosky J, Arslanian S. Youth type 2 diabetes: insulin resistance, beta-cell failure, or both? Diabetes Care. 2005;28:638–644. doi: 10.2337/diacare.28.3.638. [DOI] [PMC free article] [PubMed] [Google Scholar]
- 8.Weiss R, Caprio S, Trombetta M, Taksali SE, Tamborlane WV, Bonadonna R. Beta-cell function across the spectrum of glucose tolerance in obese youth. Diabetes. 2005;54:1735–1743. doi: 10.2337/diabetes.54.6.1735. [DOI] [PubMed] [Google Scholar]
- 9.Polonsky KS. Lilly Lecture 1994. The beta-cell in diabetes: from molecular genetics to clinical research. Diabetes. 1995;44:705–717. doi: 10.2337/diab.44.6.705. [DOI] [PubMed] [Google Scholar]
- 10.Ward WK, Bolgiano DC, McKnight B, Halter JB, Porte D., Jr Diminished B cell secretory capacity in patients with noninsulin-dependent diabetes mellitus. J Clin Invest. 1984;74:1318–1328. doi: 10.1172/JCI111542. [DOI] [PMC free article] [PubMed] [Google Scholar]
- 11.Standards of medical care in diabetes–2007. Diabetes Care. 2007;30 (Suppl 1):S4–S41. doi: 10.2337/dc07-S004. [DOI] [PubMed] [Google Scholar]
- 12.Byrne MM, Sturis J, Polonsky KS. Insulin secretion and clearance during low-dose graded glucose infusion. Am J Physiol. 1995;268:E21–E27. doi: 10.1152/ajpendo.1995.268.1.E21. [DOI] [PubMed] [Google Scholar]
- 13.Mari A, Tura A, Pacini G, Kautzky-Willer A, Ferrannini E. Relationships between insulin secretion after intravenous and oral glucose administration in subjects with glucose tolerance ranging from normal to overt diabetes. Diabet Med. 2008;25:671–677. doi: 10.1111/j.1464-5491.2008.02441.x. [DOI] [PubMed] [Google Scholar]
- 14.Dinneen S, Gerich J, Rizza R. Carbohydrate metabolism in non-insulin-dependent diabetes mellitus. N Engl J Med. 1992;327:707–713. doi: 10.1056/NEJM199209033271007. [DOI] [PubMed] [Google Scholar]
- 15.Seltzer HS, Allen EW, Herron AL, Brennan MT. Insulin secretion in response to glycemic stimulus: relation of delayed initial release to carbohydrate intolerance in mild diabetes mellitus. J Clin Invest. 1967;46:323–335. doi: 10.1172/JCI105534. [DOI] [PMC free article] [PubMed] [Google Scholar]
- 16.Brunzell JD, Robertson RP, Lerner RL, et al. Relationships between fasting plasma glucose levels and insulin secretion during intravenous glucose tolerance tests. J Clin Endocrinol Metab. 1976;42:222–229. doi: 10.1210/jcem-42-2-222. [DOI] [PubMed] [Google Scholar]
- 17.Pinhas-Hamiel O, Dolan LM, Daniels SR, Standiford D, Khoury PR, Zeitler P. Increased incidence of non-insulin-dependent diabetes mellitus among adolescents. J Pediatr. 1996;128:608–615. doi: 10.1016/s0022-3476(96)80124-7. [DOI] [PubMed] [Google Scholar]
- 18.Ehrmann DA, Breda E, Cavaghan MK, et al. Insulin secretory responses to rising and falling glucose concentrations are delayed in subjects with impaired glucose tolerance. Diabetologia. 2002;45:509–517. doi: 10.1007/s00125-002-0776-y. [DOI] [PubMed] [Google Scholar]
- 19.Ehrmann DA, Sturis J, Byrne MM, Karrison T, Rosenfield RL, Polonsky KS. Insulin secretory defects in polycystic ovary syndrome. Relationship to insulin sensitivity and family history of non-insulin-dependent diabetes mellitus. J Clin Invest. 1995;96:520–527. doi: 10.1172/JCI118064. [DOI] [PMC free article] [PubMed] [Google Scholar]
- 20.Herman WH, Fajans SS, Ortiz FJ, et al. Abnormal insulin secretion, not insulin resistance, is the genetic or primary defect of MODY in the RW pedigree. Diabetes. 1994;43:40–46. doi: 10.2337/diab.43.1.40. [DOI] [PubMed] [Google Scholar]
- 21.Kjems LL, Holst JJ, Volund A, Madsbad S. The influence of GLP-1 on glucose-stimulated insulin secretion: effects on beta-cell sensitivity in type 2 and nondiabetic subjects. Diabetes. 2003;52:380–386. doi: 10.2337/diabetes.52.2.380. [DOI] [PubMed] [Google Scholar]
- 22.Druet C, Tubiana-Rufi N, Chevenne D, Rigal O, Polak M, Levy-Marchal C. Characterization of insulin secretion and resistance in type 2 diabetes of adolescents. J Clin Endocrinol Metab. 2006;91:401–404. doi: 10.1210/jc.2005-1672. [DOI] [PubMed] [Google Scholar]
- 23.Byrne MM, Sturis J, Fajans SS, et al. Altered insulin secretory responses to glucose in subjects with a mutation in the MODY1 gene on chromosome 20. Diabetes. 1995;44:699–704. doi: 10.2337/diab.44.6.699. [DOI] [PubMed] [Google Scholar]
- 24.Ward WK, Wallum BJ, Beard JC, Taborsky GJ, Jr, Porte D., Jr Reduction of glycemic potentiation. Sensitive indicator of beta-cell loss in partially pancreatectomized dogs. Diabetes. 1988;37:723–729. doi: 10.2337/diab.37.6.723. [DOI] [PubMed] [Google Scholar]
- 25.Teuscher AU, Kendall DM, Smets YF, Leone JP, Sutherland DE, Robertson RP. Successful islet autotransplantation in humans: functional insulin secretory reserve as an estimate of surviving islet cell mass. Diabetes. 1998;47:324–330. doi: 10.2337/diabetes.47.3.324. [DOI] [PubMed] [Google Scholar]
- 26.Burns N, Finucane FM, Hatunic M, et al. Early-onset type 2 diabetes in obese white subjects is characterised by a marked defect in beta cell insulin secretion, severe insulin resistance and a lack of response to aerobic exercise training. Diabetologia. 2007;50:1500–1508. doi: 10.1007/s00125-007-0655-7. [DOI] [PubMed] [Google Scholar]