Abstract
Previous studies of movement characteristics in tennis have considered the effect of playing surface but have assumed that playing strategies are simply determined by the surface as opposed to being under an individual’s control. This study considered the selection of cross court or down the line ground strokes as being indicative of playing strategy and measured the outcome of playing these shots in terms of the opponent’s movements. Matches (N = 8) at the 2011 ATP tournament 500 Valencia were recorded and analysed using SAGIT, a computer vision tracking system that allowed both players’ movements to be tracked automatically, albeit with operator supervision. The data was split into (N = 188) games for analysis purposes and these lasted a median 174.24 seconds with active time (ball in play) a median proportion of 34.89% (IQR = 10.64%) of total time. During the active time losers of games tended to cover less distance (median = 80.17 m), move quicker (median = 1.38 m·s-1), spend more time in the defensive zones (median = 14.24 s) and less in the offensive zones (median = 44.74 s). These results suggested that game winners tended to dominate game losers, forcing them to exhibit behaviors typically associated with a defensive strategy. Defensive and offensive strategy are not well defined currently and future investigations should consider movements in relation to individual shots, in particular their velocities, at the rally level and by different individuals to better understand successful performance.
Key Points.
During the active time losers of games covered less distance, moved quicker, spend more time in the defensive zones and less in the offensive zones.
These results suggested that game winners tended to dominate game losers, forcing them to exhibit behaviors typically associated with a defensive strategy.
There are no differences between the proportion of cross court shots and down the line shots played by game winners and game losers.
Future research should consider individual shots at the rally level to better understand successful performance and ultimately strategy.
Key words: Motion analysis, tactics, winners, losers, differences
Introduction
Tennis is a dynamic and complex game in which players repeatedly make decisions regarding positioning and shot selection (O’Donoghe and Ingram, 2001). Notational analysis allows these dynamic and complex situations to be measured objectively, in a consistent and reliable manner, so that critical events can be quantified during tennis competition (Gillet et al., 2009; Hughes and Barlett, 2007). This type of analysis has been widely applied to racket sports in four main areas, tactical evaluation, technical evaluation, movement analysis and for creating databases and modelling (Hughes et al., 2007).
A significant number of studies have addressed different performance indicators in tennis such as timing factors (Hughes and Clarke, 1995; O’Donoghue and Liddle, 1998), rally length (O’Donoghue and Ingram, 2001), point profiles (O’Donoghue, 2006), serve and serve-return performance (Gillet et al., 2009; Hizan et al., 2011; Loffing et al., 2009), patterns of play (Hughes and Clarke, 1995) and distance covered (Fernandez-Fernandez et al., 2009; Filipcic et al., 2006; Suda et al., 2003).
Other studies about elite tennis strategies determined the influence of the gender of the player and court surface on elite tennis strategy showing that both variables have a significant influence on the nature of singles tennis at Grand Slam tournaments in terms of rally types (baseline or net) and length (O’Donoghue and Ingram, 2001). In a similar manner O’Donoghue, 2006 analysed the influence of the type of game (normal or tie-break) on the type of point (net or baseline) for male and female players and found that female players play more cautiously during tie-breaks than during normal games by staying at the baseline to a greater extent, however male players did not have a significant reduction in net points during tie-breaks.
Previous movement analysis studies have shown that the winner of a professional singles match of 66 minutes duration covered 3705 meters in comparison to the loser who covered 3045 meters (Martínez-Gallego et al., 2012). Suda et al. (2003) analyzed a female singles match of 82 minutes duration and found that one of the players covered 6932 meters. Filipcic et al. (2006) analyzed the distance covered by male and female young players, comparing the two genders and the winners with losers, and found no significant differences in any comparison. On the other hand, Fernandez-Fernandez et al. (2009) in a comparative study on activity profiles and physiological demands of advanced and recreational level veteran players, analyzed the distances travelled by both groups of players, found significantly higher values for distance travelled by the advanced level players.
Whilst the importance of the direction of groundstroke shots has been recognized by coaches and players, the scientific literature has not adequately investigated this aspect of the game. The literature on anticipation in racket sports has recognised that players are able to determine where a shot is to be played prior to the shot being played (for a review see James and Patrick, 2004). However, James and Bradley, 2004 maintained that much of the anticipatory behavior seen in studies of player movements in racket sports was a consequence of players’ assessments of situational probabilities based on previous knowledge of likely shot selection. In other words shot selection was thought to be determined, to some extent, by the previous shot and court location of the two players. To date there is also a dearth of literature providing information about the distance covered by elite players. Consequently, the aim of this research was to analyze the distance covered in relation to the direction of groundstrokes and to establish whether there are differences between winners and losers.
Methods
Sample of matches and participants
Matches were recorded at the ATP tournament 500 Valencia (n = 8) in 2011 containing 11 professional players (age 24.8 ± 2.9) ranked between 5 and 113 on the ATP ranking list during the tournament. A university ethics committee granted ethical approval and informed written consent was obtained from the organizing committee of the tournament.
Procedure
During the competition all matches were recorded with two IP cameras (Bosch Dinion IP 455, Germany) that were attached to the ceiling above the court with each one covering half of the court (Figure 1). The cameras were then connected to a laptop (located outside the court) to save all video footage in mpeg-4 format.
Figure 1.
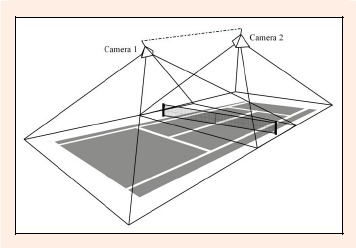
Camera locations and video image captured.
The final digital images had a resolution of 384 x 288 pixels at 25 frames per second to avoid video interlacing problems. A flash from a digital camera was used to synchronise the two video footages prior to each match. Digital images were processed by the SAGIT tracking system that allowed both players’ movements to be tracked automatically, albeit with operator supervision, using a computer vision method (Perš et al., 2002; Vuckovic et al., 2010). This procedure involved several stages including calibrating the system to the empty court, a tracking phase and manual notation of players’ activity (stroke type, stroke outcome and start and end of rallies). This activity information was added such that both the movement and event data were synchronised, and hence could be assessed in relation to each other when exported into spreadsheet format. Specific data of interest e.g. positions of players during a particular activity type (Perš et al., 2005) were identified through a combination of SQL statements in Microsoft Access (Microsoft, Redmond, USA) and data sorting techniques in Microsoft Excel.
Data treatment
All matches were divided into games for analysis, 188 games in total, to see if this would differentiate performance between winners and losers of games. This meant that players could be classified as losers (game losers) even if they subsequently won the match (since match outcome was not used as a measure).
The software was programmed to divide each half of the court into offensive (OZ) and defensive zones (DZ) (Figure 2). The OZ comprised the whole court area from 1.5 m behind the baseline to the net, where it was thought the player would be in a state of equilibrium with his opponent or on the offensive and as such could take some risk to attack the opponent if he decided to. When the player was in the DZ it was thought that the aim of the player would be to minimize risk and try to recover to the centre of the court. By separating the court in this manner in the software information could be collected regarding players’ motion in each zone and all zone specific information could be calculated as a proportion of total time (ball in play (active) and ball not in play (passive)). All shots were manually added using the frame-by-frame playback facility in the software. All shots contained information regarding shot type (serve, ground stroke, volley, drop), outcome (rally continue, error, winner) and direction (cross court or down the line). Only ground strokes (cross court and down the line) were analyzed for the purpose of this study.
Figure 2.
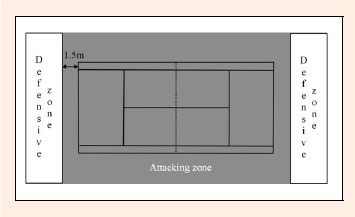
Offensive and defensive zones.
Statistical analysis
All data was exported from SAGIT software to Microsoft Excel and SPSS v18 for analysis. All data were examined for normality (Shapiro-Wilks) and with some departures from normality, multiple outliers and large differences in variance noted, non-parametric tests and descriptive statistics were used. Wilcoxon signed ranks tests were used to test for differences between game winners and losers. Spearman’s rho was used to assess correlations between variables.
Results
Games lasted a median 174.24 seconds (minimum = 50s, maximum 716s) with active time (ball in play) a median proportion of 34.89% (IQR = 10.64%) of total time. As would be expected total match time correlated well with active (r = 0.92) and passive time (r = 0.95). However the relationship between the proportionate ball in play time and total match time was very low (r = 0.16).
Winners and losers of games unsurprisingly had similar activity profiles during passive (ball out of play) time covering between 21.3m and 392.38m at average velocities between 0.40 m·s-1 and 1.12 m·s-1. However losers tended to cover less distance (median = 80.17 m, Figure 3) during the active phases than winners (median = 84.17m; z = 3.81, p < 0.001) with a very high correlation between the distances run by the two players (r = 0.94).
Figure 3.
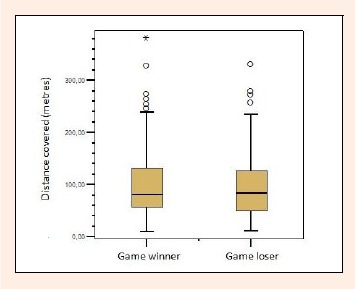
Distance covered during active (ball in play) period of a game.
However losers tended to move quicker (median = 1.38 m·s-1, Figure 4) during the active phases than winners (median = 1.33 m·s-1; z = 4.39, p < 0.001) with the correlation between the players’ speeds reasonably strong (r = 0.51).
Figure 4.
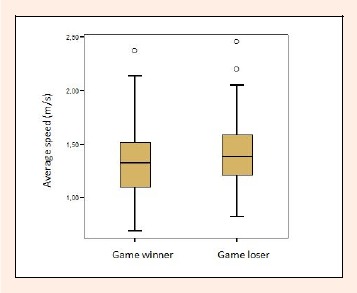
Average speed during active (ball in play) period of a game.
Since a fundamental component of tennis is not only moving the opponent around the court but to try to put the opponent into more defensive areas of the court (as opposed to attacking areas) a further analysis was undertaken on movement characteristics in the attacking and defending zones during the active periods of the game.
Both winners and losers tended to spend more time in the offensive zones compared to the defensive zones (Figure 5) although game losers tended to spend more time (z = 5.89, p < 0.01) in the defensive zones (median = 14.24s) than the winners (median = 5.86s) and less time in the offensive zones (median = 44.74s) than the winners (median = 50.88s).
Figure 5.
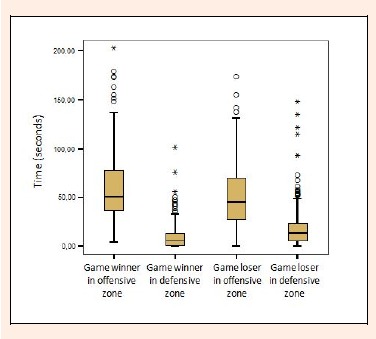
Time spent in offensive and defensive zones during active period of a game.
The time spent by game winners in the offensive zone correlated more strongly with the time spent by game losers in the offensive zone (r = 0.73; Figure 6) than with the time spent by losers in the defensive zone (r = 0.61; Figure 7). Similarly the time spent by game winners in the defensive zone correlated more strongly with the time spent by losers in the offensive zone (r = 0.64) than with the time spent by losers in the defensive zone (r = 0.15).
Figure 6.
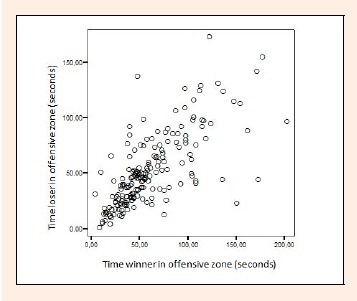
Relationship between time in offensive zone by winner with time in offensive zone by loser.
Figure 7.
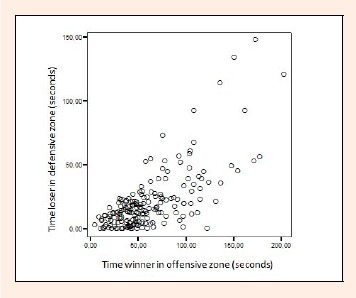
Relationship between time in offensive zone by winner with time in defensive zone by loser.
The time spent in a zone correlated very strongly with the distance covered in that zone (correlations ranged between 0.93 and 0.98). Game winners tended to cover a more distance (median = 62.99m) than losers (median = 61.16m) in the offensive zones (z = 2.98, p < 0.01) and their average speed was less (median=1.25m/s) than the losers (median = 1.38 m·s-1; z = 5.93, p < 0.01). However, game losers tended to cover more distance (median = 19.78 m) than the winners (median = 10.66m) in the defensive zones (z = 4.67, p < 0.001) and their average speed was also less (median = 1.50 m·s-1) than the winners (median = 1.80 m·s-1; z = 2.22, p = 0.03). The average speed by a player in any zone did not strongly correlate with the time spent in that zone (correlations ranged between -0.05 and 0.34) or distance covered in that zone (correlations ranged between 0.03 and 0.45).
The incidence of down the line and cross court shots (excluding serves, service return and volleys) were analyzed to determine whether the time and movement characteristics in the different zones could have been a consequence of different shot selections. There was no difference in the proportionate frequency of down the line and crosscourt drives out of all shots between the winners (median = 64.29%) and losers (median = 63.64%; z = 1.39, p = 0.16). However losers tended to play more crosscourt shots (median = 7; Figure 8) than winners (median = 6; z = 4.91, p < 0.001) and more down the line shots (median = 4) than winners (median = 3; z = 5.18, p < 0.001).
Figure 8.
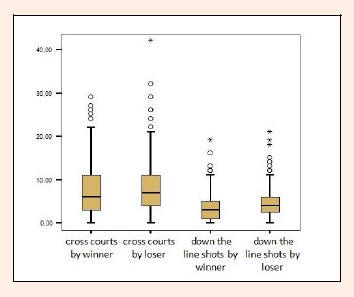
Frequency of down the line and cross court shots by game winners and losers.
At the game level there was no relationship (r = 0.08) between the proportionate occurrence of cross court shots by one player and the other (Figure 9).
Figure 9.
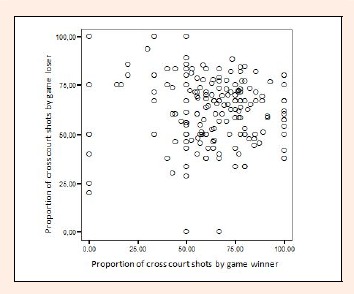
Tendency for game winners and losers to play cross court shots.
Discussion
In this study, winners covered more distance during the active phases than losers which differs from previous studies that have found no significant differences between winners and losers in terms of distance covered (Martínez-Gallego et al., 2012; Filipcic et al., 2006). However, these previous studies analyzed total time, rather than distinguishing between active and passive time, like this study. This makes it unlikely that differences would be found since there is more passive time (about 65% of total time) than active time and both players are likely to perform very similar activity profiles during the passive time. Moreover the activity profile during the passive phase is of limited interest with respect to game play.
The finding that game winners covered more distance during ball in play time than losers is maybe counterintuitive but it is likely that a simple average value is not particularly informative on this occasion. The data used here involved different players who were at times both game winners and losers and hence particular types of player e.g. defense oriented, may have affected the results enough to change the overall findings. In order to discriminate winner and loser differences it may be more advisable to consider winners and losers at the rally level rather than game level and consider individual player profiles as opposed to average values for a number of players.
Game winners spent less time in the defensive zones than losers which was to be expected as the winner of rallies in squash were shown to spend more time in the offensive zone, which also allowed winners to move opponents away from the center of the court (Vuckovic et al., 2009).
Some previous studies have showed how players’ strategies have a high influence on energy demands, which were greater for players who used defensive or counterattacking strategies (Martínez-Gallego et al., 2012; Fernández et al., 2006; Smekal et al., 2001). Logically, players who cover greater distances and/or at faster speeds will have higher energy demands which might indicate a more defensive strategy i.e. tending to chase after balls rather than hitting aggressive shots. The losers in this study tended to cover less distance but at higher speeds supporting the hypothesis that winners tended to force losers to adopt more defensive tactics. This conjecture was also supported by the finding that game losers tended to spend more time, and cover more distance, in the defensive zones than the winners. The data supports the contention that winners take the ball earlier more often than the losers of games and the consequence of this is that the opponent is forced to play the ball in the defensive area more often. This is likely to be due to an accurate shot by the game winner or an inaccurate one by the game loser. Other factors such as the speed or recovery ability of a player could also account for these differences but this data sample contained the same mixture of players in both winner and loser categories.
A player’s movements are largely dictated by the opponent’s choice of shot, which in turn is likely to be influenced by the previous shot and the court location of the two players (James and Bradley, 2004). Shot selections therefore determine player movements and may confer information about a player’s strategy. On this basis the direction of groundstrokes was analyzed and the results obtained show how shot types and shot locations are insufficient indicators of strategy since ball velocity has not been considered. It may be the case, for example, that it is the pace of the shot that is more important than the direction.
Playing strategy has also been shown to be a consequence of court surface (O’Donoghue and Ingram, 2001; Fernández et al., 2006). Matches analyzed in this study were played on an indoor hard surface, classified as Category 3 (Medium) pace, in the International Tennis Federation classification of court surfaces. On this basis the results of this study have been expected as conventional wisdom and coaches’ manuals (Crespo and Miley, 1999) suggests that more offensive strategies should be applied on this type of surface. These results confirm that the more successful performances tended to be more typical of offensive strategies i.e. players covered less distances and played shots from more forward positions.
The extent to which sampling procedures affected the results of this study are difficult to gauge precisely but caution must be taken when considering the external validity of this study due to the small sample size. For example some of the results here may have be outliers in relation to a study with a larger sample. Whilst this may or may not have been true, the finding that the percentage of active time (in relation to total time) was a median of 34.89% (SD = 10.64%) was far higher than found in any previous study (e.g. Christmass et al., 1998 found an average of 23.3% (SD = 1.4%) for International players on hard courts). It is logical to associate this high active play value with longer point and game durations although previous studies have found lower relative active times on clay courts (the slowest surface) e.g. Fernández et al. (2005) found an average percentage active time of 18.2% (SD = 5.8%). Consequently it is suggested that whilst court surface has a significant influence on match activity, with a more defensive strategy associated with slower surfaces like clay (Fernández et al., 2006), the results of this study suggest that this is too simplistic a generalization of playing strategy and what may be considered as defensive and attacking strategies requires further classification. In particular the velocity of shots and the availability of time afforded the opponent would seem logical variable to investigate.
Conclusion
This study has provided more detailed information of players’ positioning in the court in respect to shot selection and shot effectiveness and related this to players’ motion during and between games. The inference that shot information was indicative of playing strategy was presented with reference to offensive and defensive zones on the court. However these zones are likely to have been too simplistic to produce a comprehensive and totally accurate picture of a playing strategy. For example the zones could be further split up with perhaps a neutral zone between the offensive and defensive zones. The results found here lead us to believe that there is a need to further refine how defensive and offensive strategy are defined and future investigations that consider movements in relation to shots should consider also individual shots, in particular their velocities, at the rally level and by different individuals to better understand successful performance
Biographies

Rafael Martínez-Gallego
Employment
PhD student
Degree
Master Degree
Research interests
Performance Analysis in racket sports.
E-mail: ramargal@hotmail.com

José F.Guzmán
Employment
Professor at the University of Valencia, Faculty of Sport Sciences and Physical Activity
Degree
PhD
Research interests
Sports Psychology, Performance Analysis.
E-mail: Jose.F.Guzman@uv.es

Nic James
Employment
Head of research for the London Sport Institute at Middlesex University, London.
Degree
Professor
Research interests
Performance Analysis - profiling performance, momentum, performance indicators, reliabilty, automatic tracking of movement.Sports Psychology - situation awareness, anticipation, decision making, motor skillsMain sports studied - soccer, rugby, squash, golf
E-mail: n.james@mdx.ac.uk

Janez Pers
Employment
Assistant Professor at the Faculty of Electrical Engineering, University of Ljubljana, Slovenia.
Degree
PhD
Research interests
Computer vision, pattern recognition, human motion analysis.
E-mail: janez.pers@fe.uni-lj.si

Jesús Ramón-Llin
Employment
Technician at University of Valencia
Degree
Master degree, PhD student
Research interests
Performance Analysis in racket sports.
E-mail: jeramas@hotmail.com

Goran Vuckovic
Employment
Assistant Professor at the University of Ljubljana, Faculty of Sport, Slovenia.
Degree
PhD
Research interests
Performance and Time-Motion Analysis in different sports.
E-mail: goran.vuckovic@fsp.uni-lj.si
References
- Christmass M.A., Richmond S.E., Cable N.T., Arthur P.G., Hartman P.E. (1998) Exercise intensity and metabolic response in singles tennis. Journal of Sports Sciences 16, 739-747 [DOI] [PubMed] [Google Scholar]
- Crespo M., Miley D. (1999) Manual para entrenadores avanzados. International Tennis Federation, London [Google Scholar]
- Fernandez J., Fernandez-Garcia B., Mendez-Villanueva A., Terrados N. (2005) Activity patterns, lactate profiles and ratings of perceived exertion (RPE) during a professional tennis singles tournament. Quality coaching for the future. 14th ITF worldwide coaches’ workshop Crespo M., McInerney P., Miley D.ITF, London [Google Scholar]
- Fernández J., Méndez-Villanueva A., Pluim B.M. (2006) Intensity of tennis match play. British Journal of Sports Medicine 40, 387-391 [DOI] [PMC free article] [PubMed] [Google Scholar]
- Fernández-Fernández J., Sanz-Rivas D., Sánchez-Muñoz C., Pluim B.M., Tiemessen I., Méndez-Villanueva A. (2009) A comparison of the activity profile and physiological demands between advanced and recreational veteran tennis players. Journal of Strength and Conditioning Research 23(2), 604-610 [DOI] [PubMed] [Google Scholar]
- Filipèiè A., Perš J., Klevišar A. (2006) Comparison between young male and female tennis players in terms of time and movement characteristics. In:Proceedings of 4th World Congress of Science and Racket Sports, 2006, Madrid, Spain. 87-90 [Google Scholar]
- Gillet E., Leroy D., Thouvarecq R., Stein J-F. (2009) A notational analysis of elite tennis serve and serve-return strategies on slow surface. Journal of Strength and Conditioning Research 23(2), 532-539 [DOI] [PubMed] [Google Scholar]
- Hizan H., Whipp P., Reid M. (2011) Comparison of serve and serve return statistics of high performance male and female tennis players from different age-groups. International Journal of Performance Analysis in Sport 11(2), 365-375 [Google Scholar]
- Hughes M.D., Barlett R. (2007) What is performance analysis? In: Basics of Performance Analysis. Hughes M.Cardiff: Centre for Performance Analysis, UWIC [Google Scholar]
- Hughes M., Clarke S. (1995) Surface effect on patterns of play of elite tennis players. Science and Racket Sports. Reilly T., Hughes M., Lees A.London: E. and F. N. Spon; 272-278 [Google Scholar]
- Hughes M., Hughes M.T., Behan H. (2007) The evolution of computerised notational analysis through the example of racket sports. International Journal of Sports Science and Engineering 1(1), 3-28 [Google Scholar]
- James N., Bradley C. (2004) Disguising ones intentions: The availability of visual cues and situational probabilities when playing against an international level squash player. Science and Racket Sports III. Lees A., Kahn J.F., Maynard I.W.Abingdon, Oxon: Routledge; 247-252 [Google Scholar]
- James N., Patrick J. (2004) The role of Situation Awareness in sport. A cognitive approach to Situation Awareness: Theory and Application. Banbury S., Tremblay S.Aldershot: Ashgate Publishing Limited; 297-316 [Google Scholar]
- Loffing F., Hagemann N., Strauss B. (2009) The serve in professional men’s tennis: Effects of players’ handedness. International Journal of Performance Analysis in Sport 9(2), 255-274 [Google Scholar]
- Martínez-Gallego R., Ramón-Llin J., Guzmán J.F., Vuckovic G., James N. (2012) Analysis of distance covered and speed of movement in elite tennis players. In:Book of Abstracts of World Congress of Performance Analysis of Sport IX , 2012, Worcester, UK. 188-189 [Google Scholar]
- O’Donoghue P.G. (2006) Elite tennis strategy during tie-breaks. Performance Analysis of Sport 7. Dancs H., Hughes M., O’Donoghue P.G.Cardiff: CPA Press, UWIC 654-660 [Google Scholar]
- O’Donoghue P.G., Ingram B. (2001) A notational analysis of elite tennis strategy. Journal of Sport Sciences 19, 107-115 [DOI] [PubMed] [Google Scholar]
- O’Donoghue P.G., Liddle S.D. (1998) A notational analysis of time factors of elite men’s and ladies’ singles tennis on clay and grass surfaces In: Science and Racket Sports II. Lees A., Maynard I., Hughes M., Reilly T.London: E. and F. N. Spon; 241-246 [Google Scholar]
- Perš J., Bon M., Kovaĉiĉ S., Šibila M., Dežman B. (2002) Observation and analysis of large-scale human motion. Human Movement Science 21, 295-311 [DOI] [PubMed] [Google Scholar]
- Perš J., Kovačič S., Vuckovic G. (2005) Analysis and pattern detection on large amounts of annotated sport motion data using standard SQL. In:Proceedings of the 4th International Symposium on Image and Signal Processing and Analysis. Eds:Lončarić S., Babić H., Bellanger M.339-344 [Google Scholar]
- Smekal G., von Duvillard S. P., Rihacek C., Pokan R., Hofmann P., Baron R., Tschan H., Bachl N. (2001) A physiological profile of tennis match play. Medicine and Science in Sports and Exercise 33, 999-1005 [DOI] [PubMed] [Google Scholar]
- Suda K., Michikami S., Sato Y., Umebayashi K. (2003) Automatic measurement of running distance during tennis matches using computer-based trace analysis. Applied Sport Science for High Performance Tennis. Eds. Crespo M., Reid M., Miley D.London: ITF; 151 [Google Scholar]
- Vuckovic G., Perš J., James N., Hughes M. (2009) Tactical use of the T area in squash by players of differing standard. Journal of Sports Sciences 27, 863-871 [DOI] [PubMed] [Google Scholar]
- Vuckovic G., Perš J., James N., Hughes M. (2010) Measurement error associated with the Sagit/squash computer tracking software. European Journal of Sport Science 10(2), 129-140 [Google Scholar]


