

Abstract
This article describes a prototype system for quantifying bioassays, and for exchanging the results of the assays digitally with physicians located off-site. The system uses paper-based microfluidic devices for running multiple assays simultaneously, camera phones or portable scanners for digitizing the intensity of color associated with each colorimetric assay, and established communications infrastructure for transferring the digital information from the assay site to an off-site laboratory for analysis by a trained medical professional; the diagnosis then can be returned directly to the healthcare provider in the field. The microfluidic devices were fabricated in paper using photolithography, and were functionalized with reagents for colorimetric assays. The results of the assays were quantified by comparing the intensities of the color developed in each assay with those of calibration curves. An example of this system quantified clinically relevant concentrations of glucose and protein in artificial urine. The combination of patterned paper, a portable method for obtaining digital images, and a method for exchanging results of the assays with off-site diagnosticians offers new opportunities for inexpensive monitoring of health, especially in situations that require physicians to travel to patients (e.g., in the developing world, in emergency management, and during field operations by the military) to obtain diagnostic information that might be obtained more effectively by less valuable personnel.
INTRODUCTION
This article describes a system that quantifies assays run in paper-based microfluidic devices, and proposes an information-focused component of the system that exchanges the results of these assays with off-site experts for evaluation (Figure 1). We demonstrate this integrated concept by combining: i) paper-based microfluidic devices based on channels of hydrophilic paper demarcated by walls of hydrophobic polymer (Figure 2) with ii) imaging devices (camera phone or portable scanner) capable of quantifying the colorimetric results of the microfluidic system, and transmitting the digitized readout off-site. We demonstrate this system by detecting clinically-relevant concentrations of glucose and protein in artificial urine.
Figure 1.
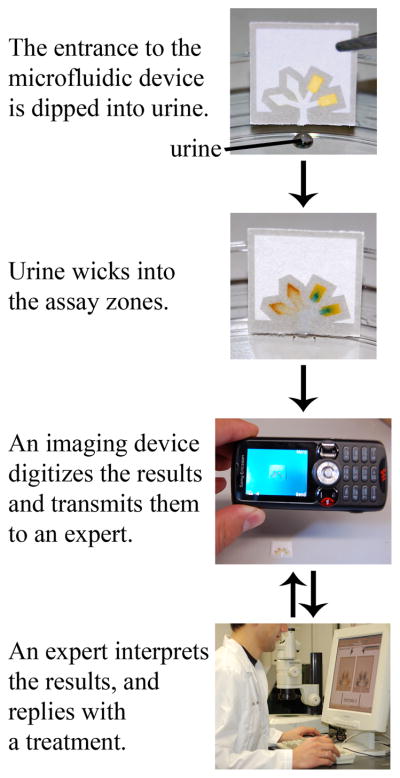
General strategy for performing inexpensive bioassays in remote locations and for exchanging the results of the tests with off-site technicians.
Figure 2.

Design of a prototype paper-based microfluidic device that quantifies two analytes in urine simultaneously. The central channel at the bottom of the device wicks the sample into the four separate test zones; independent assays occur in each zone. The glucose assay occurs in the diamond-shaped test zones, where reagent mobility and evaporation concentrate the reagents in the tip. The protein assay occurs in the rectangular test zones. The blank area above the channels can be used for labeling or for manipulating the device. The hydrophobic lines (pictured in gray) are 1-mm wide, but can be made as small as 250 μm with retention of function. The entire device fits on a 1.5 cm × 1.5 cm piece of chromatography paper. The thick, 2-mm tall hydrophobic line across the bottom of the device blocks the urine from entering the unused, hydrophilic region of the paper. The dashed lines indicate the edges of the paper device.
We believe that the ability to quantify multiple analytes simultaneously using inexpensive paper-based microfluidic devices, coupled with digital transmission of images, makes this combination a useful starting point for a diagnostic system that may have applications in developing countries and other analytically-demanding environments.
Rapid and quantitative methods for detecting markers of disease are necessary for prompt and effective diagnosis and treatment.1 The clinical analyses carried out in developed economies, however, are often not directly applicable in developing economies. This translational problem has two components: i) current analytical systems are too expensive, large, complicated, or dependent on infrastructure to be broadly accessible in developing economies, or practically located in inaccessible regions;2 and ii) developing economies do not have enough trained medical personnel to distribute the analytical systems to inaccessible regions.
Rather than using devices developed for diagnosis in the developed world, a better system for medical analysis for use in developing economies would have two components: i) an analytical platform for relevant assays that is sufficiently simple that it can be used by personnel with limited training in regions that are difficult to access; and ii) a mechanism for exchanging information between the site of the analysis and a central location staffed by experts, with real-time interpretation of the assay—by those experts (i.e., telemedicine).3–5 This latter part of the system should rely on methods of transmitting and receiving information that already exist, and that do not require additional infrastructure. A system for clinical analysis should thus be: (i) inexpensive;6 (ii) operable with little or no requirement for electricity;7 (iii) adaptable to a number of types of assays in a range of conditions; (iv) simple enough to be used by non-technical personnel;2 (v) rapid;2 (vi) accurate;2 and (vii) quantitative.8,9 To achieve all of these characteristics, it may be necessary to compromise standards of sensitivity or specificity.
Quantitative assays are important when a “yes” or “no” answer is insufficient. The concentration of protein in urine, for example, can be used to distinguish between different renal diseases: nephrotic syndrome ([protein] > 35 μM), sub-nephrotic range proteinuria (10 μM < [protein] < 35 μM), tubular proteinuria ([protein] < 10μM), clinical albuminuria ([protein] > 4μM), and microalbuminuria (0.3 μM < [protein] < 3 μM);10–12 a qualitative assay for protein is substantially less useful than a quantitative result in distinguishing these conditions.
There are many portable and quantitative devices for detecting disease.2,13–15 The platforms for these assays range from pressure-driven8,14 or centrifugal force-driven microfluidic devices,16 to “dip-stick” immunochromatographic assays.8,13,15,17,18 The need remains, however, for more effective systems, and especially for systems designed specifically for the conditions in the developing world. Here we describe the basic elements of a system comprising patterned paper and a portable device that acquires images and transmits digital information (e.g., a camera-equipped cellular phone), as one approach to this need.
EXPERIMENTAL DESIGN
Paper-based Diagnostic Devices
Paper is ubiquitous, inexpensive, and easy to store, transport, and manipulate. It is available in a wide range of highly engineered forms,19 it has minimal weight per accessible surface area, and its surface presents organic functional groups that can be manipulated easily.19 Dry paper is wet by aqueous solutions, and wicks biological fluids well; this wicking eliminates the need for external sources of power to pump fluids through a device (so long as distances are kept short (≤ 5 cm)). Paper can filter particulates (solids, gels, cells) from a sample,20 and it can be used as a chromatographic support to separate analytes.21 Paper and derivatives of paper have been—and continue to be—major components of many analytical procedures, most notably in the form of lateral-flow immunochromatographic tests.15,22–31 Filter paper also is used extensively to store samples of blood, saliva, and stool.32–37
Patterned Paper
We and others have shown that paper can be patterned into channels of hydrophilic paper separated by hydrophobic walls of polymer, and that the resulting pattern can be used as a microfluidic device for detecting multiple analytes simultaneously.20,25,26 In these systems, hydrophobic walls in the paper direct a fluid analyte into detection zones, where assays take place. Channels in paper also limit the volume of fluids needed to run an assay. In this work, we used photolithography to pattern the paper, but we anticipate that an appropriate high-volume printing technology ultimately will be the method to make these devices in large numbers and with low cost.
Choice of Biological Fluid
As a demonstration in this work, we used artificial urine as a representative biological fluid.38,39 We focus on urine because it is the most informative physiological fluid that can be obtained non-invasively.15 Urine can be introduced directly into these diagnostic devices without pretreatment to remove cells (as would be necessary with blood) or solids (as would be necessary with stool).15,40 We also chose urine as a fluid because urinalysis is a technique used routinely to diagnose and monitor a variety of medical conditions; current urinalysis tests measure pH, specific gravity, the concentrations of glucose, proteins, nitrites, ketones, urobilinogen, and bilirubin, and quantify the number of red and white blood cells.41,42 The concentrations of these analytes are indicative of kidney disease, infection, and metabolic disorders, among other conditions.43
Choice of Assays
We use glucose and protein as example analytes. The glucose assay is based on the oxidation of glucose to gluconic acid and hydrogen peroxide (catalyzed by glucose oxidase), and the subsequent reduction of hydrogen peroxide and oxidation of iodide to iodine (catalyzed by horseradish peroxidase). The associated change in color from colorless to brown (I− to I2) indicates the presence of glucose.42 The protein assay is based on the non-specific binding of tetrabromophenol blue (TBPB) to proteins. TBPB binds to proteins through a combination of electrostatic (sulfonate) and hydrophobic (biaryl quinone methide) interactions.44,45 When bound, the phenol in TBPB deprotonates, and the color of the dye shifts from yellow to blue.45,46
Colorimetric assays are ideal for simple diagnostic tests: they give visual readouts, they are stable, and the reagents are less expensive than antibodies. In this article, the glucose assay exemplifies an enzymatic assay, and allows us to study the stability of enzymes on paper.
Choice of Detection Method
We captured the results of the colorimetric assays with two types of camera phones, a portable scanner, a desktop scanner, and a digital camera. Camera phones are portable and increasingly affordable, lightweight, and equipped with high resolution digital cameras (≥ 2 megapixels). When used to image a colorimetric, paper-based analysis, the image can be transmitted electronically and digitally to an off-site laboratory, where the data can be analyzed by a specialist, and the results of the analysis returned (ideally in real-time) to the person administering the test. In principle, and provided the essential information can be transmitted accurately, this arrangement eliminates the need for trained medical personnel to travel to remote or hazardous locations, and lowers the cost of the assays without compromising the quality of the diagnosis.
Cell phones (and increasingly camera phones) are owned by ~2.7 billion users across the globe, (the population of the earth is ~6.6 billion people).47 Cell phones have become household items in many parts of Africa, India, China, and South America. In fact, ~6 million new cell phone users are added each month in India.48 Approximately 60 million new users were added across Africa last year, and even isolated, low-income villages at the edge of the Sahara have communal mobile phones for use by nomadic people.49,50 Much of the rapid increase in mobile phone coverage and usage across the globe is driven by the low cost of mobile phones: in low-income regions, phones cost ~$35, and prepaid phone cards cost <$5.50,51 Camera phones have been demonstrated to be useful tools in telemedicine. Two recent studies showed that camera phones could be used to acquire and transmit images of wounds and rashes to off-site locations for diagnosis.3,4 The cellular communications industry is, and will continue to become, a global resource that can be leveraged for detecting disease.
Camera phones have the disadvantage that the intensities of digital images are affected by lighting conditions, and the focus of the image is less reliable than with scanners. Camera phones also have the drawback that many phones contain cameras that, as supplied, cannot focus on objects that are closer than ~20 cm to the camera, and thus cannot be used to provide high-resolution images of small test areas. It is possible, however, to overcome this problem by placing a lens in front of the camera; we demonstrate this concept by reversibly sealing a small lens made from poly(dimethylsiloxane) (PDMS) to the lens of the camera phone. With this PDMS lens we can take pictures of devices that fill the image field and that remain in focus. Newer, but more expensive models of camera phones can focus automatically, and do not require an additional lens. We present results obtained using both types of camera phones.
Scanners are also useful: they are relatively inexpensive (compared to high-end digital cameras), they have high resolution, the scanned image is always in focus, the intensity of the image is not affected by lighting conditions, they are portable (in the form of business card scanners, or pen scanners), and they can be linked to personal digital assistants (PDAs) for wireless communication.
There are several examples of portable detection devices that process data and report results directly, and that do not require transmission of data off-site for processing.14,15,42 In many circumstances the use of these “on-site processors” is appropriate, particularly when the test is performed by a well-trained, informed individual. The objective of this project is to test the opposite: we propose technologies that can be used by unskilled personnel, and that shift the processing and analysis steps from on-site to experts off-site. As part of this proposal, we demonstrate that camera phones can be used as tools for quantifying assays in paper-based microfluidic devices and for transmitting data. Camera phones eliminate the need to process data on-site at the expense of more complicated data transmission.
Camera phones have the advantage that they can be replaced easily (everyone has them) if lost, stolen, or broken, but a special processor is more difficult to replace. Camera phones and portable scanners also have their disadvantages. We expect substantial differences between images captured with different cameras and scanners, and we anticipate that each imaging device will require calibration using standards of known color and intensity. Ultimately, we envisage a software package that collects digital images sent through wireless communications infrastructure, and that automatically calibrates the images (based on calibration data) and quantifies the results of the assays by comparison with standard curves. The role of the off-site physician would be to diagnose disease based on the data and to recommend treatment.
Design of the Platform
Our design for the paper-based microfluidic system consists of a central channel that wicks a sample into the paper, and four side channels that direct the sample into four separate test zones, each containing reagents for assays (Figure 2). We designed narrow channels in paper (1-mm wide) so that the volume of sample required for each assay is small (≤5 μL): this feature has the advantage that it makes the device compatible with fluids from human neonates and small animals, in addition to adult humans. It also makes it possible to analyze tears and gingival crevicular fluid.
Several features of this design make it suitable for use in analytically-difficult environments: the 3-mm long central channel filters particulates from biological samples (contaminants may include dirt or sand),20 and the flared lower section of the channel facilitates absorption of the sample. The features of the device are large enough to be visible by eye, but are small enough to limit the volume of fluid needed to run the assay. We reserved the empty area above the channels for labeling and manipulating the device. The entire device fits on a 1.5 cm × 1.5 cm piece of paper, and is thus small, portable, and lightweight (~35 mg per device).
There also are several features of the design (shown in Figure 2) that are specific to the assays. We noted in previous experiments that the reagents for the glucose assay dissolved in the sample fluid and eluted with the solvent front, while the reagents for the protein assay were not soluble and did not elute.20 We created two types of test zones to accommodate this difference in behavior, and to maximize the ability to quantify the assays. For the glucose assay, we created diamond shapes for the assay region to concentrate the reagents at the ends of the test zones; for the protein assay, we used a rectangular shape to give a defined area and shape for consistent analysis of the data. We could, in principle, perform four different bioassays with this design (or more, by simply incorporating more channels), but for characterizing the analytical performance of the device, we carried out two assays in duplicate on each device.
RESULTS and DISCUSSION
Preparation of the Devices
We used photolithography to pattern Whatman chromatography paper 1 in a cleanroom, as described previously.20 We chose chromatography paper 1 because it is made of pure cellulose, and it wicks fluids well. We wetted the chromatography paper in SU-8 201052,53 (a hydrophobic polymer dissolved in cyclopentanone), and removed the excess resist using a wooden rolling pin. We baked the paper containing photoresist at 95 °C for 10 min to remove the cyclopentanone, and then irradiated it (λ = 405 nm) through a transparency mask (which we make ourselves using an inkjet printer and transparencies) (Figure 3a). A second bake (95 °C for 10 min) cross-linked the exposed portions of the resist; the unexposed resist was removed by soaking the paper in propylene glycol monomethyl ether acetate (PGMEA) and by washing the pattern with propan-2-ol. The patterned paper was allowed to dry in a fume hood at 25 °C. The supporting information gives a more detailed procedure.
Figure 3.

Schematic of the method for fabricating paper-based microfluidic devices. (a) Procedure for patterning paper with hydrophobic photoresist. (b) Derivatization of the device for assays.
This method of fabrication is not ideal for minimizing the cost of paper-based diagnostic devices, but it is convenient for exploratory work, and it allows us quickly to investigate the feasibility of patterned paper as a microfluidic platform. Using these methods, we can design and fabricate devices with new designs within a few hours.
After fabricating the devices, we spotted the reagents for the assays in their respective test zones (Figure 3b). We prepared the glucose assay by spotting into the diamond-shaped test zone 0.2 μL of a solution containing 0.3 M trehalose, 0.6 M potassium iodide and glucose oxidase-horseradish peroxidase (120 units of glucose oxidase enzyme activity54 and 30 purpurogallin units of horseradish peroxidase enzyme activity55 per mL of solution).20 The paper was allowed to dry at 25 °C for 10 min. For the protein assay, we spotted 0.2 μL of a 250-mM citrate buffer solution (pH 1.8) in the rectangular test zone, followed by 10 min of drying, and then 0.2 μL of a 9-mM tetrabromophenol blue (TBPB) solution in ethanol.20 We have stored the pre-spotted devices at 25 °C, covered in aluminum foil, but without excluding air, for 30 days without loss in activity.
Non-Specific Interactions of Analytes with the Device
One concern when using paper-based microfluidic devices is that the analytes may stick to the paper and not distribute equally into the test zones. Before measuring the levels of glucose and protein in urine using the paper-based microfluidic devices, we investigated whether glucose and bovine serum albumin (BSA) (a model protein for human albumin in urine) bind non-specifically to paper, and chromatographically separate from a solution. We found that neither analyte sticks to paper, and that both distribute evenly into the test zones (Figures 4 and S1).
Figure 4.

A 10-μM solution of FITC-BSA dissolved in 40-mM phosphate buffer (pH 7.4) was wicked into the paper-based device and imaged under UV light (254 nm). The FITC-BSA distributes evenly throughout the channels and test zones. a) A device before wicking a solution containing FITC-BSA. b) A device after wicking 1 μL of the FITC-BSA solution. c) A device after wicking 2 μL of the FITC-BSA solution. d) A device after wicking 5 μL of the FITC-BSA solution.
For BSA, we dipped a device, with no reagents spotted in the test zones, into 5 μL of a 10-μM solution of BSA labeled with fluorescein isothiocyante (FITC-BSA), a fluorescent dye. Once the fluid had completely filled the test zones, the device was dried at 25 °C. We imaged the device under UV light (254 nm) and observed an even distribution of FITC-BSA throughout the channels and test zones in the device (Figure 4).
For glucose, 10 μL of a 10-mM solution of glucose in artificial urine was wicked into a straight channel patterned in paper (2-mm wide, 2.8-cm long). After the solution filled the channel, we cut the channel horizontally into two segments of equal length, and measured the concentration of glucose in each segment. The segments were immersed in a 1 mL solution containing 100 μL of the glucose reagent solution (the same solution that we spotted onto paper) and 900 μL of a pH 6.0 phosphate buffer (0.1 mM). We then incubated the paper in the solution for 10 min at 25 °C, and transferred the solution into a cuvette. The absorbance values of the samples were measured at 287 nm using a Hewlett-Packard 8453 spectrophotometer. The absorbance values were equal between the solutions incubated with the top segment and bottom segment of the channel, indicating that glucose is distributed evenly throughout the device (Figure S-1).
Quantitative Measurement of Analytes in Artificial Urine
We prepared solutions with known concentrations of glucose and protein (BSA) in artificial urine.38, 39 We then dipped the bottom of the reagent-loaded device into a drop (5.0 μL) of artificial urine and allowed the analytes to move up the paper by capillary action (Figure 5). The patterned paper absorbed the 5.0 μL sample within 10 min, but another 20 min was required for the color to develop fully. The second photograph in Figure 5 is of a typical device and shows the presence of both glucose (left) and protein (right).
Figure 5.

Procedure for quantifying the levels of glucose and protein in urine using image editing software (we used Adobe®Photoshop®). For the glucose assay, we converted the scanned or photographed digital images to 8-bit grayscale and selected the appropriate test zone of the device. For the protein assay, we converted the image to CMYK color and measured the intensity of cyan. The mean pixel values within the test zones correlate with the concentration of the analyte.
We used four procedures to digitize the results of the assays: i) photography with a camera phone; ii) scanning with a portable scanner; iii) scanning with a desktop scanner; and iv) photography with a digital camera.56 Figure 4 illustrates the procedure for quantifying the digital results. For the glucose assay, we downloaded all the images to a computer, converted each image to 8-bit grayscale in Adobe®Photoshop® (the data could be analyzed either in 8-bit format or in 4-bit with only slightly decreased accuracy, or in color) and used the arithmetic mean of pixel intensity within each test zone to quantify the colorimetric response. Subtraction of this value from that obtained from a device exposed to a sample that did not contain glucose or protein gave a background-corrected response. For the protein assay, we followed a similar procedure, except that we analyzed the image in CMYK color using the cyan channel to quantify the colorimetric response. In this case, the cyan channel provided a larger dynamic range than grayscale, and provided improved precision in the analysis. This procedure for processing the data could be automated using software that already has been developed for similar applications.57 We also obtained indistinguishable results to these when we photographed or scanned a device, and transmitted the digital information to a computer through existing wireless communication systems.
Quantitative Assays with Samples of Known Volume
The signal for the glucose and protein assays correlate with concentration of analyte (Figure 6). The data and error bars in this figure are the mean and relative standard deviation, respectively, from twelve independent measurements taken using six devices per concentration of analyte. Analysis of the results for both the glucose and protein assays from six devices showed that duplicate test zones on each device were not statistically different from one another at the confidence level of 0.05 (data not shown). Linear least-squares fitting of the glucose data and quadratic least-squares fitting of the protein data gave coefficients of determination (R2) of 0.98–0.99. The responses are linear between 0- and 5-mM glucose, but deviate from linearity by leveling off at higher concentrations of analytes. It may be possible to detect other concentrations of glucose and protein quantitatively by changing the concentrations of reagents, or by diluting the sample.
Figure 6.

Analytical calibration plots for different concentrations of glucose and protein in artificial urine. The mean intensity for each data point was obtained from the histogram in Adobe®Photoshop®, as described in Figure 4. We measured concentrations of glucose between 0 and 20 mM. The protein assay was run using concentrations of BSA between 0 and 60 μM. The graphs contain data obtained using a desktop scanner (■), a portable scanner (□), a digital camera (●), and a camera phone with automatic focus (○); the inset shows the linear region of the data in greater detail. Each datum is the mean of twelve assays; error bars represent the relative standard deviations of these measurements. For the glucose assay, the linear region of the data was fit with a line (shown in the inset); the slope (m), intercept (b), and R2 value for each line are as follows: desktop scanner (m = 16.6, b = −1.54, R2 = 0.991), portable scanner (m = 18.0, b = 2.95, R2 = 0.986), digital camera (m = 8.96, b = −2.12, R2 = 0.983), and camera phone (m = 6.17, b = 0.186, R2 = 0.986). The protein data was fit with a quadratic equation; the quadratic coefficient (a), the linear coefficient (b), the constant coefficient (c), and the R2 value for each curve are as follows: desktop scanner (a = −0.015, b = 2.15, c = 0.955, R2 = 0.996), portable scanner (a = −0.017, b = 2.20, c = 1.36, R2 = 0.998), digital camera (a = −0.012, b = 1.62, c = 3.81, R2 = 0.987), and camera phone (a = −0.012, b = 1.29, c = 3.36, R2 = 0.986).
The linear range for detecting glucose is 0–5 mM, with a limit of detection of 0.5-mM glucose; this range does not span the entire range of concentrations of glucose detected in urine clinically (0–550 mM).58 Levels of glucose in urine above 1.4 mM are indicative of disease, so it may be unnecessary to quantitatively detect concentrations below this value.58
The range for detecting protein is appropriate for clinical use, and is accurate down to 4-μM protein: this assay is sufficiently sensitive to distinguish between nephrotic syndrome, sub-nephrotic range proteinuria, tubular proteinuria, clinical albuminuria, and microalbuminuria, though it can detect microalbuminuria only qualitatively; microalbuminuria is a possible diagnosis when levels of proteins in urine are between 0.3–3 μM.12 We did not test protein concentrations above 60 μM since this is well above the clinical range.
The intensity of the signal was consistently smaller for the digital camera and camera phone compared to the scanners with our particular lighting conditions (Figure 6), but the results suggest that camera phones are nearly as effective as scanners for acquiring quantitative data. This last point becomes more apparent when we use the calibration curves to quantify the levels of BSA and glucose in test samples of artificial urine; we were able to accurately measure 2.5, 3.5, and 4.5 mM glucose and 25, 35, and 45 μM BSA (Table 1).
Table 1.
Quantitative detection of 5-μL samples containing glucose (2.5, 3.5, and 4.5 mM) and protein (25, 35, and 45 μM). The values are the average and one standard deviation of twelve experiments.
| [Glucose], mM
|
[BSA], μM
|
|||||
|---|---|---|---|---|---|---|
| Known Concentration | Known Concentration | |||||
| 2.5 | 3.5 | 4.5 | 25 | 35 | 45 | |
|
|
|
|
||||
| Detection Method | Observed Concentration | Observed Concentration | ||||
| Camera Phone (with auto focus) | 2.3 ± 0.5 | 3.9 ± 0.7 | 4.5 ± 0.7 | 24 ± 7 | 33 ± 8 | 42 ± 7 |
| Camera Phone (with PDMS lens)a,b | 2.6 ± 0.6 | 3.2 ± 0.7 | 4.8 ± 0.5 | 26 ± 6 | 34 ± 8 | 45 ± 7 |
| Portable Scanner | 2.6 ± 0.5 | 3.4 ± 0.6 | 4.7 ± 0.4 | 24 ± 6 | 35 ± 6 | 44 ± 5 |
| Portable Scanner (unknown volume) | 2.3 ± 0.6 | 3.8 ± 0.7 | 4.6 ± 0.7 | 27 ± 7 | 34 ± 4 | 43 ± 7 |
| Desktop Scanner | 2.5 ± 0.4 | 3.5 ± 0.6 | 4.3 ± 0.4 | 25 ± 3 | 36 ± 6 | 45 ± 6 |
| Digital Camera | 2.4 ± 0.4 | 3.8 ± 0.5 | 4.5 ± 0.8 | 24 ± 6 | 35 ± 6 | 48 ± 8 |
We used the calibration curve for the camera phone with automatic focus to quantify these results.
Experimental details on the fabrication and use of the PDMS lens are given in the supporting information.
The data from the digital camera and camera phones are dependent on lighting conditions, so we calibrate each set of data by running a sample of artificial urine of known concentration; the intensity of signal for this sample, compared with the value expected from the curve shown in Figure 6, gives a response factor that we use to adjust the experimental data to fit the calibration curve. In a real-life scenario it would be necessary to run a standard sample so that the results of the assay could be calibrated appropriately. An alternative approach would be to include a reference color strip in the image of the device, and use the intensities of the colors on the strip as a reference.
Quantitative Assays with Samples of Unknown Volume
Using the current procedure, one must control the volume of sample that is analyzed in order to make a quantitative measurement. In a remote location, a micro-pipette capable of dispensing 5 μL of sample may not be available. Since the combined surface area of the channels and test zones on these devices is constant, we hypothesized that we could detect analytes quantitatively by dipping the device into an unknown volume of sample, and by removing the device once the fluid wicked completely from the entrance of the device to the ends of the diamond- and rectangular-shaped test zones; in the absence of evaporation the device absorbs a fixed volume of fluid (~5 μL). The device thus simultaneously runs assays and measures the volume of a sample; this latter attribute is especially useful when the sample contains suspended solids, particles, or cells that might complicate measurement of exact volumes using micro-pipettes.
We first tested the accuracy of the device for wicking reproducible volumes of fluid by dipping devices into 10 μL of water and by removing the devices from the water as soon as the fluid filled the test zones. We measured the volume of water remaining in the original 10 μL drop using a micropipette, and then calculated the amount of water that had been wicked into the device. We found that the devices wick on average 4.8 ± 0.3 μL of water (based on 10 replicates).
We tested the accuracy of this method for measuring the concentration of glucose and protein in samples of unknown volume by running assays and quantifying the concentrations of glucose and protein in three samples using the portable scanner (Table 1, line 4). The error in the measurements using this method are slightly larger than those obtained using fixed volumes of sample, but the levels of analytes still can be detected quantitatively.
Simultaneous Detection and Purification of Samples
The ability to separate impurities from fluids is important for use in the field, where samples may be contaminated by dust or other debris. This paper-based device filters solid contaminants from samples—even when the contaminants are present at high fractions of the volume—with minor effects on the quantitative results (Figure 7 and Table 2).
Figure 7.
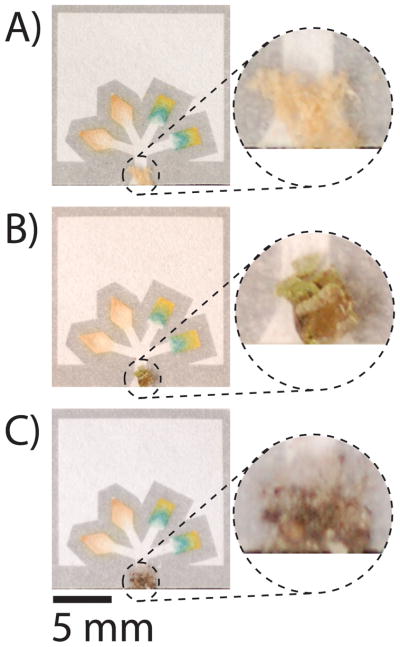
Devices run with 5 μL of contaminated samples of glucose and protein (4.5 mM glucose and 50 μM BSA). The solid contaminants (A) sawdust, (B) plant, and (C) dirt are filtered from the samples and do not interfere with the assays, except in the case of the protein assay that is contaminated by the plant.
Table 2.
Quantitative results for assays using contaminated solutions of glucose (4.5 mM) and BSA (45 μM). The devices were scanned using the desktop scanner, and the concentrations were calculated using the calibration curves for the desktop scanner. Each sample was measured 12 times; the error reflects one standard deviation from mean values measured for all 12 replicates.
| Contaminant | Glucose
|
BSA
|
|---|---|---|
| Observed Conc. (mM) | Observed Conc. (μM) | |
| Dirt | 4.4 ± 0.4 | 46 ± 8 |
| Sawdust | 4.4 ± 0.3 | 43 ± 6 |
| Pollen | 4.5 ± 0.6 | 86 ± 4a |
We independently measured 34 ± 10 μM protein in a 0 μM BSA sample contaminated with pollen.
Table 2 shows results summarizing the analysis of artificial urine (containing 4.5 mM glucose and 45 μM BSA) that we contaminated intentionally with dirt, sawdust, or pollen. Each sample was measured twelve times using the desktop scanner, and the digital signals were converted to concentrations using the calibration line shown in Figure 6. In each case, the contaminants had little effect on the concentrations of glucose (error ≤ 6%), and only the pollen affected the concentration of protein by increasing the quantity detected in the sample. It is probable that protein from the pollen dissolved in the sample and raised the total concentration of protein (we detected ~34 μM protein in an artificial urine sample that did not contain protein, but was exposed to pollen).59
Shelf-life of the Devices
In initial experiments we did not include trehalose in the reagent mixture for the glucose assay, and we observed that the performance of the glucose assay decayed with time when the devices were stored at room temperature; the protein assay, on the other hand, showed no dependence on storage. An analytical device that would be useful in developing regions must remain stable at least several weeks and preferably for several months. To circumvent this problem, we increased the stability of the reagents for the glucose assay by adding trehalose, a disaccharide that stabilizes proteins in their active form,60–63 to the reagent mixture. When trehalose was added to the reagent mixture, we observed no loss in enzymatic activity over a period of 30 days (even when the devices were stored at room temperature) (Figure 8). Without trehalose, the signal for the glucose assay decreased linearly over time (τ1/2 = 11 days for 5 mM glucose).
Figure 8.

Stability of the glucose assays over time. In the presence of trehalose, the intensity of signal for the glucose assay (when detecting 5-mM glucose in artificial urine) was constant for 30 days when the devices were stored at room temperature; after 30 days the signal decayed at a rate of 0.6 intensity units per day. When devices were stored without trehalose, the signal immediately decreased linearly over time. The protein assay can be stored at room temperature for over two months without significant loss of signal (data not shown). The values on the graph are the average of six measurements, and the error bars represent the confidence level for the true mean at a 95% confidence level using a t-distribution. The mean intensity for each datum was obtained from the histogram in Adobe®Photoshop®, as described in Figure 4.
CONCLUSIONS
The combination of paper-based microfluidic devices and a portable detector (e.g., camera phone), capable of transmitting digital information over existing communications channels, provides an integrated approach for detecting and diagnosing disease in locations that are difficult or impractical to access by trained physicians or paramedics. Many of these locations exist in the developing world, where disease is prevalent, but where resources—notably monetary resources and trained personnel—are absent or limiting. In the developing world cost, portability, weight, bulk, ruggedness, adaptability, and ease of use are as important as (or more important than) the historically honored analytical parameters of sensitivity and reproducibility.
Current technologies for detecting disease in the developed world—even the simple ones, such as dipsticks or lateral flow assays—either are too expensive for widespread use in developing economies, or are not designed for the analytical needs and demanding environments found in these locations. These environments require efficient methods for (i) collecting a sample (including microliter volumes of samples), (ii) detecting multiple analytes in a sample rapidly, and (iii) quantifying the results of the assays. The system we describe was designed to address these analytical needs by combining an inexpensive and easy-to-use diagnostic platform (patterned paper) with a mechanism for quantifying assays and communicating the results of the assays with trained physicians (camera phone). By using this simple form of telemedicine, experts located remotely from the site where the test is performed can interpret the results of the assays and diagnose disease (in real time), without traveling to remote and potentially dangerous locations.
This system gives accurate and quantitative results when detecting glucose and protein in urine, uses small volumes of sample (≤5 μL), and does not require precise volumes of a sample for quantitative analysis. These results demonstrate that this system is sufficiently quantitative in test cases that it can be considered for evaluation in a medically relevant context.
The system presented in this paper is not limited to detecting disease in humans; when fitted with appropriate assay chemistry, it will also be useful for detecting disease in plants and livestock, as in testing the quality of food and water. Health, nutrition and water are all vitally important in the developing world, and require new, simple, and inexpensive analytical approaches that are designed specifically for the constraints of specific regions and problems. The military, first responders, and homeland security personnel also could benefit from this type of system.
Acknowledgments
This work was supported by the N/MEMS S&T Fundamentals MF3 Center (DARPA), the National Institutes of Health (NIH EHS grant R01 ES016665), Harvard University’s Center for Nanoscale Science, a pre-doctoral fellowship from NSF (A.W.M.), a post-doctoral fellowship from the Damon Runyon Cancer Research Foundation (DRG-1805-04) (S.T.P) and NIH (S.T.P.), a visiting scholar fellowship from the Fundação de Amparo à Pesquisa do Estado de São Paulo–FAPESP (E.C.), and a post-doctoral fellowship from the American Cancer Society (S.W.T.).
References
- 1.Daar AS, Thorsteinsdóttir H, Martin DK, Smith AC, Nast S, Singer PA. Nat Genet. 2002;32:229–232. doi: 10.1038/ng1002-229. [DOI] [PubMed] [Google Scholar]
- 2.Mabey D, Peeling RW, Ustianowski A, Perkins MD. Nat Rev Microbiol. 2004;2:231–240. doi: 10.1038/nrmicro841. [DOI] [PubMed] [Google Scholar]
- 3.Braun RP, Vecchietti JL, Thomas L, Prins C, French LE, Gewirtzman AJ, Saurat JH, Salomon D. Arch Dermatol. 2005;141:254–258. doi: 10.1001/archderm.141.2.254. [DOI] [PubMed] [Google Scholar]
- 4.Dziadzio M, Hamdulay S, Reddy V, Boyce S, Keat A, Andrews J. Clin Rheumatol. 2007;26:979–980. doi: 10.1007/s10067-006-0221-6. [DOI] [PubMed] [Google Scholar]
- 5.Kaplan WA. Global Health. 2006;2:9. doi: 10.1186/1744-8603-2-9. [DOI] [PMC free article] [PubMed] [Google Scholar]
- 6.United Nations. [11/5/2007];Human Development Report. 2005 http://hdr.undp.org/reports/global/2005/
- 7.Willis RC. Anal Chem. 2006;78:5261–5265. doi: 10.1021/ac069435g. [DOI] [PubMed] [Google Scholar]
- 8.Yager P, Edwards T, Fu E, Helton K, Nelson K, Tam MR, Weigl BH. Nature. 2006;442:412–418. doi: 10.1038/nature05064. [DOI] [PubMed] [Google Scholar]
- 9.Hayden T. Anal Chem. 2006;78:5252–5260. doi: 10.1021/ac069431b. [DOI] [PubMed] [Google Scholar]
- 10.Mogensen CE. N Engl J Med. 1984;310:356–360. doi: 10.1056/NEJM198402093100605. [DOI] [PubMed] [Google Scholar]
- 11.Goroll AH, Mulley AG. Primary Care Medicine: Office Evaluation and Management of the Adult. 5. Lippincott Williams & Wilkins; Philadelphia: 2006. [Google Scholar]
- 12.Marshall WJ, Bangert SK. Clinical Biochemistry: Metabolic and Clinical Aspects. 1. Churchill Livingstone; Edinburgh; New York: 1995. [Google Scholar]
- 13.von Lode P. Clin Biochem. 2005;38:591–606. doi: 10.1016/j.clinbiochem.2005.03.008. [DOI] [PubMed] [Google Scholar]
- 14.Sia SK, Linder V, Parviz BA, Siegel A, Whitesides GM. Angew Chem Int Ed Engl. 2004;43:498–502. doi: 10.1002/anie.200353016. [DOI] [PubMed] [Google Scholar]
- 15.Chin CD, Linder V, Sia SK. Lab Chip. 2007;7:41–57. doi: 10.1039/b611455e. [DOI] [PubMed] [Google Scholar]
- 16.Honda N, Lindberg U, Andersson P, Hoffmann S, Takei H. Clin Chem. 2005;51:1955–1961. doi: 10.1373/clinchem.2005.053348. [DOI] [PubMed] [Google Scholar]
- 17.Lönnberg M, Carlsson J. Anal Biochem. 2001;293:224–231. doi: 10.1006/abio.2001.5130. [DOI] [PubMed] [Google Scholar]
- 18.Moody A. Clin Microbiol Rev. 2002;15:66–78. doi: 10.1128/CMR.15.1.66-78.2002. [DOI] [PMC free article] [PubMed] [Google Scholar]
- 19.Macek K, Bečvářová H. Chromatogr Rev. 1971;15:1–28. [Google Scholar]
- 20.Martinez AW, Phillips ST, Butte MJ, Whitesides GM. Angew Chem Int Ed Engl. 2007;46:1318–1320. doi: 10.1002/anie.200603817. [DOI] [PMC free article] [PubMed] [Google Scholar]
- 21.Metcalf EC, Morgan MRA, Dean PDG. J Chromatogr. 1982;235:501–506. [Google Scholar]
- 22.Oberhofer TR, Towle DW. J Clin Microbiol. 1982;15:196–199. doi: 10.1128/jcm.15.2.196-199.1982. [DOI] [PMC free article] [PubMed] [Google Scholar]
- 23.Zocher F, Enzelberger MM, Bornscheuer UT, Hauer B, Schmid RD. Anal Chim Acta. 1999;391:345–351. [Google Scholar]
- 24.Wong TS, Schwaneberg U, Sturmer R, Hauer B, Breuer M. Comb Chem High Throughput Screen. 2006;9:289–293. doi: 10.2174/138620706776843228. [DOI] [PubMed] [Google Scholar]
- 25.Allen MP ChemTrack Inc. US Patent 5,409,664. 1995
- 26.Hardman JD, Slater JH, Reid AG, Lang WK, Jackson JR Diamatrix Ltd. US Patent 6,573,108. 2003
- 27.Gussenhoven GC, van der Hoorn MA, Goris MG, Terpstra WJ, Hartskeerl RA, Mol BW, van Ingen CW, Smits HL. J Clin Microbiol. 1997;35:92–97. doi: 10.1128/jcm.35.1.92-97.1997. [DOI] [PMC free article] [PubMed] [Google Scholar]
- 28.Wang XY, Ansaruzzaman M, Vaz R, Mondlane C, Lucas ME, von Seidlein L, Deen JL, Ampuero S, Puri M, Park T, Nair GB, Clemens JD, Chaignat CL, Rajerison M, Nato F, Fournier JM. BMC Infect Dis. 2006;6:17. doi: 10.1186/1471-2334-6-17. [DOI] [PMC free article] [PubMed] [Google Scholar]
- 29.Deborggraeve S, Claes F, Laurent T, Mertens P, Leclipteux T, Dujardin JC, Herdewijn P, Buscher P. J Clin Microbiol. 2006;44:2884–2889. doi: 10.1128/JCM.02594-05. [DOI] [PMC free article] [PubMed] [Google Scholar]
- 30.Chembio Diagnostic Systems, Inc. [11/5/2007];HIV 1/2 stat-pak dipstick assay product instert. http://www.chembio.com/humantest3.html.
- 31.Liu J, Mazumdar D, Lu Y. Angew Chem Int Ed Engl. 2006;45:7955–7959. doi: 10.1002/anie.200603106. [DOI] [PubMed] [Google Scholar]
- 32.Zlateva KT, Maes P, Rahman M, Van Ranst M. Virol J. 2005;2:6. doi: 10.1186/1743-422X-2-6. [DOI] [PMC free article] [PubMed] [Google Scholar]
- 33.Mwaba P, Cassol S, Pilon R, Chintu C, Janes M, Nunn A, Zumla A. Lancet. 2003;362:1459–1460. doi: 10.1016/S0140-6736(03)14693-4. [DOI] [PubMed] [Google Scholar]
- 34.Bourdoux PP, Van Thi HV, Courtois PA, Ermans AM. Clin Chim Acta. 1991;195:97–105. doi: 10.1016/0009-8981(91)90129-z. [DOI] [PubMed] [Google Scholar]
- 35.Collins J, Puskas S. [11/5/2007];MEDTOX Laboratories. 2003 http://www.medtox.com/PDF/MEDTOX/Company/Investors/AACCLeadPoster0703.pdf.
- 36.Civallero G, Michelin K, de Mari J, Viapiana M, Burin M, Coelho JC, Giugliani R. Clin Chim Acta. 2006;372:98–102. doi: 10.1016/j.cca.2006.03.029. [DOI] [PubMed] [Google Scholar]
- 37.Chamoles NA, Blanco MB, Gaggioli D, Casentini C. Clin Chem. 2001;47:2098–2102. [PubMed] [Google Scholar]
- 38.The artificial urine solution contained 1.1 mM lactic acid, 2.0 mM citric acid, 25 mM sodium bicarbonate, 170 mM urea, 2.5 mM calcium chloride, 90 mM sodium chloride, 2.0 mM magnesium sulfate, 10 mM sodium sulfate, 7.0 mM potassium dihydrogen phosphate, 7.0 mM dipotassium hydrogen phosphate, and 25 mM ammonium chloride all mixed in Millipore-purified water. The pH of the solution was adjusted to 6.0 by addition of 1.0 M hydrochloric acid.
- 39.Brooks T, Keevil CW. Lett Appl Microbiol. 1997;24:203–206. doi: 10.1046/j.1472-765x.1997.00378.x. [DOI] [PubMed] [Google Scholar]
- 40.Other fluids that should be compatible with the paper-based platform include tears, saliva, and sweat, and (less conveniently) vaginal fluids, wound exudates, nasal mucus, feces, plasma, blood, spinal fluid, amniotic fluid, nipple aspirate, and diarrhea fluid.
- 41.Craig Medical. [11/5/2007];URS-10 Professional urinalysis test strip product insert. http://www.craigmedical.com/urine_diagnostics.htm.
- 42.Peele JD, Jr, Gadsden RH, Crews R. Clin Chem. 1977;23:2242–2246. [PubMed] [Google Scholar]
- 43.Cypress Diagnostics. [11/5/2007];Urine-9 product insert. http://www.diagnostics.be/frame_cl_uri.html.
- 44.Steinhardt J, Krijn J, Leidy JG. Biochemistry. 1971;10:4005–4015. doi: 10.1021/bi00798a001. [DOI] [PubMed] [Google Scholar]
- 45.Cao W, Jiao Q, Fu Y, Chen L, Liu Q. Spectroscopy Letters. 2003;36:197–209. [Google Scholar]
- 46.Pugia MJ, Lott JA, Profitt JA, Cast TK. J Clin Lab Anal. 1999;13:180–187. doi: 10.1002/(SICI)1098-2825(1999)13:4<180::AID-JCLA7>3.0.CO;2-R. [DOI] [PMC free article] [PubMed] [Google Scholar]
- 47.International Telecommunication Union. [11/5/07];Market Information and Statistics. 2006 http://www.itu.int/ITU-D/ict/statistics/at_glance/KeyTelecom99.html.
- 48.Gupta SSK. Telecom Regulatory Authority of India. 2007. Press Release No. 22/2007. [Google Scholar]
- 49.International Telecommunication Union. [11/5/2007];Market Information and Statistics. 2006 http://www.itu.int/ITU-D/ict/statistics/ict/graphs/mobile.jpg.
- 50.Bryan-Low C. Wall Street Journal. New York: Feb 13, 2007. p. B5. [Google Scholar]
- 51.Yee A. Financial Times, Special Report: India & Globalization. London: 2007. p. 6. [Google Scholar]
- 52.Hurditch RJ, Nawrocki DJ, Johnson DW. US Patent 6,391,523 B1. 2002
- 53.Shaw JM, Gelorme JD, LaBianca NC, Conley WE, Holmes SJ. IBM J RES DEVELP. 1997;41:81–94. [Google Scholar]
- 54.One unit will oxidize 1.0 μmole of β-D-glucose to D-gluconolactone and H2O2 per minute at pH 5.1 and 35 °C.
- 55.One purpurogallin unit will form 1.0 mg of purpurogallin from pyrogallol in 20 s at pH 6.0 and 20 °C.
- 56.Other laboratories have used similar “scanometric” detection methods for quantifying bioassays run on other platforms.
- 57.Gaiao EN, Martins VL, Lyra WS, de Almeida LF, da Sliva EC, Araujo MCU. Anal Chim Acta. 2006:283–290. doi: 10.1016/j.aca.2006.04.048. [DOI] [PubMed] [Google Scholar]
- 58.Davidson JK. Clinical Diabetes Mellitus: A Problem-oriented Approach. 3. Thieme; New York: 2000. [Google Scholar]
- 59.We repeated the experiment for pollen using a sample of artificial urine with no BSA, and we measured 34 ± 10 μM of protein. This result suggests that some of the protein from the pollen dissolved into the sample of artificial urine and resulted in the elevated measurement.
- 60.Sarkar J, Sreenivasa BP, Singh RP, Dhar P, Bandyopadhyay SK. Vaccine. 2003;21:4728–4735. doi: 10.1016/s0264-410x(03)00512-7. [DOI] [PubMed] [Google Scholar]
- 61.Crowe JH, Carpenter JF, Crowe LM. Annu Rev Physiol. 1998;60:73–103. doi: 10.1146/annurev.physiol.60.1.73. [DOI] [PubMed] [Google Scholar]
- 62.Albertorio F, Chapa VA, Chen X, Diaz AJ, Cremer PS. J Am Chem Soc. 2007;129:10567–10574. doi: 10.1021/ja0731266. [DOI] [PMC free article] [PubMed] [Google Scholar]
- 63.Souillac PO, Costantino HR, Middaugh CR, Rytting JH. J Pharm Sci. 2002;91:206–216. doi: 10.1002/jps.10023. [DOI] [PubMed] [Google Scholar]