

Abstract
Phytochemicals have been known to exhibit potent antioxidant activity. This study examined cytoprotective effects of phytochemicals including quercetin, catechin, caffeic acid, and phytic acid against oxidative damage in SK-Hep-1 cells induced by the oxidative and non-oxidative metabolism of ethanol. Exposure of the cells to excess ethanol resulted in a significant increase in cytotoxicity, reactive oxygen species (ROS) production, lipid hydroperoxide (LPO), and antioxidant enzyme activity. Excess ethanol also caused a reduction in mitochondrial membrane potential (MMP) and the quantity of reduced glutathione (GSH). Co-treatment of cells with ethanol and quercetin, catechin, caffeic acid and phytic acid significantly inhibited oxidative ethanol metabolism-induced cytotoxicity by blocking ROS production. When the cells were treated with ethanol after pretreatment of 4-methylpyrazole (4-MP), increased cytotoxicity, ROS production, antioxidant enzyme activity, and loss of MMP were observed. The addition of quercetin, catechin, caffeic acid and phytic acid to these cells showed suppression of non-oxidative ethanol metabolism-induced cytotoxicity, similar to oxidative ethanol metabolism. These results suggest that quercetin, catechin, caffeic acid and phytic acid have protective effects against ethanol metabolism-induced oxidative insult in SK-Hep-1 cells by blocking ROS production and elevating antioxidant potentials.
Keywords: Phytochemical, Antioxidant, ROS, Oxidative stress
INTRODUCTION
The liver is the primary site for ethanol metabolism (Lieber, 1997). Ethanol is metabolized by oxidative and non-oxidative pathways in the liver (Best et al., 2006). Alcohol dehydrogenase (ADH) with cytochrome P450 2E1 (CYP2E1) and catalase (CAT) is responsible for the oxidative metabolism of ethanol, and fatty acid ethyl esters (FAEE) synthase produces FAEE via non-oxidative metabolism (Wu et al., 2006). Treatment of 4-methylpyrazole (4-MP), which is an ADH inhibitor, has been known to cause the non-oxidative metabolism of ethanol with elevation of plasma FAEE level (Best et al., 2006) and 30-40% decrease in ethanol elimination rate by oxidative metabolism (Sarkola et al., 2002). Chronic and acute ethanol exposure are reported to generate excessive reactive oxygen species (ROS), including superoxide anion (O2-), hydroxyl radical ( · OH), and hydrogen peroxide (H2O2). Ethanol exposure also leads to oxidative stress, which results in decreased Abstractglutathione (GSH) levels and enhanced peroxidation of lipids, proteins and DNA (Lu and Cederbaum, 2008; Kahraman et al., 2012). In addition, there is growing evidence that intracellular ROS resulting from ethanol metabolism play an important role in ethanol-induced liver injury (Nordmann et al., 1992; Calabrese et al., 1996).
Phytochemicals are naturally occurring secondary metabolites that have antioxidant properties and are present in fruits and vegetables (Matés et al., 2011). They have been reported to prevent various diseases associated with oxidative stress, such as cancer, cardiovascular diseases and neurodegenerative diseases (Russo et al., 2012). Quercetin and catechin are known to have high free radical scavenging activity (Ross and Kasum, 2002), and they exhibit in vivo and in vitro hepatoprotective effects from ethanol-induced oxidative stress (Molina et al., 2003; Liu et al., 2010; Oliva et al., 2011) (Fig. 1). Caffeic acid is an antioxidant that is widely distributed in vegetables, fruits, coffee and tea (Rampart et al., 1986) and is known to
Fig. 1. Chemical structures of phytochemicals used in this study: quercetin, catechin, caffeic acid, and phytic acid.
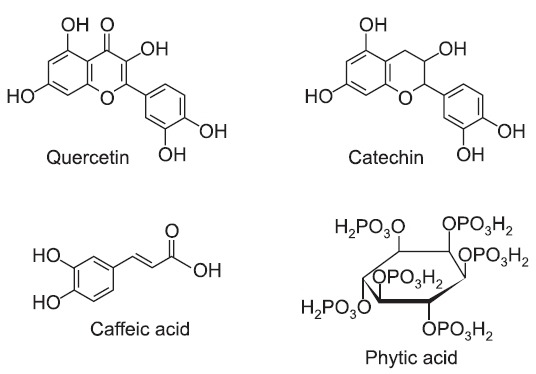
protect human blood lymphocytes from UV-induced oxidative insult (Prasad et al., 2009) (Fig. 1). Phytic acid is present in cereals, nuts, oilseeds, and legumes. It is considered to be an antioxidant due to its ability to suppress hydroxyl radical production (Reddy et al., 1996; Vucenik and Shamsuddin, 2006), and it has been shown to be chemopreventive agent against various cancers (Vucenik et al., 1992; Shamsuddin et al., 1997) (Fig. 1).
The aim of this study is to examine the cytoprotective effect of phytochemicals against ethanol-induced oxidative stress in the SK-Hep-1 cells (hepatic carcinoma cell line from human origin). This study demonstrates that phytochemicals with antioxidant activity in vitro have the ability to protect cells against oxidative insult by modulating ROS generation, glutathione concentration, lipid hydroperoxide production, and antioxidant enzyme activity in SK-Hep-1.
MATERIALS AND METHODS
Reagents
Quercetin (Qu), catechin (Ct), caffeic acid (Cf), phytic acid (Py), ethanol, 4-methylpyrazole (4-MP), 3-(4,5-dimethylthiazol-2-yl)-2,5-diphenyltetrazolium bromide (MTT), 5,5'-dithiobis-(2-nitrobenzoic acid) (DTNB), dinitrophenyl hydrazine (DNPH), and dithiothreitol (DTT) were obtained from Sigma (Sigma-Aldrich, MO, USA). 2',7'-dichlorofluorescein diacetate (DCF-DA) and rhodamine 123 (Rh-123) were purchased from Molecular Probes (Eugene, OR, USA). The cell culture medium and reagents, including Eagle's minimal essential medium (DMEM), fetal bovine serum (FBS), penicillin/streptomycin, and trypsin-EDTA were obtained from Gibco (Invitrogen, NY, USA).
Cell culture and treatment
SK-Hep-1 cells were cultured in DMEM supplemented with 10% heat-inactivated FBS, 100 U/ml penicillin, and 100 mg/ml streptomycin at 37℃, 5% CO2. In the oxidative ethanol metabolism experiments, after reaching 70-80% confluence, the cells were starved with serum-free DMEM for 12 h. Then, the cells were simultaneously treated with 5 μM of individual phytochemicals (5 mM stocks dissolved in dimethyl sulfoxide) and 100 mM ethanol for 72 h. In non-oxidative ethanol metabolism experiments, serum-starved cells were pretreated with 2 mM 4-methylpyrazole (4-MP) for 2 h. Then, the cells were simultaneously treated with 5 μM of individual phytochemicals and 100 mM ethanol for 24 h. An adherent sealing membrane was overlaid onto each plate to minimize ethanol evaporation (Rampart et al., 1986).
Cell proliferation
The MTT assay was performed to measure the cell proliferation of cultured cells (Kang et al., 1996). Briefly, SK-Hep-1 cells were plated on 96-well culture plates at 1×10³ cells in DMEM supplemented with 10% FBS. After incubation for 72 h, MTT was added at a final concentration of 0.5 mg/ml per well for the remaining 6 h of incubation time. The cell pellets were dissolved by adding 0.17 M acidified isopropyl alcohol and 3% sodium dodecyl sulfate (SDS). The absorbance was measured at a wavelength of 590 nm using a plate reader (SpectraMax 190, Molecular Devices, Inc., CA, USA).
Evaluation of cytotoxicity by a lactate dehydrogenase leakage assay
SK-Hep-1 cells were seeded at 3.0×10⁴ cells/well in 6-well plates. Briefly, culture medium was collected separately, and the cells were scraped. Cell suspensions were sonicated to ensure breakdown of the cell membrane to release the lactate dehydrogenase (LDH). After centrifugation to clear the cell lysate, a mixture of 5 mM pyruvate, 0.35 mM NADH, and 84 mM Tris was added to the cell lysate and the culture media. Immediately, the absorbance was read at 340 nm for 3 min in a microplate reader (BioTek, VT, USA). LDH leakage was estimated from the ratio of the LDH activity in the culture medium to that of the whole cell content (Granado-Serrano et al., 2006).
Determination of reactive oxygen species
The formation of intracellular ROS was evaluated using a DCF-DA probe (Wang and Joseph, 1999). Briefly, SK-Hep-1 cells were plated at 3.0×10³ cells/well in 24-well plates. The cells were washed with PBS, and the media were replaced with 5 μM DCF-DA in DMEM. The cells were incubated at 37℃ for 30 min and then washed three times with PBS. The fluorescence of the cells from each well was measured using 485 nm excitation and 535 nm emission with a Wallac Victor 1420 Multilabel Counter (Perkin Elmer, Inc., CA, USA).
Determination of lipid hydroperoxide
Lipid peroxidation was determined using a lipid hydroperoxide assay kit from Cayman Chemical Company (Ann Arbor, MI, USA). Briefly, cells were treated as indicated and then scraped. Immediately after sonication, lipid hydroperoxides were extracted using chloroform:methanol (2:1, v/v). Chromogenic reagent was mixed with the chloroform extract, and the mixture was transferred to a 96-well plate reader. The absorbance was measured at 500 nm using a plate reader. 13-Hydroperoxy octadecadienoic acid was used as the standard. The results are expressed as LOOH nmol/ml/mg total protein.
Measurement of mitochondrial membrane potential (MMP)
Mitochondrial membrane potential was monitored using rhodamine 123 (Rh-123) (Satoh et al., 1997). Briefly, cells were treated as indicated, washed with PBS, and resuspended in 10 μg/ml Rh123 in DMEM. The cells were incubated at 37℃ for 30 min and washed three times with PBS. The fluorescence
was measured using 485 nm excitation and 535 nm emission with a Wallac Victor 1420 Multilabel Counter (Perkin Elmer Inc., CA, USA).
Determination of intracellular GSH content
SK-Hep-1 cells were lysed by three cycles of freezing and thawing (-70℃ to 37℃) and centrifuged at 10,000 rpm for 15 min to obtain clear supernatants. A mixture of 143 mM NaPO4 (pH 7.5), 6.3 mM EDTA, 0.6 mM DTNB, 0.25 mM NADPH, and 0.25 U/ml glutathione reductase was added to the supernatants. After incubation at room temperature for 5 min, the absorbance was measured at 412 nm using a UV-2401 PC UV/Vis spectrophotometer (Shimadzu Corporation, Koyto, Japan). The results were calculated from a standard curve obtained with reduced glutathione and expressed as nmol per μg of protein.
Measurement of protein oxidation
Cell lysate obtained by the freezing and thawing method was mixed with 500 μl of 20 mM DNPH dissolved in 2 M HCl and incubated for 1 h at room temperature (with vortexing for 3 sec every 10 min). The mixture was added to 500 μl of 20% TCA and incubated for 20 min on ice. After incubation, the mixture was centrifuged at 12,000 rpm for 20 min at 4℃. The supernatant was discarded and the pellet was washed three times with an ethanol:ethyl acetate solution (1:1 v/v). The pellet was resuspended in 800 μl of 6 M guanidine HCl and 200 μl of phosphate buffer (pH 6.0) and incubated for 15 min at 37℃. After centrifugation at 12,000 rpm for 5 min, the absorbance of the supernatant was measured at 370 nm using a UV-2401 PC UV/Vis spectrophotometer (Shimadzu Corporation, Koyto, Japan). The amount of oxidized protein was calculated using a molar absorption coefficient of 22,000 M-1 cm-1 (Lenz et al., 1989).
Determination of antioxidant enzyme activities
The activities of antioxidant enzymes such as catalase (CAT) and glutathione peroxidase (GPX) were assayed in the supernatant of cell lysate. CAT activity was determined by monitoring the rate of H2O2 consumption in a mixture containing 50 mM potassium phosphate buffer (pH 7.0), 10 mM H2O2 and the supernatant for 3 min at 240 nm (Aebi, 1984). GPX activity was determined by following the enzymatic NADPH oxidation in a mixture containing 1 mM NaN3, 1 mM reduced glutathione, 0.2 mM NADPH, 1 unit/ml glutathione reductase, 2 mM EDTA, 50 mM potassium phosphate buffer (pH 7.6) and the supernatant for 3 min at 340 nm (Flohé and Günzler, 1984).
Caspase-3 activity
Caspase-3 activity was evaluated using a Caspase-3 Fluorescent Assay Kit (Clontech, Palo Alto, CA, USA). Briefly, 50 ml of supernatant was mixed with an equal volume of reaction buffer containing 40 mM PIPES (pH 7.2), 150 mM NaCl, 5 mM EDTA, 0.2% CHAPS, 15% sucrose and 10 mM DTT and incubated for 30 min at 37℃. The fluorescence was measured using 360 nm excitation and 460 nm emission with a Wallac Victor 1420 Multilabel Counter (Perkin Elmer Inc., CA, USA). The data are expressed as a percentage relative to caspase-3 activity in a control group.
Statistical analysis
For statistical analysis of data, p values were analyzed using a paired Student t test software program (Startview 5.1; Abacus Concepts, Berkeley, CA, USA). The results were considered statistically significant when p values were <0.05.
RESULTS
Phytochemicals protect SK-Hep-1 cells from reduced cell viability due to oxidative ethanol metabolism
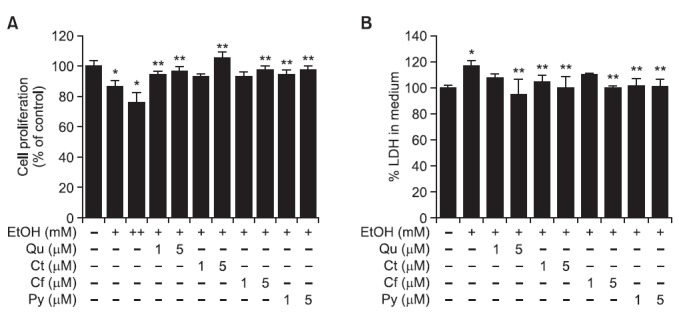
We assessed the effect of phytochemicals on decreased cell viability caused by exposing SK-Hep-1 cells to ethanol. We found that proliferation of SK-Hep-1 cells, measured by an MTT reduction assay, was reduced to 86.5 ± 4.4% and 76.1 ± 6.6% after cells were exposed to 100 mM and 200 mM ethanol, respectively, compared to an ethanol-untreated control (100.0 ± 4.2%). However, co-treatment of cells with 100 mM ethanol and Qu, Ct, Cf or Py (1 or 5 μM) significantly increased
proliferation of SK-Hep-1 cells to a range of 93-106% (Fig. 2A). The cytotoxicity of SK-Hep-1 cells, as measured by a LDH release assay, was elevated to 117.4 ± 4.3% with a 100 mM ethanol treatment, as compared to an ethanol-untreated control (100.0 ± 2.2%). Co-treatment of cells with ethanol and Qu, Ct, Cf and Py (1 or 5 μM) decreased cytotoxicity to 95-110% (Fig. 2B). These data indicate that ethanol-induced hepatotoxicity was suppressed by treatment of Qu, Ct, Cf and Py in SK-Hep-1 cells.
Fig. 2. Protective effect of phytochemicals against ethanol-induced cell death in SK-Hep-1 cells. Two concentrations of Qu, Ct, Cf, or Py (1 and 5 μM) were simultaneously treated with ethanol for 72 h. (A) Cell viability was measured by MTT assays. (B) Cytotoxicity was examined by LDH assay. Each bar represents the mean ± SD of six independent experiments. Qu: quercetin; Ct: catechin; Cf: caffeic acid; Py: phytic acid; +:100 mM ethanol; ++: 200 mM ethanol. *p<0.05 versus ethanol-untreated cells, **p<0.05 versus 100 mM ethanol-treated cells.
Phytochemicals protect SK-Hep-1 cells from oxidative stress induced by oxidative ethanol metabolism
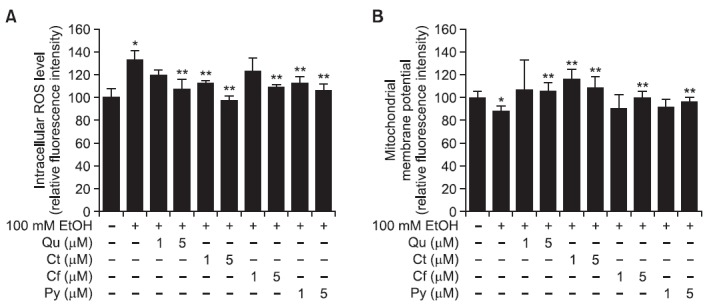
We examined whether phytochemicals affect intracellular ROS production and mitochondrial membrane potential (MMP) in SK-Hep-1 cells. The intracellular ROS level, measured using a DCF-DA probe, was significantly increased by 100 mM ethanol treatment compared to untreated cells (100 ± 8.1% versus 133.5 ± 7.7%). However, co-treatment of Qu, Ct, Cf or Py (1 and 5 μM) with 100 mM ethanol restored intracellular ROS levels to a range of 98-123% (Fig. 3A). Moreover, the MMP of SK-Hep-1 cells, measured by Rh-123, was reduced by 100 mM ethanol (88.7 ± 4.2% versus 100 ± 5.4% in ethanol-untreated) and elevated to a range of 91-116% by the addition of Qu, Ct, Cf and Py (Fig. 3B). In particular, Ct was very effective at recovering levels of intracellular ROS and MMP altered by ethanol treatment.
Fig. 3. Protective effect of phytochemicals against ethanol-induced oxidative stress in SK-Hep-1 cells. Two concentrations (1 and 5 μM) of Qu, Ct, Cf, or Py were simultaneously treated with ethanol for 72 h. (A) Intracellular ROS levels were measured using DCFH-DA. (B) The mitochondrial membrane potential was examined using Rh123. Each bar represents the mean ± SD of five independent experiments. Qu: quercetin; Ct: catechin; Cf: caffeic acid; Py: phytic acid. *p<0.05 versus ethanol-untreated cells, **p<0.05 versus ethanol-treated cells.
Phytochemicals restored levels of oxidative stress markers altered by oxidative ethanol metabolism
In addition to acetaldehyde and acetate, ethanol metabolism generates ROS, which induces GSH depletion, damage to the cell membrane, protein oxidation, DNA damage, and alteration of antioxidant enzyme activity (Kurose et al., 1996; Navasumrit et al., 2000; Ogony et al., 2008). Lipid hydroperoxide (LPO) is one of many lipid peroxidation substances induced in the cell membrane by oxidative stress. In this study, LPO levels were increased by 100 mM ethanol (1.48 ± 0.21 versus 1.19 ± 0.1 nmol/ml/mg protein in ethanol-untreated), and decreased by 14-18% with the addition of Qu, Ct, Cf and Py (Table 1). The protein oxidation level, which measures the extent of the oxidative damage to protein, was elevated by ethanol (0.059 ± 0.003 versus 0.048 ± 0.003 nmol/ml/mg protein in ethanol-untreated). However, co-treatment of cells with ethanol and Qu, Ct, Cf and Py decreased the extent of protein oxidation by 10-14% (Table 1). The level of reduced glutathione
Table. 1.
Effect of phytochemicals on biomarkers for ethanol-induced oxidative stress in SK-Hep-1 cells
| Group | LPO (nmol/ml/mg protein) | GSH (nmol/μg protein) | Protein oxidation (nmol/mg protein) | CAT (mU/mg protein) | GPX (mU/mg protein) |
|---|---|---|---|---|---|
| Control | 1.19 ± 0.10 | 6.96 ± 0.42 | 0.048 ± 0.003 | 17.0 ± 1.8 | 11.0 ± 1.2 |
| 100 mM EtOH | 1.48 ± 0.21* | 6.54 ± 0.50* | 0.059 ± 0.003* | 20.0 ± 2.0* | 14.0 ± 1.1* |
| 100 mM EtOH+5 μM Qu | 1.27 ± 0.18 | 6.62 ± 0.47 | 0.051 ± 0.002** | 17.0 ± 1.6** | 13.0 ± 1.5** |
| 100 mM EtOH+5 μM Ct | 1.22 ± 0.09 | 6.65 ± 0.51 | 0.053 ± 0.002** | 18.0 ± 1.6** | 11.0 ± 1.3** |
| 100 mM EtOH+5 μM Cf | 1.28 ± 0.11** | 6.71 ± 0.43** | 0.052 ± 0.003** | 17.0 ± 1.7** | 12.0 ± 1.3** |
| 100 mM EtOH+5 μM Py | 1.25 ± 0.10** | 6.61 ± 0.44 | 0.052 ± 0.002** | 18.0 ± 1.9** | 12.0 ± 1.5** |
SK-HepG-1 cells were incubated with 100 mM ethanol with or without Qu, Ct, Cf, or Py. Values are mean ± SD of five independent experiments. LPO: lipid hydroperoxide; GSH: reduced glutathione; CAT: catalase; GPX: glutathione peroxidase; EtOH: ethanol; Qu: quercetin; Ct: catechin; Cf: caffeic acid; Py: phytic acid. *p<0.05 versus ethanol-untreated cells, **p<0.05 versus 100 mM ethanol-treated cells.
(GSH) was decreased by ethanol treatment (6.54 ± 0.50 versus 6.96 ± 0.42 nmol/ml/mg protein in ethanol-untreated) and increased to a range of 6.61-6.71 nmole/μg protein with the addition of Qu, Ct, Cf and Py (Table 1). The activity of CAT and GPX, enzymatic antioxidants, was increased by 18 and 27%, respectively, with ethanol treatment, and the addition of Qu, Ct, Cf and Py restored CAT and GPX activities to control levels. These data indicate that Qu, Ct, Cf and Py protect SK-Hep-1 cells from oxidative damage by regulating markers of oxidative stress.
Phytochemicals protect SK-Hep-1 cells from cell death induced by non-oxidative ethanol metabolism
As shown in Fig. 4A, non-oxidative ethanol metabolism stimulated cytotoxicity of SK-Hep-1 cells in 2 mM 4-MP plus 200 mM ethanol (124.3 ± 3.8% versus 100.0 ± 2.8% in ununtreated
Fig. 4. Protective effect of phytochemicals against non-oxidative ethanol metabolism-induced cell death in SK-Hep-1 cells. The 5 μM concentration of Qu, Ct, Cf, or Py was simultaneously treated with ethanol plus 4-MP for 72 h. (A) Cell cytotoxicity was examined by LDH assay. (B) Caspase-3 activity was determined using DEVD-AFC substrate. Each bar represents the mean ± SD of six independent experiments. EtOH: ethanol; 4-MP: 4-methylpyrazol; Qu: quercetin; Ct: catechin; Cf: caffeic acid; Py: phytic acid. *p<0.05 versus ethanol-untreated cells, **p<0.05 versus 2 mM 4-MP plus 200 mM ethanol-treated cells.
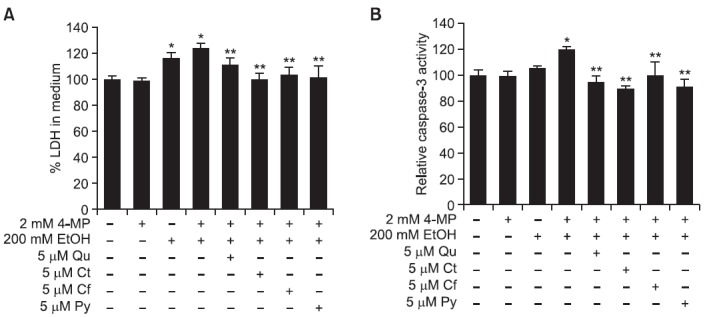
cells) without any effect of 4-MP alone. Non-oxidative ethanol metabolism also showed increased cytotoxicity as compared to oxidative ethanol metabolism (124.3 ± 3.8% versus 116.3 ± 4.5%). However, the addition of Qu, Ct, Cf and Py lowered cytotoxicity to a range of 101-112%. Furthermore, caspase-3 activity showed an increase in non-oxidative ethanol metabolism (120.0 ± 2.5% versus 100.0 ± 4.4% in untreated cells) without any effect of 4-MP alone, and this activity was higher than in cells treated with 200 mM ethanol alone. The addition of Qu, Ct, Cf and Py decreased caspase-3 activity to a range of 90-100% (Fig. 4B).
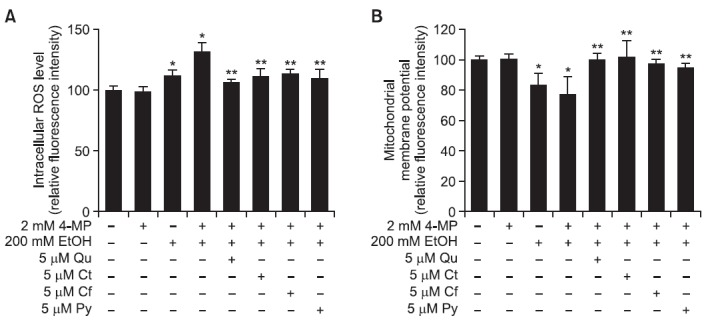
Phytochemicals protect SK-Hep-1 cells from oxidative stress induced by non-oxidative ethanol metabolism
We investigated the effect of phytochemicals on ROS production and MMP in non-oxidative ethanol metabolism-induced
SK-Hep-1 cells. As shown in Fig. 5A, cells treated with 2 mM 4-MP plus 200 mM ethanol showed increased intracellular ROS production (132.6 ± 7.7%) compared to untreated cells (100.0 ± 8.2%), as well as cells treated with 200 mM ethanol alone (112.0 ± 7.7%). The 4-MP alone did not show any effects on intracellular ROS production. However, the addition of Qu, Ct, Cf and Py decreased intracellular ROS production that was induced by non-oxidative ethanol metabolism to a range of 106-113%. In addition, MMP was decreased in 2 mM 4-MP plus 200 mM ethanol-treated cells (77.4 ± 7.8%) as compared to untreated control cells (100.0 ± 8.1%) and cells treated with 200 mM ethanol alone (83.4 ± 7.9%). The 4-MP alone did not show any effects on alteration of MMP. The addition of Qu, Ct, Cf and Py restored MMP levels to a range of 94-102% (Fig. 5B).
Fig. 5. Protective effect of phytochemicals against non-oxidative ethanol metabolism-induced oxidative stress in SK-Hep-1 cells. The 5 μM concentration of Qu, Ct, Cf, or Py was simultaneously treated with ethanol for 72 h. (A) Intracellular ROS levels were measured using DCFH-DA. (B) The mitochondrial membrane potential was examined using Rh123. Each bar represents the mean ± SD of five independent experiments. EtOH: ethanol; 4-MP: 4-methylpyrazol; Qu: quercetin; Ct: catechin; Cf: caffeic acid; Py: phytic acid. *p<0.05 versus ethanol-untreated cells, **p<0.05 versus 2 mM 4-MP plus 200 mM ethanol-treated cells.
Phytochemicals attenuate levels of oxidative stress biomarkers increased by non-oxidative ethanol metabolism
We observed that treatment of cells with 2 mM 4-MP plus 200 mM ethanol remarkably increased LPO levels by 3 fold (3.30 ± 0.14 nmol/ml/mg protein), and cells treated with 200 mM ethanol alone also displayed increased LPO levels (2.13 ± 0.10 nmol/ml/mg protein) compared to untreated cells (1.16 ± 0.08 nmol/ml/mg protein) (Table 2). However, the addition of Qu, Ct, Cf and Py showed a decrease in LPO levels to 62-80%, compared to 2 mM 4-MP plus 200 mM ethanol-treated cells. Protein oxidation levels displayed an increase in non-oxidative ethanol metabolism compared with untreated controls (0.126 ± 0.006 versus 0.094 ± 0.004 nmol/mg protein). The same result was shown in cells treated with 200 mM ethanol alone (0.104 ± 0.001 nmol/mg protein). Treatment of cells with Qu, Ct, Cf and Py increased protein oxidation levels to a range of 106-113% compared with 2 mM 4-MP plus 200 mM ethanol-treated cells. In addition, CAT and GPX antioxidant enzyme activity was elevated to 124.0 and 124.3% by non-oxidative ethanol metabolism compared to 100.0% in untreated control cells, and antioxidant enzyme activity was increased in non-oxidative ethanol metabolism as compared to oxidative ethanol metabolism (Table 2). Treatment of cells with Qu, Ct, Cf and Py suppressed the increased CAT and GPX activities by 7-14%.
Table 2.
Effect of phytochemicals on biomarkers for oxidative stress induced by non-oxidative metabolism of ethanol in SK-Hep-1 cells
| Group | LPO (nmol/ml/mg protein) | Protein oxidation (nmol/mg protein) | CAT (mU/mg protein) | GPX (mU/mg protein) |
|---|---|---|---|---|
| Control | 1.16 ± 0.08 | 0.094 ± 0.004 | 21.3 ± 1.6 | 15.2 ± 0.6 |
| 200 mM EtOH | 2.13 ± 0.10* | 0.104 ± 0.001* | 25.2 ± 0.8* | 17.4 ± 0.6* |
| 200 mM EtOH+4-MP | 3.30 ± 0.14* | 0.126 ± 0.006* | 26.5 ± 0.8* | 18.9 ± 0.8* |
| 200 mM EtOH+4-MP+5 μM Qu | 2.57 ± 0.10** | 0.107 ± 0.008** | 23.1 ± 0.8** | 17.5 ± 1.2 |
| 200 mM EtOH+4-MP+5 μM Ct | 2.37 ± 0.09** | 0.104 ± 0.007** | 22.7 ± 1.9** | 16.2 ± 0.7** |
| 200 mM EtOH+4-MP+5 μM Cf | 2.58 ± 0.17** | 0.099 ± 0.008** | 24.7 ± 0.7** | 16.7 ± 0.9** |
| 200 mM EtOH+4-MP+5 μM Py | 2.59 ± 0.22** | 0.107 ± 0.008** | 24.1 ± 1.0** | 17.2 ± 0.4** |
Values are mean ± SD of five independent experiments. LPO: lipid hydroperoxide; CAT: catalase; GPX: glutathione peroxidase. EtOH: ethanol; 4-MP: 4-methylpyrazol; Qu: quercetin; Ct: catechin; Cf: caffeic acid; Py: phytic acid. *p<0.05 versus ethanol-untreated cells, **p<0.05 versus 2 mM 4-MP plus 200 mM ethanol-treated cells.
DISCUSSION
The liver is not the only organ responsible for metabolizing ingested ethanol, but it is the primary location for the metabolism of various xenobiotics (Lieber, 1997). Acute or chronic consumption of ethanol is known to be one of the most important factors that cause liver damage (Lu and Cederbaum, 2008). It is caused by deleterious metabolites including acetaldehyde, FAEE and ROS generated by ethanol metabolism (Best et al., 2006; Lu and Cederbaum, 2008). This study focused on the effects of phytochemicals on the alteration of the antioxidative defense system against oxidative stress in a SK-Hep-1 cell line challenged with oxidative and non-oxidative metabolism of ethanol.
In a preliminary experiment, SK-Hep-1 cells expressed approximately 10 times higher ADH activity (data not shown) than widely used HepG2 cells. In addition, the concentration of 5 μM could be safely used when phytochemicals were tested for their potential cytotoxicity on SK-Hep-1 cells (data not shown). Therefore, a dosage range between 1 and 5 μM was selected for all experimental conditions.
Exposure of SK-Hep-1 cells to ethanol resulted in decreased cell viability in oxidative ethanol metabolism. Furthermore, there was elevated ROS production, which led to lipid peroxidation, protein oxidation, loss of MMP, reduction of GSH, and an increase of antioxidant enzyme activity. However, co-treatment of cells with quercetin, catechin, caffeic acid and phytic acid and ethanol significantly recovered cell viability initially reduced by ethanol. To explore whether the cytoprotection of these phytochemicals is due to ROS scavenging activity, we investigated intracellular ROS levels by co-treatment of the phytochemicals with ethanol in SK-Hep-1 cells. All phytochemicals decreased ROS production elevated by ethanol and restored increased LPO levels and protein oxidation, loss of MMP, and alteration of antioxidant system activity.
The liver has a minor non-oxidative metabolism pathway for ethanol, besides the major oxidative metabolism pathway of ethanol oxidized by ADH, CYP2E1, and catalase. The non-oxidative metabolism pathway of ethanol synthesizes FAEE, which is a toxic metabolite (Laposata, 1998). Recent studies reported that inhibition of the oxidative metabolism pathway of ethanol induced by 4-MP caused a 2- to 3-fold increase in the production of FAEE in the liver and pancreas (Best et al., 2006), and FAEE induced apoptosis in lymphocytes and HepG2 cells (Aydin et al., 2005).
To determine whether the non-oxidative metabolism of ethanol affects cytotoxicity in SK-Hep-1 cells, we examined cell viability when oxidative metabolism of ethanol was inhibited by 4-MP. We found that the non-oxidative metabolism of ethanol encouraged cytotoxicity and apoptosis more than the oxidative metabolism of ethanol and was followed by augmentation of ROS production, lipid peroxidation, protein oxidation, antioxidant enzyme activity, and loss of MMP. These results indicate that non-oxidative ethanol metabolism induced oxidative insult in SK-Hep-1 cells more than oxidative ethanol metabolism.
Nevertheless, treatment with quercetin, catechin, caffeic acid and phytic acid in the non-oxidative metabolism of ethanol significantly restored cytotoxicity in SK-Hep-1 cells. Furthermore, these phytochemicals suppressed ROS and LPO production, protein oxidation, and loss of MMP and increased CAT and GPX activities during 4-MP-induced non-oxidative metabolism of ethanol in SK-Hep-1 cells.
In conclusion, this study demonstrates that quercetin, catechin, caffeic acid and phytic acid have protective roles against oxidative damage in SK-Hep-1 cells during the oxidative and non-oxidative metabolism of ethanol. The protective effects appear to be a result of the reduction of cytotoxicity via the inhibition of ROS production and restoration of the antioxidant system.
Acknowledgments
This work was supported by Bio-industry Technology Development Program (111052-04-SB010) and Ministry for Food, Agriculture, Forestry and Fisheries, Republic of Korea.
References
- 1.Aebi H. Catalase in vitro. Methods Enzymol. (1984);105:121–126. doi: 10.1016/S0076-6879(84)05016-3. [DOI] [PubMed] [Google Scholar]
- 2.Aydin H. H., Celik H. A., Deveci R., Karacali S., Saydam G., Bedii Omay S., Batur Y. Induction of apoptosis by fatty acid ethyl esters in HepG2 cells. Food Chem. Toxicol. (2005);43:139–145. doi: 10.1016/j.fct.2004.09.003. [DOI] [PubMed] [Google Scholar]
- 3.Best C. A., Sarkola T., Eriksson C. J., Cluette-Brown J. E., Laposata M. Increased plasma fatty acid ethyl ester levels following inhibition of oxidative metabolism of ethanol by 4-methylpyrazole treatment in human subjects. Alcohol Clin. Exp. Res. (2006);30:1126–1131. doi: 10.1111/j.1530-0277.2006.00138.x. [DOI] [PubMed] [Google Scholar]
- 4.Calabrese V, Renis M, Calderone A, Russo A, Barcellona M. L., Rizza V. Stress proteins and SH-groups in oxidant-induced cell damage after acute ethanol administration in rat. Free Radic. Biol. Med. 20:391–397. doi: 10.1016/0891-5849(95)02095-0. [DOI] [PubMed] [Google Scholar]
- 5.Flohé L., Günzler W. A. Assays of glutathione peroxidase. Methods Enzymol. (1984);105:114–121. doi: 10.1016/S0076-6879(84)05015-1. [DOI] [PubMed] [Google Scholar]
- 6.Granado-Serrano A. B., Mart?n M. A., Bravo L., Goya L., Ramos S. Quercetin induces apoptosis via caspase activation, regulation of Bcl-2, and inhibition of PI-3-kinase/Akt and ERK pathways in a human hepatoma cell line (HepG2). J. Nutr. (2006);136:2715–2721. doi: 10.1093/jn/136.11.2715. [DOI] [PubMed] [Google Scholar]
- 7.Kahraman A., Çakar H., Köken T. The protective effect of quercetin on long-term alcohol consumption-induced oxidative stress. Mol. Biol. Rep. (2012);39:2789–2794. doi: 10.1007/s11033-011-1037-2. [DOI] [PubMed] [Google Scholar]
- 8.Kang H. S., Kim Y. H., Lee C. S., Lee J. J., Choi I., Pyun K. H. Suppression of interleukin-1 and tumor necrosis factor-alpha production by acanthoic acid, (-)-pimara-9(11),15-dien-19-oic acid, and it antifibrotic effects in vivo. Cell Immunol. . (1996);170:212–221. doi: 10.1006/cimm.1996.0154. [DOI] [PubMed] [Google Scholar]
- 9.Kurose I.,, Higuchi H, Kato S, Miura S., Ishii H. Ethanol-induced oxidative stress in the liver. Alcohol Clin. Exp. Res. (1996);20(1 Suppl):77A–85A. doi: 10.1111/j.1530-0277.1996.tb01736.x. [DOI] [PubMed] [Google Scholar]
- 10.Laposata M. Fatty acid ethyl esters: ethanol metabolites which mediate ethanol-induced organ damage and serve as markers of ethanol intake. Prog. Lipid Res. (1998);37:307–316. doi: 10.1016/S0163-7827(98)00013-7. [DOI] [PubMed] [Google Scholar]
- 11.Lenz A. G., Costabel U., Shaltiel S., Levine R. L. Determination of carbonyl groups in oxidatively modified proteins by reduction with tritiated sodium borohydride. Anal. Biochem. (1989);177:419–425. doi: 10.1016/0003-2697(89)90077-8. [DOI] [PubMed] [Google Scholar]
- 12.Lieber C. S. Ethanol metabolism, cirrhosis and alcoholism. Clin. Chim. Acta. (1997);257:59–84. doi: 10.1016/S0009-8981(96)06434-0. [DOI] [PubMed] [Google Scholar]
- 13.Liu S., Hou W., Yao P., Zhang B., Sun S., Nüssler A. K., Liu L. Quercetin protects against ethanol-induced oxidative damage in rat primary hepatocytes. Toxicol. In Vitro . (2010);24:516–522. doi: 10.1016/j.tiv.2009.03.006. [DOI] [PubMed] [Google Scholar]
- 14.Lu Y., Cederbaum A. I. CYP2E1 and oxidative liver injury by alcohol. Free Radic. Biol. Med. (2008);44:723–738. doi: 10.1016/j.freeradbiomed.2007.11.004. [DOI] [PMC free article] [PubMed] [Google Scholar]
- 15.Matés J. M., Segura J. A., Alonso F. J., Márquez J. Anticancer antioxidant regulatory functions of phytochemicals. Curr. Med. Chem. (2011);18:2315–2338. doi: 10.2174/092986711795656036. [DOI] [PubMed] [Google Scholar]
- 16.Molina M. F., Sanchez-Reus I., Iglesias I., Benedi J. Quercetin, a flavonoid antioxidant, prevents and protects against ethanol-induced oxidative stress in mouse liver. Biol. Pharm. Bull. (2003);26:1398–1402. doi: 10.1248/bpb.26.1398. [DOI] [PubMed] [Google Scholar]
- 17.Navasumrit P., Ward T. H., Dodd N. J., O'Connor P. J. Ethanol-induced free radicals and hepatic DNA strand breaks are prevented in vivo by antioxidants: effects of acute and chronic ethanol exposure. Carcinogenesis . (2000);21:93–99. doi: 10.1093/carcin/21.1.93. [DOI] [PubMed] [Google Scholar]
- 18.Nordmann R., Ribière C., Rouach H. Implication of free radical mechanisms in ethanol-induced cellular injury. Free Radical Biol. Med. (1992);12:219–240. doi: 10.1016/0891-5849(92)90030-K. [DOI] [PubMed] [Google Scholar]
- 19.Ogony J., Matthews R., Anni H., Shannon K., Ercal N. The mechanism of elevated toxicity in HepG2 cells due to combined exposure to ethanol and ionizing radiation. J. Appl. Toxicol. (2008);28:345–355. doi: 10.1002/jat.1285. [DOI] [PubMed] [Google Scholar]
- 20.Oliva J, Bardag-Gorce F, Tillman B., French S. W. Protective effect of quercetin, EGCG, catechin and betaine against oxidative stress induced by ethanol in vitro. Exp. Mol. Pathol. . (2011);90:295–299. doi: 10.1016/j.yexmp.2011.02.006. [DOI] [PMC free article] [PubMed] [Google Scholar]
- 21.Prasad N. R, Jeyanthimala K., Ramachandran S. Caffeic acid modulates ultraviolet radiation-B induced oxidative damage in human blood lymphocytes. J. Photochem. Photobiol. (2009);95:196–203. doi: 10.1016/j.jphotobiol.2009.03.007. [DOI] [PubMed] [Google Scholar]
- 22.Rampart M., Beetens J. R., Bult H., Herman A. G., Parnham M. J., Winkelmann J. Complement-dependent stimulation of prostacyclin biosynthesis: inhibition by rosmarinic acid. Biochem. Pharmacol. (1986);35:1397–1400. doi: 10.1016/0006-2952(86)90289-3. [DOI] [PubMed] [Google Scholar]
- 23.Reddy M. B., Hurrell R. F., Juillerat M. A., Cook J. D. The influence of different protein sources on phytate inhibition of nonheme-iron absorption in humans. Am. J. Clin. Nutr. (1996);63:203–207. doi: 10.1093/ajcn/63.2.203. [DOI] [PubMed] [Google Scholar]
- 24.Ross J. A., Kasum C. M. Dietary flavonoids: bioavailability, metabolic effects, and safety. Annu. Rev. Nutr. (2002);22:19–34. doi: 10.1146/annurev.nutr.22.111401.144957. [DOI] [PubMed] [Google Scholar]
- 25.Russo M., Spagnuolo C., Tedesco I., Bilotto S., Russo G. L. The flavonoid quercetin in disease prevention and therapy: facts and fancies. Biochem. Pharmacol. (2012);83:6–15. doi: 10.1016/j.bcp.2011.08.010. [DOI] [PubMed] [Google Scholar]
- 26.Sarkola T., Iles M. R., Kohlenberg-Mueller K., Eriksson C. J. Ethanol, acetaldehyde, acetate, and lactate levels after alcohol intake in white men and women: effect of 4-methylpyrazole. Alcohol. Clin. Exp. Res. (2002);26:239–245. doi: 10.1111/j.1530-0277.2002.tb02530.x. [DOI] [PubMed] [Google Scholar]
- 27.Satoh T., Enokido Y., Aoshima H., Uchiyama Y., Hatanaka H. Changes in mitochondrial membrane potential during oxidative stress-induced apoptosis in PC12 cells. J. Neurosci. Res. . (1997);50:413–420. doi: 10.1002/(SICI)1097-4547(19971101)50:3<413::AID-JNR7>3.0.CO;2-L. [DOI] [PubMed] [Google Scholar]
- 28.Shamsuddin A. M., Vucenik I., Cole K. E. IP6: a novel anti-cancer agent. Life Sci. . (1997);61:343–354. doi: 10.1016/S0024-3205(97)00092-1. [DOI] [PubMed] [Google Scholar]
- 29.Vucenik I., Shamsuddin A. M. Protection against cancer by dietary IP6 and inositol. Nutr. Cancer. (2006);55:109–125. doi: 10.1207/s15327914nc5502_1. [DOI] [PubMed] [Google Scholar]
- 30.Vucenik I., Tomazic V. J., Fabian D., Shamsuddin A. M. Antitumor activity of phytic acid (inositol hexaphosphate) in murine transplanted and metastatic fibrosarcoma, a pilot study. Cancer Lett. (1992);65:9–13. doi: 10.1016/0304-3835(92)90206-B. [DOI] [PubMed] [Google Scholar]
- 31.Wang H., Joseph J. A. Quantifying cellular oxidative stress by dichlorofluorescein assay using microplate reader. Free Radic. Biol. Med. (1999);27:612–616. doi: 10.1016/S0891-5849(99)00107-0. [DOI] [PubMed] [Google Scholar]
- 32.Wu H., Cai P., Clemens D. L., Jerrells T. R., Ansari G. A., Kaphalia B. S. Metabolic basis of ethanol-induced cytotoxicity in recombinant HepG2 cells: role of nonoxidative metabolism. Toxicol. Appl. Pharmacol. . (2006);216:238–247. doi: 10.1016/j.taap.2006.05.003. [DOI] [PubMed] [Google Scholar]