

Abstract
Microglia play a role in maintaining and resolving brain tissue homeostasis. In pathological conditions, microglia release pro-inflammatory cytokines and cytotoxic factors, which aggravate the progression of neurodegenerative diseases. Autophagy pathway might be involved in the production of pro-inflammatory cytokines and cytotoxic factors in microglia, though details of the mechanism remain largely unknown. In the present study, we examined the role of the autophagy pathway in activated BV2 microglia cells. In BV2 cells, rapamycin treatment activated the formation of anti-LC3-labeled autophagosomes, whereas the ATG5 depletion using siRNA-ATG5 prevented the formation of LC3-labeled autophagosomes, indicating that BV2 cells exhibit an active classical autophagy system. When treated with LPS, BV2 cells expressed an increase of anti-LC3-labeled dots. The levels of LC3-labeled dots were not suppressed, instead tended to be enhanced, by the inhibition of the autophagy pathway with siRNA-ATG5 or wortmannin, suggesting that LPS-induced LC3-labeled dots in nature were distinct from the typical autophagosomes. The levels of LPS-induced expression of iNOS and IL6 were suppressed by treatment with rapamycin, and conversely, their expressions were enhanced by siRNA-ATG5 treatment. Moreover, the activation of the autophagy pathway using rapamycin inhibited cell death of LPS-stimulated microglia. These results suggest that although microglia possess a typical autophagy pathway, the glial cells express a non-typical autophagy pathway in response to LPS, and the activation of the autophagy pathway suppresses the expression of iNOS and IL6, and the cell death of LPS-stimulated microglia.
Keywords: Autophagy, LPS, iNOS, IL6, Microglia
INTRODUCTION
Microglia are macrophage-like resident immune cells in the brain. Microgia are activated in response to various cellular factors, including cytokines, chemokines, nitric oxide (NO), and reactive oxygen intermediates and by pathological insults including truma, stroke, and infection (Gehrmann et al., 1995; Magazine et al., 1996; Perry et al., 2010). In normal brain conditions, microglia play a role in the maintenance and resolution of brain tissue homeostasis. In pathological conditions, microglia release high levels of pro-inflammatory mediators and cytotoxic factors, which may activate nearby microglia and thus propagate the production of pro-inflammatory factors in a vicious cycle (Hanisch, 2002; Smith et al., 2012). Prolonged, or excessive activation of microglia may produce inflammatory reactions in the brain, which are believed to aggravate the progression of neurodegenerative diseases including Alzheimer’s disease, Parkinson’s disease, and ALS (McGeer et al., 1988; Matsumoto et al., 1992; Raine, 1994; Henkel et al., 2009). Pharmacological or genetic inhibition of the action of proinflammatory cytokines and NO causes neuroprotective effects in cell cultures in vitro, and in animal models of neurodegenerative diseases (Iadecola et al., 1997; Mayo and Stein, 2007; Beurel and Jope, 2009).
In various types of cells, defective cytoplasmic materials or infective pathogens are engulfed into double-membrane vesicles known as autophagosomes, which are then fused with lysosomes and degraded or recycled. This process, called autophagy, plays a major role in resolving dysfunctional cellular proteins and organelles resulting from many physiological and pathological conditions (Levine and Klionsky, 2004). Proper activation of the autophagy pathway ensures cell survival and function, while excess or reduced activation of the autophagy pathway may cause pathological consequences including the failure of removing pathogenic materials and increased cell death in neurodegenerative diseases (Nixon and Yang, 2011; Rosello et al., 2012). The autophagy pathway is regulated by the signaling pathway regulated by the mammalian target of rapamycin (mTOR), which is a serine/threonine protein kinase. mTOR normally functions as a negative regulator of the autophagy pathway. Inhibition of mTOR leads to turn on the autophagy pathway. Rapamycin, which is a lipophilic macrolide isolated from a strain of Streptomyces hygroscopicus, is a potent suppressor of mTOR (Zoncu et al., 2011). Typically, cells treated with rapamycin express the autophagy pathway. Upon induction of autophagy, microtuble-associated protein light chain 3 (LC3), a mammalian homolog of yeast Atg8, is conjugated to phosphatidyl ethanolamine (PE) by aid of autophagy-regulating gene products, such as ATG5 and ATG7. The lipidation of Gly120 of LC3 with PE converts the LC3-I form to LC3-II form, which is then then targeted to autophagic membranes (Nakagawa et al., 2004; Virgin and Levine, 2009). Recently it was reported that LPS treatment in macrophages produces aggresome-like induced structures (ALIS), which is independent from the classic autophagic mechanism, and the ALIS formation was regulated by the enhanced expression of Nrf2 and p62 (Fujita et al., 2011). Similar to ALIS in LPS-stimulated macrophages, dendritic cells treated with LPS, produced dendritic cell aggresome-like induced structures (DALIS). The DALIS formation was prevented by the inhibition of new protein synthesis, whereas abnormal protein synthesis enhanced DALIS (Lelouard et al., 2002; Lelouard et al., 2004). Although changes in LC3 localization have been used to measure autophagy, LC3 formation can be induced independent from the classic autophagic mechanism.
Autophagy influences the physiological and pathological conditions of many immune cells including macrophages. Autophagy plays a critical role in the pathogen elimination and cytokines production of macrophages (Singh et al., 2006; Saitoh et al., 2008; Nakahira et al., 2011; Lee et al., 2012). Increased activation of IL-1β and IL-18 has also been observed in macrophages and monocytes isolated from mice genetically deficient in atg16l1, Beclin 1, or LC3B (Saitoh et al., 2008; Nakahira et al., 2011). Therefore, it might be assumed that the autophagy pathway plays a role in microglia, the resident immune cells carrying many macrophage-like properties in the brain. However, autophagy formation and regulation in microglia, and its effect on the production of pro-inflammatory and cytotoxic factors are largely unknown. In the present study, we demonstrated that BV2 microglia cells express both classical and modified autophagy processes, and the activation of autophagy process mitigates the expression of IL6, iNOS and the cell death of BV2 cells challenged with LPS.
MATERIALS AND METHODS
Cell cultures and transfection
BV2 cells were cultured as described previously (Yu et al., 2005). In brief, BV2 cells were maintained in DMEM (GIBCO-BRL) supplemented with 10% fetal bovine serum (GIBCO-BRL), 1% L-glutamine, penicillin (50 U/L), and streptomycin (50 mg/ml). For transfection with small interfering RNA (siRNA), cells were plated in 6-well plates at 2×10⁵ cells/well. Plated cells were grown in DMEM with 10% FBS overnight, and were then transfected with siRNA-mATG5 (#L-064838: Dhamacon, Lafayette, CO, USA; #1325012, 1325013 and 1325014: Bioneer, Daejon, Korea) using the transfection reagent Lipofectamine RNAiMAX (Invitrogen, California, USA) according to the manufacturer’s protocol, 24 h prior to treatment with drugs.
Production of BV2 stable cell lines expressing GFP-LC3
Production of stable cell lines, and clonal selection were performed as described previously (Sims et al., 2010). The pEGFP-LC3 plasmid was described (Kabeya et al., 2000). Total pEGFP-LC3 plasmid 500 ng was mixed with 1 μl of lipofectamine (Invitrogen) and incubated for 5 h, by following the manufacture’s suggestion. The plasmid mix was then used to transfect BV2 cells growing in DMEM (GIBCO-BRL, Rockville, MA, USA) supplemented with 10% fetal bovine serum (GIBCO-BRL), 1% L-glutamine, penicillin (50 U/L), and streptomycin (50 mg/ml) in 24-well plates. After 48 h, the culture media was changed in every 3 days, replacing with fresh DMEM, containing G418 of increasing concentrations (400 μg/ml, 600 μg/ml and 800 μg/ml) throughout the 3-weeks period. Finally, 3 GFP-positive BV2 colonies were obtained. Each colony was selected and expanded in DMEM containing G418 at 400 μg/ml and cloned cells were named BV2-GFP-LC3 stable cells (or BV2-LC3 cells). The BV2-GFP-LC3 stable cells that express GFP at the highest level were used in the present study.
Autophagy assay
Autophagy Assay was performed by following the procedures described previously (Xu et al., 2007; Lee et al., 2010) with a minor modification. BV2 cells or BV2-LC3 cells growing in a 6-well plate for 24 h were treated with rapamycin (#R0395; Sigma, St. Louis, MO, USA), LPS (#L4516; Sigma, St. Louis, MO, USA), or wortmannin (#W1628; Sigma, St. Louis, MO, USA) for the indicated times. For quantification of LC3-positive dots, BV2 cells cultured on coverslips (BD) were fixed with 4% paraformaldehyde in PBS. After permeabilization with 0.5% Triton X-100 for 10 min, fixed cells were blocked with 5% BSA for 1 h, and then stained with anti-LC3 antibody (1:100 dilution; Abgent, San Diego, CA, USA) overnight. After washing, they were then incubated with secondary anti-mouse IgG-FITC for 1 h. The coverslips were mounted on slides using DAPI-containing mounting solution (Vector Laboratories, Burlingame, CA). LC3 dot images were analyzed using a confocal microscope (Zeiss LSM 510) and using a fluorescent microscope (Olympus, Tokyo, Japan) equipped with the TOMORO image analysis program (TOMORO Scope Eye™; Techsan Community, Seoul, Korea). The formation of GFP-LC3 dots in BV2-LC3 cells was analyzed using a fluorescent microscope. The ratio of the area of LC3-positive dots vs. the area of total cells was calculated.
Western blot analysis
Cellular proteins were extracted with RIPA buffer [50 mM Tris (pH 8.0), 150 mM NaCl, 1 mM EDTA, 10% glycerol, 2% Triton X-100 (Im et al., 2011), and a protein inhibitor mixture (Roche, Basel, Swiss)]. Total 30 μg of proteins per each lane was subjected to immune blot analysis. Mouse monoclonal to LC3 (1:100 dilution; Abgent) and α-tubulin were used.
Real-time quantitative PCR analysis
Total RNA was extracted using the TRIzol reagent. The following primers were used: 5’-GCTGCCCTATACCCACATCT-3’ and 5’-CGCCTTCATCCGAGAAAC-3’ for p62/SQSTM1; 5’-GATGGATGCTACCAA ACTGGAT-3’ and 5’-GATGGATGCTACCAA ACTGGAT-3’ for IL-6; 5’-CTTGCCACGGACGAGAC-3’ and 5’-TCATTGTACTCTGAGGGCTGA-3’ for iNOS; 5’-AAGTCTGTCCTTCCGCAGTC-3’ and 5’-TGAAGAAAGTTATCTGGGT AGCTCA-3’ for ATG5; 5′- AGACATGGAGTCATAGGCTCTG-3’ and 5’-CCATTTTCCTTCTTGTGGAGCA-3’ for IL-12; 5’-TCACACGAGATGAGCTTAGGGCAA-3’ and 5’-TACAGTTCTGG GCGGCGACTTTAT-3’ for Nrf2; 5’-CGTCAGCCGATTTGCTATCT-3’ and 5’-CGGACTCCGCAAAGTCTAAG-3’ for TNF-α; 5’-GCCCATCCTCTGTGACTCAT-3’ and 5’-AGGCCACAGGTATTTTGTCG-3’ for IL-1β; 5’ -TTAAAAACCTGTATCGGAACCAA-3’ and 5’-GCATTAGCTTCAGATTTACGGGT-3’ for MCP1; 5’- ATGAACGCTACACACTGCATC-3’ and 5’-CCATC CTTTTGCCAGTTCCTC-3’ for IFN-γ; 5’-CTGGAGCAGCTGAATGGAAAG-3’ and 5’-TCTCCGTCATCTCATAGGGA-3’ for IFN-β; 5’-TGTCCGTCGTGGATCTGAC-3’ and 5’-CCTGCTTCACCACCTTCTTG-3’ for GAPDH. Fold-changes were calculated by using the ΔΔCT method and the experiments repeated at least three times.
Nitrite quantification
The production of NO was determined through the quantification of nitrite from the spontaneous oxidation of NO in media after 24 h. Accumulated nitrite was quantified using a colorimetric reaction with Griess reagent, and the absorbance for which was measured at 570 nm by a microplate reader (Spectra Max 190, Molecular Devices).
Cell death assay
Cell death was measured by the activity of lactate dehydrogenase (LDH) released to the culture medium, using a LDH assay kit (Roche Diagnostics Corporation) by following the manufacturer’s instructions. Culture media were collected 24 h after LPS and rapamycin treatment. The absorbance of the samples was measured at 492 nm by a microplate reader (Spectra Max 190, Molecular Devices).
Mice and stereotaxic injection of LPS
Male C57BL/6J mice at 8-12-weeks-old which had been raised in our laboratory were used for this experiment. Mice were housed in a temperature- (23℃) and humidity-(45-55%) controlled environment with a 12/12 h dark-light cycle (lights on 7:00 A.M and off on 7:00 P.M.). Stereotaxic injection was performed as described previously (Han et al., 2010). Mice were anesthetized with ketamine (100 mg/kg body weight) and xylazine hydrochloride (13 mg/kg body weight). The head of each mouse was secured in a Benchmark stereotaxic instrument (Coretech Holdings Company, St. Louis, MO, USA). LPS (1 μg in 3 μl) was unilaterally injected at the prefrontal cortex near the dorsal striatum (AP: +1.0, ML: +-1.5 mm, DV: -3.6 mm) at the speed of 0.5 μl/min. After surgery, mice were placed on a warm plate (37℃) and then individually housed in normal plastic cages, and after 24 h, they were sacrificed.
Immunohistochemistry
Brain tissue was fixed in 4% paraformaldehyde solution and sectioned to a thickness of 40 μm by using vitratom. Free-floating serial sections were rinsed three times for 10 min in PBS and then pretreated for 30 min in PBS containing 3% H2O2. The sections were then rinsed in PBS containing 0.1% triton X-100, and incubated for 1 h at room temperature in PBS containing 2% BSA and 2% horse serum. Next, the sections were incubated overnight at 4℃ with PBS containing 2% BSA, 2% horse serum and the following primary antibodies: IL6 (1:200; Biolegend, San Diego, California, USA), iNOS (1:1,000; Transduction Laboratory, San Diego, California, USA), and Iba1 (1:1000; Wako, Osaka, Japan). The sections were then washed by PBST and incubated by biotin-conjugated secondary antibodies (1:200; Vector Laboratories). Sections were incubated for 1 h in avidin-biotin complex solution (Vector Laboratories). After washing, the signal was detected by incubating sections in 0.5 mg/ml 3,3’ diaminobenzidine in PBS containing 0.3% H2O2. Sections mounted on gelatin-coated slides, and viewed under a bright-field microscope (Olympus).
Statistical analysis
Two-sample comparisons were carried out using the Student’s t-test, while multiple comparisons were made using one-way ANOVA followed by post-hoc tests to compare selected pairs of data. SPSS 16.0 (SPSS Inc., Chicago, IL, USA) were used to perform statistical analyses. All data are presented as the mean ± S.E.M., and statistical differences were accepted at the 5% level.
RESULTS
BV2 microglia cells have the functional classical autophagy pathway
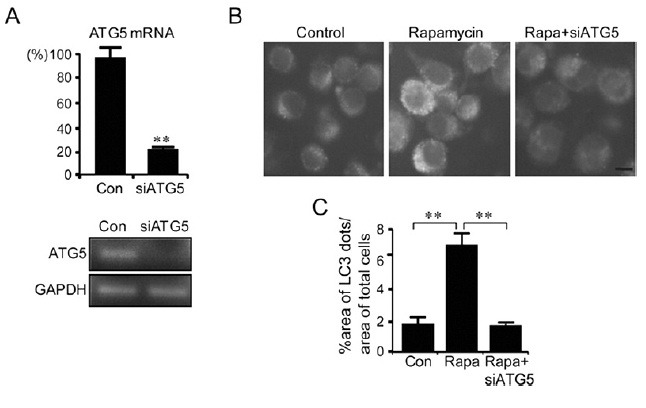
To understand the mechanism of autophagy in microglia, BV2 microglia cells were treated with rapamycin, which is a classic autophagy inducer. Incubation of BV2 cells with rapamycin (100 nM) for 6 h led to the redistribution of microtubule-associated protein light-chain 3 (LC3/Atg8) from the diffused pattern to punctuated patterns, forming typical autophagosome-like dots. The autophagosome-like dots were visualized by staining with anti-LC3 antibody on a confocal microscopic field (Fig. 1A). Western blot analysis also confirmed that rapamycin treatment increased the level of LC3 type II, an indicator of autophagosome formation (Nakagawa et al., 2004) (Fig. 1B). A computer-aid image analysis led to the confirmation that the formation of anti-LC3-labeled autophagosome-like dots was increased after treatment with rapamycin (Fig. 1C). Consistent with these results, rapamycin treatment of the BV2-LC3 stable cells, which were established in the present study by transfection with EGFP-LC3 plasmid and a subsequent clonal selection, showed enhanced formation of EGFP-LC3-labeled dots (Fig. 1D). When BV2 cells were transfected with siRNA-ATG5 to block the autophagy pathway, the formation of rapamycin-induced EGFP-LC3-labeled dots was completely suppressed (Fig. 2). Together, these results indicate that BV2 microglia cells have an active classical autophagy system.
Fig. 1. Rapamycin treatment induced activation of the autophagy process in BV2 microglia cells. (A) Confocal microscopic images showing the formation of anti-LC-labeled dots in rapamycin-stimulated BV2 cells. Cells were treated with rapamycin (100 nM) for 6 h and were stained with anti-LC3 antibody. (B) Western blots showing rapamycin-dependent increase of the ratio of LC3-II/LC3-I and their quantified data. Western blot analysis was performed 6 h after treatment with rapamycin using anti-LC3 antibody. The concentration of rapamycin was 10 or 100 nM. The band intensity of LC3-II and LC3-I was measured by a densitometer. The graph represented the ratio of LC3-II/LC3-I. (C) Representative fluoresence microscopic images showing anti-LC3-labeled dots in BV2 cells before and after treatment with rapamycin (100 nM) and their quantified data. The percentage of total LC3-dot area per total cell area was quantified using by an image analysis program described in Materials and Methods. (D) Representative fluorescence microscopic images showing the distribution of GFP-LC3 in BV2-LC3 stable cells after treatment with rapamycin. The percent area of GFP-LC3 fluorescence dots per total cell area was quantified 6 h after treatment with rapamycin (100 nM). Data are presented as the means ± SEM. ** denotes difference between control cells and rapamycin treated cells at p<0.01. Scale bar; 10 μm.
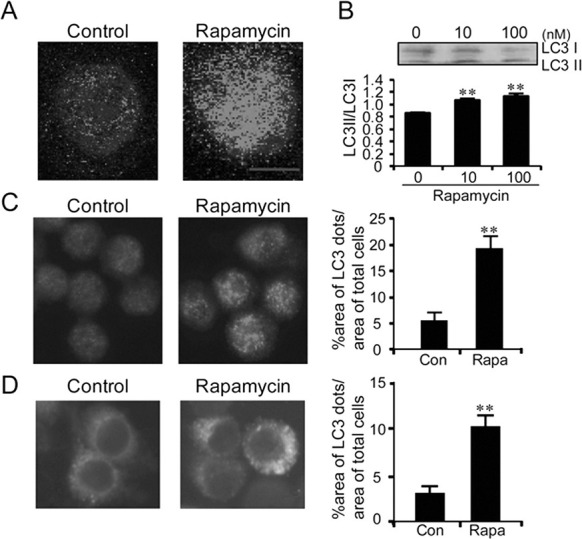
Fig. 2. Rapamycin-induced autophagy-like dots in BV2 cells were suppressed by siRNA-ATG5. (A) Real-time PCR data showing the inhibition of the ATG5 gene expression in BV2 cells transfected with siRNA-ATG5. The expression levels of ATG5 were examined 24 h after transfection with siRNA-ATG5. The PCR products were also visualized on agarose gel. (B, C) Representative fluorescence microscopic images showing GFP-LC3-labeled dots in control BV2-LC3-stable cells (Control), BV2-LC3-stable cells treated with rapamycin (100 nM), and BV2-LC3-stable cells treated with rapamycin and siRNA-ATG5 (Rapa+siATG5). siRNA-ATG5 was transfected 24 h prior to rapamycin treatment. Quantified areas of GFP-LC3-labeled dots are presented (C). The percent area of GFP-LC3 fluorescence dots was quantified 6 h after rapamycin treatment (100 nM). Data are presented as the means ± SEM. ** denotes difference between indicated groups at p<0.01.
LPS-activated BV2 microglia cells produced LC3-labeled dots, which were distinct from the classical autophagic machinery
Next, we investigated the role of the autophagy pathway in BV2 cells which were activated with lipopolysaccharide (LPS), a strong activator of microglia cells. LPS treatment increased the levels of anti-LC3-labeled dots in BV2 cells (Fig. 3A, B) and also EGFP-LC3-labeled dots in BV2-LC3 stable cells (Fig. 3C). The formation of EGFP-LC3-labeled dots in LPS-stimulated BV2-LC3 stable cells increased in a time-dependent manner, peaking after 4 h (Fig. 3D). However, LPS-induced EGFP-LC3-labeled dots in BV2-LC3 stable cells were not suppressed by siRNA-ATG5 (Fig. 3E, 3F), nor by ‘wortmannin’- a compound that prevents autophagosomes formation by inhibiting the PI3K pathway. Further analysis revealed that co-treatment of BV2 cells with LPS and rapamycin doubled the level of anti-LC3-labeled dots induced by LPS alone (Fig. 3G, 3H). These results suggest that LPS-activated microglia express the formation of LC3-labeled dots, but the LC3-labeled dots are distinct from the typical autophagosomes.
Fig. 3. LPS-induced activation of microglia expressed aggresome-like LC3-labeled dots. (A) Confocal microscopic immunofluosence images (top panels) showing anti-LC3-labeled dots in BV2 cells after stimulation with LPS. Anti-LC3 immunofluosence images were overlayed onto phase-contrast microscopic images (bottom panels). LPS (100 ng/ml) was treated for 6 h. (B) Representative fluoresence microscopic images showing anti-LC3-labeled dots in BV2 cells after treatment with LPS (100 ng/ml) and their quantified data. The total LC3-labled dot area per total cell area was quantified using by an image analysis program. (C) Representative fluorescence microscopic images showing the distribution of GFP-LC3-labeled dots in BV2-LC3 stable cells after treatment with LPS (100 ng/ml). The percent area of GFP-LC3 fluorescence dots was quantified 6 h after treatment with LPS. (D) Time-dependent increase and saturation in the formation of GFP-LC3-labeled dots in LPS-stimulated BV2-LC3 stable cells. Cells were incubated in LPS (100 ng/ml) for the indicated time. The percentage of total LC3-dot area was quantified with respect to total cell areas. (E, F) LPS-induced GFP-LC3-labeled dots in BV2-LC3 stable cells were not suppressed by siRNA-ATG5 (E) or wortmanin (F). siRNA-ATG5 was transfected 24 h prior to treatment of LPS or wortmanin. LPS (100 ng/ml) and wortmannin (200 nM) were treated for 6 h. The percentage of the LC3-dot area per total cell area is presented. (G, H) LPS and rapamycin independently increased GFP-LC3-labeled dots in BV2 cells treated with LPS, LPS+rapamycin, orLPS+siRNA-ATG5. LPS (100 ng/ml) or rapamycin (100 nM) was treated for 6 h. siRNA-ATG5 was transfected 24 h prior to treatment with LPS. (I-J) Real-time PCR data showing LPS-induced increase in the levels of Nrf2 (I) and p62 (J). LPS (100 ng/ml) was treated for 6 h and total RNA was harvested immediately after that. Data are presented as the means ± SEM. * and ** denote difference between indicated groups at p<0.05 and p<0.01, respectively. ns, no significant difference.
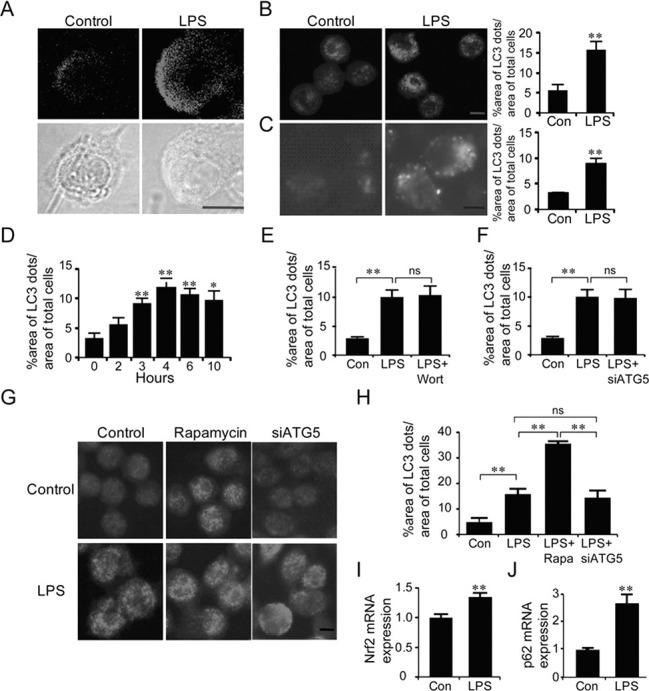
The formation of aggresome-like induced structures (ALIS) in LPS-treated macrophages, which is distinguished from the classic autophagic machinery, was regulated by the enhanced expression of Nrf2 and p62 (Fujita et al., 2011). Real-time PCR analysis showed that LPS-activated BV2 cells had the increased the expression of Nrf2 and p62 (Fig. 3I, J). Although this data alone was indirect, it also supports the possibility that LPS-activated microglia cells express LC3-labeled dots which are distinct from the classical autophagic machinery.
The autophagy pathway mitigated the pathological cellular responses of LPS-stimulated microglia
Next, we examined the expression profiles of various cytokines in LPS-activated BV2 cells. Activation of the autophagy pathway by rapamycin suppressed the levels of LPS-induced expression of iNOS, IL-6, MCP1, and IL1β, but increased the levels of LPS-induced expression of IL12, INFγ, INFβ, and TNFα (Fig. 4, Supplemental Fig. 1).
Fig. 4. LPS-induced expression of IL6 and iNOS in BV2 cells was modulated by the autophage pathway. (A, B) Real-time PCR data showing the transcription levels of iNOS (A) and IL6 (B) in BV2 cells stimulated with LPS or rapamycin. LPS (100 ng/ml) or rapamycin (100 nM) was treated for 6 h. siRNA-ATG5 was transfected 24 h prior to treatment with LPS. Data are presented as the means ± SEM. * and ** denote difference between control-LPS and indicated group at p<0.05 and p<0.01, respectively. (C) NO levels produced in BV2 cells after stimulation with LPS (100 or 1,000 ng/ml), LPS+rapamycin (100 nM), LPS+siRNA-ATG5. siRNA-ATG5 was transfected 24 h prior to treatment with LPS as above. NO levels were measured by Griess method 24 h after LPS treatment. Data are presented as the means ± SEM. # and ## denote difference between control-LPS (100 ng/ml) and indicated group at p<0.05 and p<0.01, respectively. * and ** denote difference between control-LPS (1,000 ng/ml) and indicated group at p<0.05 and p<0.01, respectively.
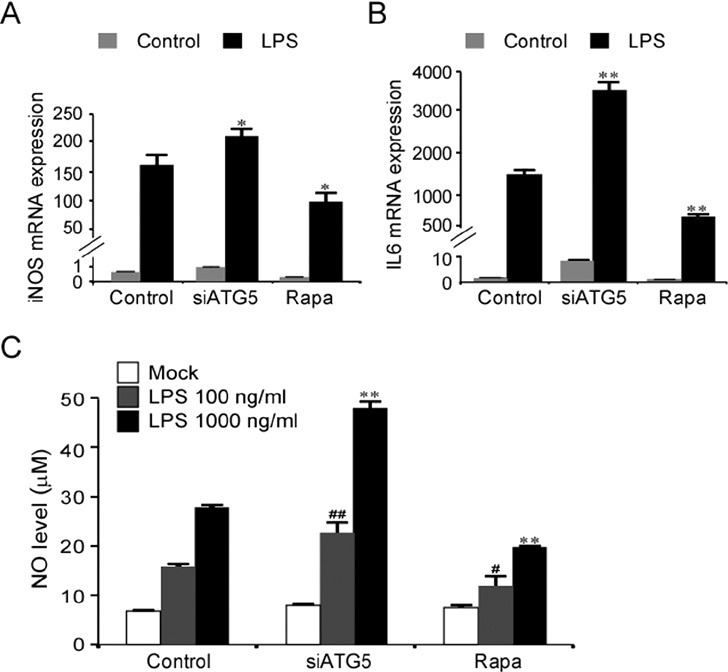
The levels of LPS-induced expression of iNOS and IL6 were increased when the autophagy pathway was blocked by siRNA-ATG5 (Fig. 4A, B). Consistent with the marked induction of iNOS expression after LPS stimulation, NO levels produced from LPS-stimulated BV2 cells were enhanced when ATG5 was repressed using siRNA-ATG5, and conversely, NO levels were partially suppressed when the autophagy pathway was activated using rapamycin (Fig. 4C).
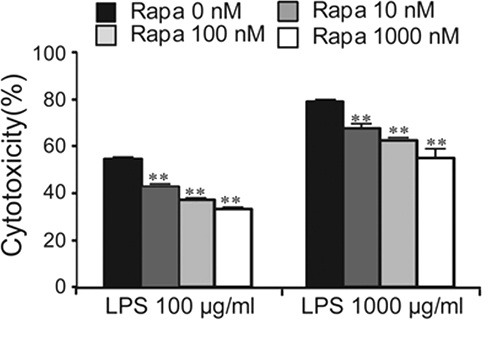
The results of the autophagy-dependent suppression of LPS-induced expression of iNOS and IL6 in BV2 cells (Fig. 4A, B), and the expression of these genes in activated microglia in the brain (Supplemental Fig. 2) led us to examine the effect of autophagy on cell death of LPS-stimulated microglia. Treatment of BV2 cells with LPS at concentrations of 100 and 1,000 μg/ml for 24 h produced 54.4% and 79% cell death, respectively, whereas the addition of rapamycin suppressed the levels of LPS-induced cell death in a dose-dependent manner (Fig. 5). These results suggest that the activation of the autophagy pathway in microglia cells confers a protective effect against the cell death of LPS-stimulated microglia.
Fig. 5. LPS-induced cytotoxicity was diminished by the activation of the autophagy pathway. The cell death levels of BV2 cells in response to LPS in the presence of varying doses of rapamycin. Rapamycin suppressed the LPS-induced cytotoxicity in a dose-dependent manner. LPS (100 or 1,000 μg/ml) and rapamycin (10, 100, or 1,000 nM) were treated for 24 h. Cell death was measured by LDH assay. Data are presented as the means ± SEM. ** denotes difference between control and indicated group at each LPS dose (LPS, 100 or 1,000 μg/ml alone) at p<0.01.
DISCUSSION
In the present study, we demonstrated that treatment of microglia cells with rapamycin led to form LC3-labeled dots, and that the formation of LC3-labeled dots was blocked by siRNA-ATG5, indicating that microglia actively express the typical autophagy pathway described in other cell types (Akar et al., 2008; Yuan et al., 2012). When activated by LPS, microglia also expressed LC3-labeled dots. However, the formation of LPS-induced LC3-labeled dots was not blocked by siRNA-ATG5, suggesting that LPS-induced LC3-labeled dots have differentiating features from the classic autophagic mechanism.
We speculate that LC3-labeled dots formed in LPS-stimulated BV2 cells have a similarity to ALIS (aggresome-like induced structures) described in macrophages (Szeto et al., 2006; Fujita et al., 2011) and DALIS (dendritic cell aggresome-like induced structures) in dendritic cells (Lelouard et al., 2002; Lelouard et al., 2004; Canadien et al., 2005). The activation of TLR receptors (Lu et al., 2008) by LPS promoted autophagy process in macrophages (Xu et al., 2007; Shi and Kehrl, 2008). LPS-stimulated macrophages expressed ALIS, which appeared with LC3-labeled dot-like structure. However, ALIS was not advanced to the stage of lysosomal degradation, thus making a distinction between ALIS and classical autophagosomes. ALIS formation in LPS-stimulated macrophages was regulated by the increased expression of Nfr2 and p62 (Fujita et al., 2011). Similar to ALIS in LPS-stimulated macrophages, LPS-stimulated BV2 cells expressed the formation of a non-classical type LC3-labeled dots (Fig. 3A-G), and showed increased expression of Nfr2 and p62 (Fig. 3I, 3J). The DALIS in dendritic cells functions as a compartment for the sequestration of misfolded proteins. In LPS-stimulated dendritic cells, DALIS appeared at 4 h after LPS stimulation, reaching its peak at 8 h, and diminished (Lelouard et al., 2002). The DALIS formation was prevented by the inhibition of new protein synthesis, whereas abnormal protein synthesis was found to enhance DALIS (Lelouard et al., 2002; Lelouard et al., 2004). ALIS formation in LPS-stimulated macrophages steadily increased up to 24 h, whereas LPS-induced LC3-dot formation in BV2 microglia cells peaked at 4 h and thereafter slowly decreased. These results suggest that the time course of LPS-induced LC3-dot formation in microglia was more similar to DALIS in dendritic cells than to ALIS in macrophages, although the specific mechanism of its action remains unknown.
Autophagy has been suggested to be a neuroprotective mechanism due to its role in the clearance of harmful protein aggregates and organelles in the brain (Ravikumar et al., 2004; Sarkar and Rubinsztein, 2008). In particular, rapamycin was helpful for HIV dementia through the stimulation of autophagy (Alirezaei et al., 2008). In the present study, we demonstrated that autophagy blockage by siRNA-ATG5 increased the expression of IL6 and iNOS in LPS-treated microglia, whereas autophagy induction with rapamycin decreased the expression of these genes (Fig. 3). Furthermore, autophagy induction with rapamycin decreased cell death of LPS-treated microglia (Fig. 4). Thus, our results support the notion that the activation of the autophagy pathway aids LPS-stimulated microglia cells in protecting against the cell death, probably through reducing the production of iNOS and IL6. Inducible NOS is an enzyme that produces toxic levels of nitric oxide (NO) (Gross and Wolin, 1995). NO produced by iNOS aggravates LPS and interferon-γ triggered cell death in N9 microglial cells and primary microglia cells (Mayo and Stein, 2007). Inhibition of iNOS using aminoguanidine had beneficial effects in the brain with focal cerebral ischemic damage in rats (Zhang et al., 1996; Kim and Lee, 2007) and in the MPTP model of Parkinson disease (Wu et al., 2002). The susceptibility to cerebral ischemia also was decreased in mice lacking iNOS (Iadecola et al., 1997). The increased IL-6 contributes to behavioral deficits and neuronal loss in i.p injection of LPS model (Semmler et al., 2007) and in Alzheimer’s model (Strauss et al., 1992; Akiyama et al., 2000; Eriksson et al., 2011). These results suggest that regulation of iNOS and IL6 production by the regulation of the autophagy pathway will be a valuable strategy to protect the brain in pathological states.
Acknowledgments
This work was supported by grant (20110027540, 2012K001117) from the National Research Foundation, Ministry of Science and Technology, Republic of Korea.
References
- 1.Akar U., Chaves-Reyez A., Barria M., Tari A., Sanguino A., Kondo Y., Kondo S., Arun B., Lopez-Berestein G., Ozpolat B. Silencing of Bcl-2 expression by small interfering RNA induces autophagic cell death in MCF-7 breast cancer cells. Autophagy. (2008);4:669–679. doi: 10.4161/auto.6083. [DOI] [PubMed] [Google Scholar]
- 2.Akiyama H., Barger S., Barnum S., Bradt B., Bauer J., Cole G. M., Cooper N. R., Eikelenboom P., Emmerling M., Fiebich B.L., Finch C. E., Frautschy S., Griffin W. S., Hampel H., Hull M., Landreth G., Lue L., Mrak R., Mackenzie I. R., McGeer P. L., O'Banion M. K., Pachter J., Pasinetti G., Plata-Salaman C., Rogers J., Rydel R., Shen Y., Streit W., Strohmeyer R., Tooyoma I., Van Muiswinkel F. L., Veerhuis R., Walker D., Webster S., Wegrzyniak B., Wenk G., Wyss-Coray T. Inflammation and Alzheimer's disease. Neurobiol. Aging. (2000);2:383–421. doi: 10.1016/s0197-4580(00)00124-x. [DOI] [PMC free article] [PubMed] [Google Scholar]
- 3.Alirezaei M., Kiosses W. B., Fox H. S. Decreased neuronal autophagy in HIV dementia: a mechanism of indirect neurotoxicity. Autophagy. (2008);4:963–966. doi: 10.4161/auto.6805. [DOI] [PMC free article] [PubMed] [Google Scholar]
- 4.Beurel E., Jope R. S. Lipopolysaccharide-induced interleukin-6 production is controlled by glycogen synthase kinase-3 and STAT3 in the brain. J. Neuroinflammation. (2009);6:9. doi: 10.1186/1742-2094-6-9. [DOI] [PMC free article] [PubMed] [Google Scholar]
- 5.Canadien V., Tan T., Zilber R., Szeto J., Perrin A. J., Brumell J. H. Cutting edge: microbial products elicit formation of dendritic cell aggresome-like induced structures in macrophages. J. Immunol. (2005);174:2471–2475. doi: 10.4049/jimmunol.174.5.2471. [DOI] [PubMed] [Google Scholar]
- 6.Eriksson U. K., Pedersen N. L., Reynolds C. A., Hong M. G., Prince J. A., Gatz M., Dickman P. W., Bennet A. M. Associations of gene sequence variation and serum levels of C-reactive protein and interleukin-6 with Alzheimer's diseaseand dementia. J. Alzheimers Dis. (2011);23:361–369. doi: 10.3233/JAD-2010-101671. [DOI] [PMC free article] [PubMed] [Google Scholar]
- 7.Fujita K., Maeda D., Xiao Q., Srinivasula S. M. Nrf2-mediated induction of p62 controls Toll-like receptor-4-driven aggresome-like induced structure formation and autophagic degradation. Proc. Natl. Acad. Sci. USA. (2011);108:1427–1432. doi: 10.1073/pnas.1014156108. [DOI] [PMC free article] [PubMed] [Google Scholar]
- 8.Gehrmann J., Matsumoto Y., Kreutzberg G. W. Microglia: intrinsic immuneffector cell of the brain. Brain Res. Rev. (1995);20:269–287. doi: 10.1016/0165-0173(94)00015-h. [DOI] [PubMed] [Google Scholar]
- 9.Gross S. S., Wolin M. S. Nitric oxide: pathophysiological mechanisms. Annu. Rev. Physiol. (1995);57:737–769. doi: 10.1146/annurev.ph.57.030195.003513. [DOI] [PubMed] [Google Scholar]
- 10.Han H. E., Sellamuthu S, Shin B.H., Lee Y.J., Song S., Seo J. S., Beak I. S., Bae J., Kim H., Yoo Y. J., Jung Y. K., Song W. K., Han P. L., Park W. J. The nuclear inclusion a (NIa) protease of turnip mosaic virus (TuMV) cleaves amyloid-β. PLoS One. (2010);5:e15645. doi: 10.1371/journal.pone.0015645. [DOI] [PMC free article] [PubMed] [Google Scholar]
- 11.Hanisch U. K. Microglia as a source and target of cytokines. Glia. (2002);40:140–155. doi: 10.1002/glia.10161. [DOI] [PubMed] [Google Scholar]
- 12.Henkel J. S., Beers D. R., Zhao W., Appel S. H. Microglia in ALS: the good, the bad, and the resting. J. Neuroimmune Pharmacol. (2009);4:389–398. doi: 10.1007/s11481-009-9171-5. [DOI] [PubMed] [Google Scholar]
- 13.Iadecola C., Zhang F., Casey R., Nagayama M., Ross M. E. Delayed reduction of ischemic brain injury and neurological deficits in mice lacking the inducible nitric oxide synthase gene. J. Neurosci. (1997);17:9157–9164. doi: 10.1523/JNEUROSCI.17-23-09157.1997. [DOI] [PMC free article] [PubMed] [Google Scholar]
- 14.Im J. Y., Joo H. J., Han P. L. Rapid disruption of cellular integrity of Zinc-treated astroglia is regulated by p38MAPK and Ca2+-dependentmechanisms. Exp. Neurobiol. (2011);20:45–53. doi: 10.5607/en.2011.20.1.45. [DOI] [PMC free article] [PubMed] [Google Scholar]
- 15.Kabeya Y., Mizushima N., Ueno T., Yamamoto A., Kirisako T., Noda T., Kominami E., Ohsumi Y., Yoshimori T. LC3, a mammalian homologue of yeast Apg8p, is localized in autophagosome membranes after processing. EMBO J. (2000);19:5720–5728. doi: 10.1093/emboj/19.21.5720. [DOI] [PMC free article] [PubMed] [Google Scholar]
- 16.Kim S. W., Lee J. K. NO-induced downregulation of HSP10 and HSP60 expression in the postischemic brain. J. Neurosci. Res. (2007);85:1252–1259. doi: 10.1002/jnr.21236. [DOI] [PubMed] [Google Scholar]
- 17.Lee J., Kim H. R., Quinley C., Kim J., Gonzalez-Navajas J., Xavier R., Raz E. Autophagy suppresses interleukin-1β (IL-1β) signaling by activation of p62 degradation via lysosomal and proteasomal pathways. J. Biol. Chem. (2012);287:4033–4040. doi: 10.1074/jbc.M111.280065. [DOI] [PMC free article] [PubMed] [Google Scholar]
- 18.Lee J. H., Yu W. H., Kumar A., Lee S., Mohan P. S., Peterhoff C. M., Wolfe D. M., Martinez-Vicente M., Massey A. C., Sovak G., Uchiyama Y., Westaway D., Cuervo A. M., Nixon R. A. Lysosomal proteolysis and autophagy require presenilin 1 and are disrupted by Alzheimer-related PS1 mutations. Cell. (2010);141:1146–1158. doi: 10.1016/j.cell.2010.05.008. [DOI] [PMC free article] [PubMed] [Google Scholar]
- 19.Lelouard H., Ferrand V., Marguet D., Bania J., Camosseto V., David A., Gatti E., Pierre P. Dendritic cell aggresome-like induced structures are dedicated areas for ubiquitination and storage of newly synthesized defective proteins. J. Cell Biol. (2004);164:667–675. doi: 10.1083/jcb.200312073. [DOI] [PMC free article] [PubMed] [Google Scholar]
- 20.Lelouard H., Gatti E., Cappello F., Gresser O., Camosseto V., Pierre P. Transient aggregation of ubiquitinated proteins during dendritic cell maturation. Nature. (2002);417:177–182. doi: 10.1038/417177a. [DOI] [PubMed] [Google Scholar]
- 21.Levine B., Klionsky D. J. Development by self-digestion: molecular mechanisms and biological functions of autophagy. Dev. Cell. (2004);6:463–477. doi: 10.1016/s1534-5807(04)00099-1. [DOI] [PubMed] [Google Scholar]
- 22.Lu Y. C., Yeh W. C., Ohashi P. S. LPS/TLR4 signal transduction pathway. Cytokine. (2008);42:145–151. doi: 10.1016/j.cyto.2008.01.006. [DOI] [PubMed] [Google Scholar]
- 23.Magazine H. I., Liu Y., Bilfinger T. V., Fricchione G. L., Stefano G. B. Morphine-induced conformational changes in human monocytes, granulocytes, and endothelial cells and in invertebrate immunocytes and microglia are mediated by nitric oxide. J. Immunol. (1996);156:4845–4850. [PubMed] [Google Scholar]
- 24.Matsumoto Y., Ohmori K., Fujiwara M. Microglial and astroglial reactions to inflammatory lesions of experimental autoimmune encephalomyelitis in the rat central nervous system. J. Neuroimmunol. (1992);37:23–33. doi: 10.1016/0165-5728(92)90152-b. [DOI] [PubMed] [Google Scholar]
- 25.Mayo L., Stein R. Characterization of LPS and interferon-gamma triggered activation-induced cell death in N9 and primary microglial cells: induction of the mitochondrial gateway by nitric oxide. Cell Death Differ. (2007);14:183–186. doi: 10.1038/sj.cdd.4401989. [DOI] [PubMed] [Google Scholar]
- 26.McGeer P. L., Itagaki S., Boyes B. E., McGeer E. G. Reactive microglia are positive for HLA-DR in the substantia nigra of Parkinson'sand Alzheimer's disease brains. Neurology. (1988);38:1285–1291. doi: 10.1212/wnl.38.8.1285. [DOI] [PubMed] [Google Scholar]
- 27.Nakagawa I., Amano A., Mizushima N., Yamamoto A., Yamaguchi H., Kamimoto T., Nara A., Funao J., Nakata M., Tsuda K., Hamada S., Yoshimori T. Autophagy defends cells against invading group A Streptococcus. Science. (2004);306:1037–1040. doi: 10.1126/science.1103966. [DOI] [PubMed] [Google Scholar]
- 28.Nakahira K., Haspel J. A., Rathinam V. A., Lee S. J., Dolinay T., Lam H. C., Englert J. A., Rabinovitch M., Cernadas M., Kim H. P., Fitzgerald K. A., Ryter S. W., Choi A. M. Autophagy proteins regulate innate immune responses by inhibiting the release of mitochondrial DNA mediated by the NALP3 inflammasome. Nat. Immunol. (2011);12:222–230. doi: 10.1038/ni.1980. [DOI] [PMC free article] [PubMed] [Google Scholar]
- 29.Nixon R. A., Yang D. S. Autophagy failure in Alzheimer's disease--locating the primary defect. robiol. Dis. (2011);43:38–45. doi: 10.1016/j.nbd.2011.01.021. [DOI] [PMC free article] [PubMed] [Google Scholar]
- 30.Perry V. H., Nicoll J. A., Holmes C. Microglia in neurodegenerative disease. Nat. Rev. Neurol. (2010);6:193–201. doi: 10.1038/nrneurol.2010.17. [DOI] [PubMed] [Google Scholar]
- 31.Raine C. S. Multiple sclerosis: immune system molecule expression in the central nervous system. J. Neuropathol. Exp. Neurol. (1994);53:328–337. doi: 10.1097/00005072-199407000-00002. [DOI] [PubMed] [Google Scholar]
- 32.Ravikumar B., Vacher C., Berger Z., Davies J. E., Luo S., Oroz L. G., Scaravilli F., Easton D. F., Duden R., O'Kane C. J., Rubinsztein D. C. Inhibition of mTOR induces autophagy and reduces toxicity of polyglutamine expansions in fly and mouse models of Huntington disease. Nat. Genet. (2004);36:585–595. doi: 10.1038/ng1362. [DOI] [PubMed] [Google Scholar]
- 33.Rosello A., Warnes G., Meier U. C. Cell death pathways and autophagy in the central nervous system and its involvement in neurodegeneration, immunity and central nervous system infection: to die or not to die--that is the question. Clin. Exp. Immunol. (2012);168:52–57. doi: 10.1111/j.1365-2249.2011.04544.x. [DOI] [PMC free article] [PubMed] [Google Scholar]
- 34.Saitoh T., Fujita N., Jang M. H., Uematsu S., Yang B. G., Satoh T., Omori H., Noda T., Yamamoto N., Komatsu M., Tanaka K., Kawai T., Tsujimura T., Takeuchi O., Yoshimori T., Akira S. Loss of the autophagy protein Atg16L1 enhances endotoxin-induced IL-1beta production. Nature. (2008);456:264–268. doi: 10.1038/nature07383. [DOI] [PubMed] [Google Scholar]
- 35.Sarkar S., Rubinsztein D. C. Small molecule enhancers of autophagy for neurodegenerative diseases. Mol. Biosyst. (2008);4:895–901. doi: 10.1039/b804606a. [DOI] [PubMed] [Google Scholar]
- 36.Semmler A., Frisch C., Debeir T., Ramanathan M., Okulla T., Klockgether T., Heneka M. T. Long-term cognitive impairment, neuronal loss and reduced cortical cholinergic innervation after recovery from sepsis in a rodent model. Exp. Neurol. (2007);204:733–740. doi: 10.1016/j.expneurol.2007.01.003. [DOI] [PubMed] [Google Scholar]
- 37.Shi C. S., Kehrl J. H. MyD88 and Trif target Beclin 1 to trigger autophagy in macrophages. J. Biol. Chem. (2008);283:33175–33182. doi: 10.1074/jbc.M804478200. [DOI] [PMC free article] [PubMed] [Google Scholar]
- 38.Sims K., Haynes C. A., Kelly S., Allegood J. C., Wang E., Momin A., Leipelt M., Reichart D., Glass C. K., Sullards M. C., Merrill A. H. Jr. Kdo2-lipid A, a TLR4-specific agonist, induces de novo sphingolipid biosynthesis in RAW264.7 macrophages, which is essential for induction of autophagy. J. Biol. Chem. (2010);285:38568–38579. doi: 10.1074/jbc.M110.170621. [DOI] [PMC free article] [PubMed] [Google Scholar]
- 39.Singh S. B., Davis A. S., Taylor G. A., Deretic V. Human IRGM induces autophagy to eliminate intracellular mycobacteria. Science. (2006);313:1438–1441. doi: 10.1126/science.1129577. [DOI] [PubMed] [Google Scholar]
- 40.Smith J. A., Das A., Ray S. K., Banik N. L. Role of pro-inflammatory cytokines released from microglia in neurodegenerative diseases. Brain Res. Bull. (2012);87:10–20. doi: 10.1016/j.brainresbull.2011.10.004. [DOI] [PMC free article] [PubMed] [Google Scholar]
- 41.Strauss S., Bauer J., Ganter U., Jonas U., Berger M., Volk B. Detection of interleukin-6 and alpha 2-macroglobulin immunoreactivity in cortex and hippocampus of Alzheimer's diseasepatients. Lab. Invest. (1992);66:223–230. [PubMed] [Google Scholar]
- 42.Szeto J., Kaniuk N. A., Canadien V., Nisman R., Mizushima N., Yoshimori T., Bazett-Jones D. P., Brumell J. H. ALIS are stress-induced protein storage compartments for substrates of the proteasome and autophagy. Autophagy. (2006);2:189–199. doi: 10.4161/auto.2731. [DOI] [PubMed] [Google Scholar]
- 43.Virgin H. W., Levine B. Autophagy genes in immunity. Nat. Immunol. (2009);10:461–470. doi: 10.1038/ni.1726. [DOI] [PMC free article] [PubMed] [Google Scholar]
- 44.Wu D. C., Jackson-Lewis V., Vila M., Tieu K., Teismann P., Vadseth C., Choi D. K., Ischiropoulos H., Przedborski S. Blockade of microglial activation is neuroprotective in the 1-methyl-4-phenyl-1,2,3,6-tetrahydropyridine mouse model of Parkinson disease. J. Neurosci. (2002);22:1763–1771. doi: 10.1523/JNEUROSCI.22-05-01763.2002. [DOI] [PMC free article] [PubMed] [Google Scholar]
- 45.Xu Y., Jagannath C., Liu X. D., Sharafkhaneh A., Kolodziejska K. E., Eissa N. T. Toll-like receptor 4 is a sensor for autophagy associated with innate immunity. Immunity. (2007);27:135–144. doi: 10.1016/j.immuni.2007.05.022. [DOI] [PMC free article] [PubMed] [Google Scholar]
- 46.Yu Y. M., Kim J. B., Lee K. W., Kim S. Y., Han P. L., Lee J. K. Inhibition of the cerebral ischemic injury by ethyl pyruvate with a wide therapeutic window. Stroke. (2005);36:2238–2243. doi: 10.1161/01.STR.0000181779.83472.35. [DOI] [PubMed] [Google Scholar]
- 47.Yuan K., Huang C., Fox J., Laturnus D., Carlson E., Zhang B., Yin Q., Gao H., Wu M. Autophagy plays an essential role in the clearance of Pseudomonas aeruginosa by alveolar macrophages. J. Cell Sci. (2012);125:507–515. doi: 10.1242/jcs.094573. [DOI] [PMC free article] [PubMed] [Google Scholar]
- 48.Zhang F., Casey R. M., Ross M. E., Iadecola C. Aminoguanidine ameliorates and L-arginine worsens brain damage from intraluminal middle cerebral artery occlusion. Stroke. (1996);27:317–323. doi: 10.1161/01.str.27.2.317. [DOI] [PubMed] [Google Scholar]
- 49.Zoncu R., Efeyan A., Sabatini D. M. mTOR: from growth signal integration to cancer, diabetes and ageing. Nature Rev. Mol. Cell Biol. (2011);12:21–35. doi: 10.1038/nrm3025. [DOI] [PMC free article] [PubMed] [Google Scholar]