

Abstract
The structural and functional analysis of the core protein of hepatitis B virus is important for a full understanding of the viral life cycle and the development of novel therapeutic agents. The majority of the core protein (CP149) comprises the capsid assembly domain, and the C-terminal region (residues 150–183) is responsible for nucleic acid binding. Protein monomers associate to form dimeric structural subunits, and helices 3 and 4 (residues 50–111 of the assembly domain) have been shown to be important for this as they constitute the interdimer interface. Here, using mass spectrometry coupled with ion mobility spectrometry, we demonstrate the conformational flexibility of the CP149 dimer. Limited proteolysis was used to locate involvement in this feature to the C-terminal region. A genetically fused CP dimer was found to show decreased disorder, consistent with a more restricted C-terminus at the fusion junction. Incubation of CP149 dimer with heteroaryldihydropyrimidine-1, a small molecule known to interfere with the assembly process, was shown to result in oligomers different in shape to the capsid assembly-competent oligomers of the fused CP dimer. We suggest that heteroaryldihydropyrimidine-1 affects the dynamics of CP149 dimer in solution, likely affecting the ratio between assembly active and inactive states. Therefore, assembly of the less dynamic fused dimer is less readily misdirected by heteroaryldihydropyrimidine-1. These studies of the flexibility and oligomerization properties of hepatitis B virus core protein illustrate both the importance of C-terminal dynamics in function and the utility of gas-phase techniques for structural and dynamical biomolecular analysis.
Introduction
Hepatitis B virus (HBV) poses a major risk to human health, with chronic infections in excess of 350 million worldwide (1). These infections are associated with a significantly increased occurrence of hepatocellular carcinoma (2). HBV is an enveloped virus with a partially double-stranded DNA genome. The genome codes for four classes of protein: the surface antigen, the reverse transcriptase, the X protein (a transcription activator), and the capsid (core) protein (CP). A detailed understanding of the virus replication cycle would aid the development of new remedies, and one possible target for future antiviral therapy is the virus assembly process. In vivo virus assembly is initiated by the association of the pre-genomic RNA with the reverse transcriptase and core proteins and results in the formation of icosahedral nucleocapsids (3); however, the core protein has the ability to assemble spontaneously into capsid-like particles in vitro.
Recent studies conducted on the in vitro assembly of the HBV core protein have focused on the recombinant C-terminally truncated assembly domain as a model system for capsid assembly (4–7). The core protein assembly domain up to residue 149 is dimeric and has been shown to form capsids in vitro that are indistinguishable from those isolated in phosphate-buffered saline from infected patients (8). These capsids are composed of either 90 or 120 dimers each, with T = 3 or T = 4 icosahedral symmetry, respectively. Theoretical modeling of the assembly process has suggested that aggregation occurs through a kinetically limited mechanism nucleated by a trimer of dimers (6), and it has been proposed that weak cation binding induces a crucial conformational change in vitro (5). Other evidence for a nucleus composed of a trimer of dimers has come from structural studies using ion mobility spectrometry–mass spectrometry (IMS-MS) with a CP140 construct that suggested an incomplete capsid five-fold vertex as the assembly-competent conformation of this nucleus (9).
The x-ray crystal structure of the intact T = 4 capsid (10) (Fig. 1, a and b) shows the HBV core protein to be predominantly α-helical, with five helices linked by flexible loops. Helices 3 and 4 of each monomer make up the intermonomer interface, a four-helix bundle with a disulphide bond between the two Cys61 residues. The C-terminal region following helix 5 lacks structure and has high crystallographic B factors. The four conformers (A to D) are very similar and both A/B and C/D dimers have well-defined two-fold symmetry.
Figure 1.
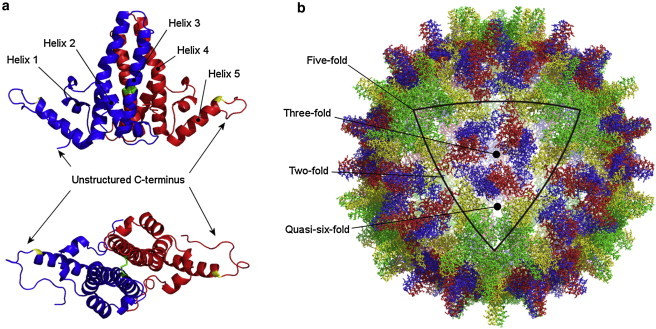
The structure of the HBV core protein (10). (a) The core protein is predominantly α-helical and exists as a dimer. Each monomer contains five helices numbered from the N- to the C-terminus, linked by loop regions. Helices 3 and 4 constitute the four-helix bundle that forms the intermonomer interface. The C-terminus is unstructured in the crystal structure and is preceded by a trypsin cleavage site at R127 (yellow). The monomers in the dimer are covalently bound through a disulphide bond between the two C61 residues (green). (b) The T = 4 capsid of HBV with each quasiequivalent conformer indicated with a different color. The color coding of conformers A (green), B (yellow), C (red), and D (blue) is consistent with that used by others (PDB ID 1QGT).
However, using x-ray crystallography an assembly-incompetent Y132A mutant has been shown to aggregate into asymmetric dimers, with the main differences in the spike regions. This has led to speculation that a conformational switch between assembly active and inactive states is key for assembly (7). NMR spectroscopy has shown the C-terminus to be subject to high picosecond dynamics, and that asymmetry is induced in the structure of the core protein on binding to anti-HBV peptides (11). In addition, kinetic hydrolysis experiments have suggested a major unfolding event in the C-terminal region in both capsid and dimer forms (12). However, the conformeric signature of wild-type HBV core protein, and any changes that may be involved in or required for the start of its assembly into capsids, has not been defined in any detail.
Noncovalent electrospray ionization–mass spectrometry (ESI-MS) is accepted as a valuable technique employed in structural biology for studying the conformational properties of proteins and the stoichiometry and dynamics of biomolecular assemblies (13,14). More recently, with the commercial introduction of integrated traveling-wave IMS-MS instrumentation (15,16), additional information describing the three-dimensional structure of biomolecules is now readily accessible (17). IMS provides structural information by measuring the time taken for ions to traverse a buffer gas-filled ion mobility cell. The arrival time observed for an ion can be used to calculate its rotationally averaged collision cross-sectional area (CCS), which is a description of the shape of the ion. Using travelling-wave IMS-MS, CCS values can be estimated after calibrating the IMS device using protein standards of known CCSs (18–20). IMS-MS has been used to study the conformational properties of both ordered (21–24) and intrinsically disordered proteins (25–30), the latter displaying a high degree of structural heterogeneity making them less tractable for analysis by established techniques such as NMR and x-ray crystallography, in addition to providing mass, stoichiometry, and low-resolution structural information for a multitude of species populated within heterogeneous systems, including viral protein complexes (31–33).
The majority of structural data on the HBV core protein has been obtained from studies of intact capsids by x-ray crystallography (7,10) and cryoelectron microscopy (34,35), and a few studies have generated data on the preassembled dimer (11,12). Here, we used noncovalent ESI-MS coupled with traveling-wave IMS to gain insights into the conformational dynamics of a dimer of the C-terminally truncated assembly domain (CP149 dimer) and the properties of capsid assembly-related and -unrelated oligomeric species. We have demonstrated the direct measurement and characterization of copopulated conformeric species of various CP149 dimers with differing extents of disorder. Limited proteolysis and comparison of CP149 dimer with a C-terminally fused CP dimer suggest that the disorder observed in the former is significant and lies within the C-termini. Furthermore, a small molecule reported elsewhere to inhibit HBV core assembly (36) has been found to induce the formation of noncapsid assembly-competent oligomers, which are shown to differ in their three-dimensional shape from assembly-competent fused CP dimer oligomers. The data not only illustrate the use of ESI-IMS-MS in characterizing protein disorder and protein complex structure, but also the importance of the CP149 C-terminus in HBV capsid dynamics, assembly, and stability.
Materials and Methods
Protein expression and purification
CP149 capsids (expressed as described previously (36)) were treated with 4 M urea and subjected to gel filtration on a sepharose S300 size exclusion column (GE Healthcare Bio-Sciences, Piscataway Township, NJ) to separate protein dimer from nondisassembled capsid. CP149 dimer was dialyzed against 50 mM ammonium acetate (pH 7.5/9.5) using Slide-a-lyzer dialysis cassettes (3,500 MWCO, ThermoPierce, Rockford, IL). Dithiothreitol (DTT) was added from a 1-M aqueous stock solution to a final concentration of 2 mM as required. The fused dimer CP was expressed and purified in a similar way to CP149.
The amino acid sequence of CP149 is as follows: MDIDPYKEFG ATVELLSFLP SDFFPSVRDL LDTASALYRE ALESPEHCSP HHTALRQAIL CWGELMTLAT WVGNNLEDPA SRDLVVNYVN TNMGLKIRQL LWFHISCLTF GRETVLEYLV SFGVWIRTPP AYRPPNAPIL STLPETTVV.
NanoESI-MS and ESI-IMS-MS of CP149 dimer
Spectra were acquired using a Synapt HDMS orthogonal acceleration quadrupole-traveling wave IMS-time-of-flight mass spectrometer (Micromass UK, Waters Corp., Manchester, UK). In-house assembled, gold-plated borosilicate vials were used for sample introduction and nanoESI. The nanoESI capillary voltage was set at 1.4 kV. Cone voltages of a maximum of 40 V were used with trap and transfer collision voltages of 6 V and 4 V, respectively. The trap flow rate was 0.1 ml min−1. The trap DC biases were 4 V in MS mode and 10 V in IMS mode. The source pressure was 2.8 mbar. All data were analyzed using the MassLynx 4.1 software package supplied with the instrument.
For measurement of the CCS of CP149 dimer, the traveling-wave IMS device was calibrated with denatured equine cytochrome c and horse heart myoglobin (10 μM, 50:40:10 MeCN/H2O/acetic acid, v/v) using CCS values determined using conventional IMS-MS and available from the database of Clemmer (www.indiana.edu/∼clemmer) (18). The traveling-wave IMS wave height and wave velocity were optimized at 10 V and 300 m s−1, respectively. CCS values were calculated from drift time measurements using the procedure outlined previously (20). The CCS values are quoted as an average of at least three measurements with errors propagated from the error in the calibration curve. Theoretical CCS values were calculated for monomeric and dimeric CP149 extracted from the Protein Data Bank (PDB) structure PDB ID 1QGT using the Leeds method (20) and MOBCAL (37) projection approximation algorithms.
Trypsin proteolysis was used to assess the dynamic nature of the CP149 dimer C-terminus. Modified porcine trypsin (sequencing grade, Promega, Madison, WI) was added to CP149 dimer to a final molar ratio of 1:35 (trypsin:dimer) in 50 mM ammonium acetate solution (pH 7.5). The mixture was incubated at 20°C (heating to 37°C would induce assembly) and the proteolysis reaction was monitored over several hours/days. Spectra were acquired under the same conditions as intact CP149 dimer. The ratios of compact to extended CP149 dimer, Δ1C, and Δ2C conformers were assessed by centering the MS spectra by peak area and summing the area for each of the charge state ions populated by the folded/compact protein ions. The charge state ions assigned as compact and extended for CP149 dimer were 9+ to 13+ and 14+ to 20+, respectively; those assigned as compact and extended for Δ1C were 9+ to 13+ and 14+ to 20+, respectively; those assigned as compact and extended for Δ2C were 8+ to 12+ and 13+ to 17+, respectively.
The fused dimer CP was dialyzed against a solution of ammonium acetate (50 mM). The pH was adjusted to 9.5 with ammonia solution to prevent neutral pH-driven protein assembly. DTT (final concentration 2 mM) was added to prevent the formation of interdimer disulphide bonds. Spectra were acquired under the same conditions as CP149 dimer to facilitate comparison of the spectra. Folded to unfolded ratios were estimated using the same method as described for CP149 dimer.
ESI-MS and ESI-IMS-MS analysis of heteroaryldihydropyrimidine-induced CP149 dimer oligomers
Heteroaryldihydropyrimidine (HAP)-1 (synthesized as described previously (36)) was added to CP149 dimer (in 50 mM ammonium acetate, pH 7.5) in various molar ratios ranging from 0.5:1 to 50:1 HAP:dimer. NanoESI-MS was conducted with a cone voltage of 80 V and trap and transfer voltages of 10 V and 20 V, respectively, optimized to increase the transmission of the oligomeric species. The capillary voltage was 1.8 kV and the source pressure was 5.8 mbar, with a trap flow rate of 5 ml min−1. For ESI-IMS-MS drift time measurements, a ramped wave height of 8–15 V and a wave velocity of 250 m s−1 were used. The trap DC bias was optimized at 20 V. The traveling-wave IMS device was calibrated using the native-like calibrants β-lactoglobulin A, avidin, concanavalin A, yeast alcohol dehydrogenase, pyruvate kinase, and glutamate dehydrogenase (all purchased from Sigma, Dorset, UK) (38). CCS values were determined as an average of at least three measurements, and errors were quoted as a standard deviation of the mean.
ESI-MS and ESI-IMS-MS of fused dimer CP149 dimer oligomers
Fused dimer CP oligomers were generated by disassembling fused dimer CP capsids using urea (4 M) at high pH (50 mM ammonium acetate, pH 9.5, 2 mM DTT), and incubating at 4°C for 16 h. The solution was then buffer-exchanged (against 50 mM ammonium acetate, pH 9.5, 2 mM DTT) to remove the urea. MS was conducted under the same conditions as the HAP-induced oligomers. Drift times were measured under the same conditions as for the HAP-induced oligomers, and the same calibrants were used.
Theoretical CCSs and modeling of CP149 oligomers
Models of CP149 oligomers were built using the Oligomer Generator functionality available on the Viper database (39). PDB file 1QGT was used to construct oligomers based around a three-fold and six-fold capsid axis. The five-fold capsid axis oligomers were not created as they are similar in shape to the six-fold models. Theoretical CCS values were calculated using the Leeds method algorithm (20).
Circular dichroism spectroscopy
Circular dichroism spectroscopy was used to study the secondary structural features of CP149 dimer and the C-terminal cleavage product Δ2C. Far-ultraviolet circular dichroism spectra were acquired between 260 and 190 nm on a J-715 spectropolarimeter (Jasco UK, Great Dunmow, UK) in triplicate and background subtracted. The background samples were ammonium acetate (50 mM, pH 7.5) or ammonium acetate with 0.2 μM trypsin for the cleavage reactions. Ellipticity was quoted in units of molar ellipticity (deg cm2 dmol−1).
Transmission electron microscopy (TEM)
Negative-stain TEM was carried out on a CM10 transmission electron microscope (Phillips, Guildford, UK) at various magnifications. Samples were mounted on hexagonal 400 mesh copper grids (Agar Scientific, Essex, UK) via a carbon film using the Valentine technique (40) and were stained with uranyl acetate (4% w/v).
Results
Observation of disorder in the CP149 dimer and monomer
CP149 dimer is known to assemble into capsids in vitro at high ionic strength, neutral to low pH, and high concentration. To characterize the protein in terms of its conformational properties, we conducted noncovalent ESI-IMS-MS on the purified CP149 dimer in solution (50 mM ammonium acetate, pH 7.5), conditions under which the C61–C61 intermonomer disulphide bond remains intact. Under these low ionic strength conditions, CP149 dimer assembles on long timescales, making it feasible to study its properties using MS experiments, which take only minutes. ESI-IMS-MS is capable of separating ions with the same mass and m/z ratio but with different shapes, allowing copopulated conformers arising from a single protein or protein complex to be separated and mass measurements and CCS estimations to be made independently on each species. The ESI-MS m/z spectrum of CP149 dimer (Fig. 2 a) displayed signals indicating a species of mass 33,702 Da, consistent with the mass of the expected sequence. The spectrum exhibited a bimodal charge state distribution centered on the 10+ and 17+ charge state ions, indicating a minimum of two conformer populations with distinct solvent-accessible surface areas, each exposing different numbers of charge-accepting basic residues. Using the formula of de la Mora (41), we expected the maximum number of charges a folded protein of this mass to carry in the gas phase would be 14+, indicating that the lower charges (9+ to 12+ ions) are consistent with a compact conformation. The higher charges (13+ to 22+ ions) suggest more extended, disordered structures, despite the analysis being carried out under solvent conditions and instrumental parameters that have been optimized and established for maintaining the noncovalent interactions involved in the tertiary and quaternary structure of proteins and biomolecular complexes intact (19,20). Varying the buffer solution conditions to assembly-unfavorable pH (pH 9.5) had no effect on the conformational characteristics of CP149 dimer (see Fig. S1 in Supporting Material).
Figure 2.
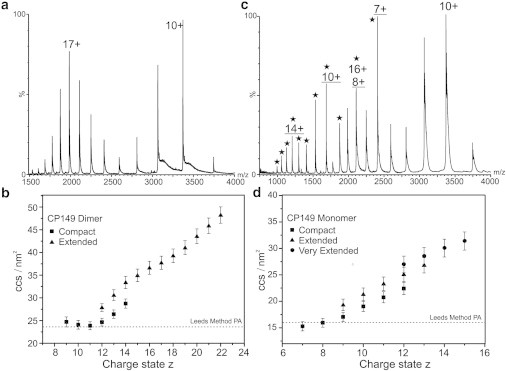
ESI-MS and ESI-IMS-MS of the CP149 dimer and monomer. (a) m/z mass spectrum of CP149 dimer in 50 mM ammonium acetate (pH 7.5). A bimodal charge state distribution, centered on the 10+ and 17+ charge states, consistent with two conformers with distinct solvent accessible surface areas is observed. (b) Charge state (z) versus CCS (nm2) plot for CP149 dimer showing the ion mobility separation of conformeric families, one compact (squares) and one extended (triangles). (c) m/z mass spectrum of CP149 dimer in 50 mM ammonium acetate (pH 7.5) with 2 mM DTT added. The charge state distribution of the dimer overlaps with monomeric ions (stars). The monomer populates three charge state distributions centered on 7+, 10+, and 14+ ions (monomer charge states underlined). (d) Charge state (z) versus CCS (nm2) plot for CP149 monomer showing the separation of three conformeric families, compact (squares), extended (triangles), and very extended (circles). Error bars indicate the standard deviation from the mean of at least three measurements.
The CCS values of these copopulated CP149 dimeric conformers were estimated from the transit times of their multiply charged ions through the IMS drift cell (Fig. 2 b). CP149 dimer was found to populate two distinct conformers, one compact and one more extended, consistent with the bimodal charge state distribution observed in the m/z spectrum (Fig. 2 a). One advantage of ESI-IMS-MS over ESI-MS alone is that the three-dimensional data provide a detailed evaluation of precisely which charge states are populated by each conformer. The compact conformer (shown as squares in Fig. 2 b) was found to populate charge states 9+ to 14+ and the extended conformer (shown as triangles in Fig. 2 b) charge states 12+ to 22+, with both conformers populating the intermediate charge states, 12+ to 14+. The CCS of the compact conformer is consistent for the four lowest charge state ions (9+ to 12+) within the accepted experimental error (i.e., 5–7% (19,20)), whereas there is some increase in CCS for the higher charge state ions (13+ and 14+, squares) arising from this conformer, likely due to Coulombic repulsion. The CCS value estimated for the lowest charge state ions of the compact conformer (9+) was 24.7 ± 1.1 nm2, which is consistent with the theoretical values of 23.3 nm2 and 24.5 nm2 calculated from the crystallographic structure of the capsid (10) using the Leeds method (20) and MOBCAL (37) projection approximation algorithms, respectively. The CCS estimations for the extended conformer increase in a linear manner as the number of charges on the ions increases, consistent with Coulombic repulsion. The CCS value of the lowest charge state ions (12+, triangles in Fig. 2 b) of the extended conformer was estimated at 27.9 ± 0.9 nm2, some 13% greater than that of the compact conformer, indicating a distinct expansion in shape and an increase in disorder.
To investigate whether the disulphide bond has any influence on the populations of these conformers or on dimer stability, we treated CP149 dimer with 2 mM dithiothreitol to reduce the intermonomer disulphide linkage. This resulted in the observation of CP149 monomer ions (7+ to 17+) in the m/z spectrum, in addition to some remaining dimer ions (Fig. 2 c). There was no evidence for any reduced CP149 dimer, indicating that the dimer dissociates on reduction of the disulphide bond. The charge state distribution of monomer ions showed the presence of three distinct, copopulated conformers centered on the 7+, 10+, and 14+ ions, suggesting one reasonably compact and two more extended structures, and indicating the dynamic nature of the CP149 monomer when not involved in dimer formation. ESI-IMS-MS separation of these monomeric conformers allowed their individual CCSs to be estimated. The conformers are labeled as compact (7+ to 12+ ions), extended (9+ to 13+ ions), and very extended (12+ to 15+ ions) structures (Fig. 2 d). The CCS value of the lowest charge state ions of the compact monomer was estimated as 15.3 ± 0.9 nm2, consistent with the calculated values obtained from the crystallographic data of the intact capsid (10) using the Leeds method and MOBCAL projection approximation algorithms (16.0 nm2 and 15.9 nm2, respectively). The CCS values of the extended and very extended conformations were estimated at 19.0 ± 1.1 nm2 and 27.1 ± 1.4 nm2, respectively. It is noteworthy that the very extended monomer conformation has an estimated CCS value similar to that of the folded dimer, indicating a significant extent of conformational flexibility.
The C-terminus induces extensive disorder in the CP149 dimer
To elucidate which region(s) of the protein is responsible for the disorder in CP149 dimer, we conducted limited proteolysis to investigate the quaternary structure and dynamics of this protein complex. CP149 dimer (i.e., with the disulphide bond intact) was incubated with trypsin in a 1:35 molar ratio at 20°C and proteolysis was recorded in real time using ESI-IMS-MS (Fig. 3, a–c). During the course of the reaction, evidence for a single cleavage of one of the two C-terminal peptides at R127 was apparent: doubly charged peptide ions appeared at m/z 1168 (data not shown), corresponding to the peptide comprising residues 128–149 (2334 Da), and residual CP149 dimer lacking this peptide from one of its two subunits was observed also (Fig. 3 b). R127 is the first C-terminal amino acid residue that is susceptible to trypsinolysis, as R133 is adjacent to P134 and hence not cleavable (see Materials and Methods for the amino acid sequence of CP149). The second C-terminal amino acid residue that is susceptible to trypsinolysis is R112, but no cleavage was detected at this site. The cleavage product observed, CP149 dimer (1–127), where one C-terminus is lost, is denoted as Δ1C. Before proteolysis, intact CP149 dimer was observed with a bimodal charge state distribution, as described above (Figs. 2 a and 3 a); from the m/z spectrum, the ratio of the CP149 dimeric conformers was estimated as 70% extended versus 30% compact. This ratio remained constant for the residual intact CP149 dimer throughout the proteolysis experiment, that is, no protein folding or unfolding was observed in the presence of the enzyme. Although the m/z spectrum of the Δ1C proteolysis product showed a similar bimodal charge state distribution to that of intact CP149 dimer, a significant reduction in the amount of disorder was indicated by the reduced ratio of its extended to compact conformers, which was measured as 55% extended versus 45% compact protein (Fig. 3 b).
Figure 3.
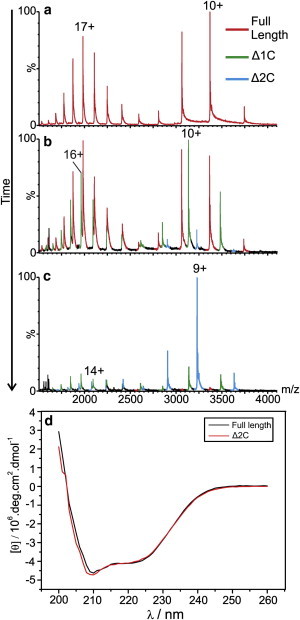
C-terminal cleavage reduces disorder of CP149 dimer. m/z spectra of full- length CP149 dimer (red) undergoing proteolysis observed (a) immediately after addition of 1:35 (molar ratio) trypsin; (b) after 8 h, when the single C-terminal cleavage product, Δ1C, appears (green); (c) after 24 h, when the double C-terminal cleavage product, Δ2C (blue), predominates. (d) Circular dichroism spectra of CP149 dimer before (black) and after (red) cleavage of both C-termini with trypsin. The minima at 208 and 222 nm, characteristic of an α-helical fold, are present in both spectra indicating little change in secondary structure after C-terminal cleavage.
As proteolysis continued, a second cleavage product was observed, corresponding in mass to a double cleavage, denoted as Δ2C, in which both subunits had lost the C-terminal residues 128–149 following enzyme cleavage at the R127 residues in both protein chains (Fig. 3 c). Again, the charge state distribution indicated the presence of both extended and compact conformers, but the more highly charged ions indicative of protein disorder were reduced further for this double cleavage product; the ratio of extended to compact conformers for Δ2C was measured as 22% versus 78%.
The differing populations of compact versus extended conformers for CP149 dimer, Δ1C, and Δ2C observed using noncovalent ESI-IMS-MS support the notion that the disorder, or flexibility, in the CP149 dimer is due primarily to its C-terminal amino acid sequences. This observation is further supported by the fact that the C-terminal peptide, comprising residues 128–149, includes only one basic residue, R133, which is insufficient to accommodate all of the charges (11+ to 17+) observed in the m/z spectrum of the extended conformer of Δ2C. Indeed, the difference between the average integer charge states of the compact (10+) and extended (17+) conformer of CP149 is 7+, indicating that an exposure of additional basic sites must occur in the case of the extended conformer. Removal of the C-terminal peptide shifts the equilibrium between the compact and extended dimeric conformations in favor of the more ordered conformer; however, there still remains a small amount of disorder that indicates that the C-terminus is not quite responsible for all the disorder observed.
To check that no major structural rearrangements occurred following cleavage of the C-terminal peptide, we conducted circular dichroism spectroscopy before and after proteolysis. The spectra (Fig. 3 d) show characteristic minima at 208 and 222 nm indicative of an α-helical secondary structure as expected and demonstrate that the cleavage event does not disrupt the overall protein fold. Further evidence of the retention of protein structure following limited proteolysis comes from the ESI-IMS-MS analyses of the cleaved forms of CP149 dimer. CCS values of Δ1C and Δ2C over the full range of charge state ions display similar trends to those of the intact CP149 dimer (Fig. S2), in that similar compact and extended conformations were observed in addition to an expected, modest, systematic decrease in CCS as a result of proteolysis with the loss of first one, then the second, C-terminal peptide. As expected, cleavage of the C-termini abrogated assembly (Fig. S3). It has been previously demonstrated that residues up to 140 inclusive are necessary for assembly (9,42,43).
Conformational flexibility is required for assembly
To explore further the role that the C-terminus contributes to the disorder observed in the CP149 dimer, we constructed and analyzed a fused CP149 dimer in which one C-terminus is restricted by a C- to N-terminal linker. The fused dimer was expressed as a single polypeptide linked by five Gly-Gly-Ser repeats from the C-terminus of one monomeric subunit to the N-terminus of the next (Fig. 4 a). Noncovalent ESI-IMS-MS analysis of the fused dimer was conducted from a solution of 50 mM ammonium acetate (pH 9.5), as these conditions were found to be unfavorable for its self-assembly. This was essential for the analysis of the fused dimer as it exhibits an increased propensity to aggregate at neutral pH, in comparison to CP149 dimer. The m/z spectrum of the fused dimer displayed a similar bimodal charge state distribution of ions covering charge states 9+ to 14+ and 15+ to 20+ (Fig. 4 b), with the latter ions being very low in intensity. The ratio of the extended to compact fused dimer conformers (16% vs. 84%) is significantly less than the ratio observed for the noncovalently bound CP149 dimer (70% vs. 30%), indicating a significantly lower degree of disorder compared with that observed for the CP149 dimer and a slightly lower degree of disorder than that observed for the Δ1C and Δ2C proteolysis products.
Figure 4.
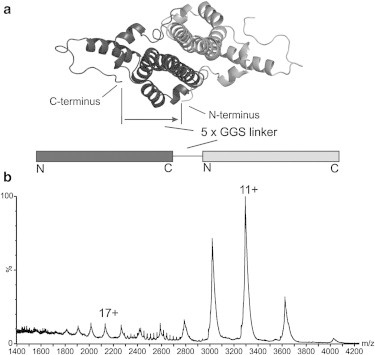
The fused dimer CP149 displays reduced dynamics. (a) A linker of five GGS amino acid repeats links the C-terminus of one monomer (dark gray) to the N-terminus of the second (light gray). (b) Noncovalent ESI-MS m/z spectrum of the fused dimer CP showing a bimodal charge state distribution centered on 11+ and 17+ ions. The high charge state distribution is low in intensity relative to that observed for CP149 dimer, suggesting a reduced propensity to unfold. This is consistent with one of the C-termini being restricted by the C-to-N-terminal linker.
HAP-1 induces CP149 oligomer formation but not capsid assembly
The roles that the CP149 dimer conformers play in its assembly were also examined. The protein was incubated with varying concentrations of HAP-1, a compound known to accelerate and misdirect capsid assembly (36). This small molecule has been suggested to bind to the C-terminus of CP149 dimer (42) and so may stabilize this region of the protein. The addition of HAP-1 to CP149 dimer in various ratios had little effect on the ESI-MS charge state distribution, nor did it affect the observed relative ratios of the compact and extended dimer conformers. Furthermore, no CP149 dimer–HAP-1 complexes were observed, indicating that if any binding between CP149 dimer and HAP-1 did occur, it was insufficiently robust to be maintained and/or detected under these conditions (Fig. 5 a). However, high m/z signals (m/z 4000–10,000) were detected that corresponded to noncovalently bound oligomers consisting of two, three, four, five, and six CP149 dimers (masses ranging from 67.4 to 202.2 kDa), with evidence of low-intensity signals from higher order oligomers. Such signals were observed at CP149 dimer:HAP-1 molar ratios of 1:5 and above. Previous work by Zlotnick et al. (36) suggested that HAP compounds induce the formation of kinetically trapped assembly intermediates that persist up to 24 h after initial incubation. Although CP149 dimer had not been subjected to the high ionic strength conditions favored for assembly in the experiments described here, it is likely that the oligomers observed in this MS study are related to those species detected by Zlotnick et al. In support of this proposition, TEM analysis of CP149:HAP-1 mixtures displayed large, aberrant, noncapsid structures (Fig. 5 b) consistent with the hexameric arrays observed by Zlotnick et al. Capsid particles, akin to those observed under normal assembly conditions (Fig. 5 c), were not observed in our micrographs.
Figure 5.
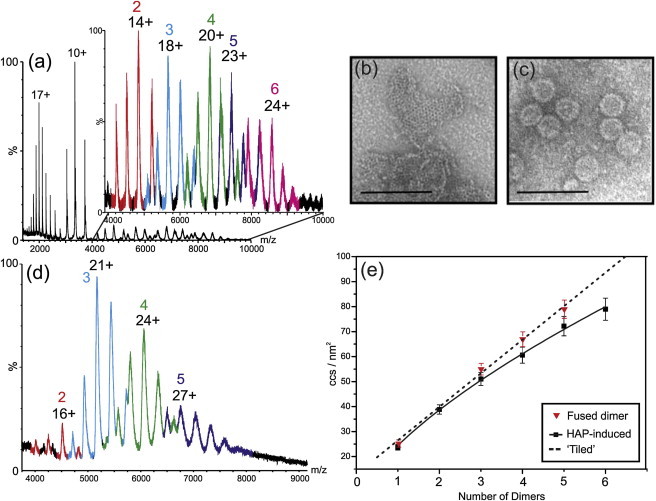
CP149 dimer and fused dimer oligomers. (a) nanoESI-MS m/z spectrum showing CP149 forms oligomers of two (red), three (blue), four (green), five (purple), and six (magenta) dimers in the presence of HAP-1 (10:1 molar ratio, HAP:CP149 dimer) with little change to the unbound CP149 dimer ions remaining in the spectrum. There are also low-intensity signals indicating the presence of species greater in mass than six dimers. (b) TEM analysis of CP149 dimer after incubation with 50:1 HAP:1 showing large, noncapsid structures and (c) a regular CP149 dimer assembly reaction induced by 0.5 M NaCl, displaying capsid particles ∼30 nm in diameter. The scale bars represent 100 nm. (d) Noncovalent ESI-MS m/z spectrum showing fused dimer CP oligomers produced from disassembly of fused dimer CP capsids using 4 M urea. Oligomers of two (red), three (blue), four (green), and five (purple) fused dimers are observed. (e) CCS values of core protein oligomers versus oligomer order. The fused dimer CP oligomers (red triangles) lie on the tiled line (dashed line), whereas the HAP-induced oligomers (black squares) deviate from this, indicating a more compact structure. Error bars indicate the standard deviation from the mean of at least three measurements.
ESI-IMS-MS experimentally estimated CCS values of the HAP-induced oligomers were compared with theoretical values modeled from atomic resolution models of CP149 oligomers with tiled shapes, that is, as they appear in the structure of the T = 4 capsid (Fig. 1 b). As demonstrated by Uetrecht et al. (9), the CCS values of capsid-related oligomeric species of the HBV core protein were consistent with tiled morphologies. However, unlike the oligomers observed by Uetrecht et al., the HAP-induced oligomers detected here were not consistent with a tiled morphology (Fig. 5 e and Table S1). The estimated CCS values of the oligomers were more compact than the models predicted, implying that these oligomers are not capsid-related structures.
Our previous work has demonstrated that oligomers isolated from CP149 fused dimer disassembly reactions are reassembly-competent (K. Holmes, D.A. Shepherd, A.E. Ashcroft, M. Whelan, D.J. Rowlands, and N.J. Stonehouse, unpublished). It is likely, therefore, that the shapes of these oligomers would be different from those of the HAP-induced oligomers. ESI-IMS-MS analysis of a fused dimer capsid disassembly reaction yielded signals corresponding to dimers, trimers, tetramers, and pentamers of the fused dimer (Fig. 5 d). These oligomers are reassembly-competent, suggesting that they may recapitulate intermediate capsid assembly states. CCS values estimated from ESI-IMS-MS analysis showed that these fused dimer oligomers do indeed exhibit a different trend in shape from HAP-induced oligomers (Fig. 5 e). The values for the fused dimer oligomers lie on a line representing capsid-derived atomic models with tiled structures, consistent with the observation that these are assembly-competent structures. When comparing the charge state ions of the fused dimer oligomers with those of the HAP-induced oligomers, it is apparent that the former populate, on average, higher charge states. For example, the most intense charge state for the tetramer of fused dimers is the 24+ ions, whereas for the HAP-induced tetramer of CP149 dimers, this is the 20+ ions. This is further evidence that the fused dimer oligomers have a more extended structure with a larger solvent-accessible surface area relative to the HAP-induced oligomers.
Discussion
Noncovalent ESI-IMS-MS has been used to study a key HBV antiviral target in terms of its conformational characteristics and distinctive oligomerization properties. Using noncovalent MS conditions, the CP149 dimer has been shown to populate two quite different conformational states. The range of charge state ions populated, together with their measured CCS values, indicates that one conformer is compact and the other is unfolded or extended significantly. The disorder observed is consistent with previous NMR studies that implied a degree of flexibility within the C-termini (11). However, ESI-IMS-MS, which has the ability to separate and individually measure copopulated species rather than present an average of all molecules, indicates the presence of two distinct conformeric families and provides a comparison of their structures in terms of shape. Although the projection approximation algorithms used to calculate the CCS values of proteins from their respective PDB coordinates tend to underestimate slightly the CCS of the protein, in general they are in reasonable (within 5%) agreement with the IMS-MS-estimated CCS values because of a small, general compaction of protein structure in the absence of solvent in the gas-phase experiments, and thus can be used as an indicator of the compactness, or foldedness, of the protein under investigation (44). Furthermore, the presence of the intermonomer disulphide linkage has been shown to be necessary to maintain the dimeric nature of CP149. In the absence of this chemical bond, the dimer dissociates into monomer, the latter having a high degree of disorder even under the mild solution conditions and instrumental parameters employed, consistent with the weak interdimer association energy in capsids (4).
Trypsin proteolysis of the CP149 dimer resulted in a specific cleavage at R127, releasing the first 22 amino acid residues of the C-terminus. The loss of these residues was accompanied by a significant reduction in the intensity of the lower m/z, more highly charged envelope of ions that is associated with the extended conformer. As little disorder is apparent in the two truncated products, Δ1C and Δ2C, this suggests that the disorder associated with intact CP149 dimer is related to the presence of the two C-termini on account of their orientation within the quaternary structure of the dimer. This observation is consistent with the x-ray crystal structure of the intact capsid, in which the C-terminal peptide is unstructured (10) (Fig. 1 a), and also with work by Hilmer et al. (12), who showed that the C-terminal peptide is cleaved by trypsin in a conformation-dependent manner.
In addition, the decrease in the population of the extended conformers observed for the truncated dimers compared with the intact CP149 dimer when analyzed under the same experimental conditions is a good indication that the compact and extended conformers detected reflect the solution behavior of these species and are not simply artifacts of the MS technique.
The effect of the C-terminus on CP149 disorder was tested further by ESI-IMS-MS analysis of a modified C-to-N-terminally fused dimer of CP149. The fused dimer has one C-terminus restricted by the linker group and therefore should exhibit less structural disorder. This was confirmed given that the high charge state ions corresponding to the extended fused dimer conformer were much lower in intensity than the corresponding signals observed for the CP149 dimer. Indeed, the proportion of the extended conformer decreased from 70% for the CP149 dimer to 16% in the case of the fused dimer, and was lower than the values observed for both the Δ1C and Δ2C truncated proteolysis products, which indicated the extended conformer population to be 55% and 22%, respectively.
The oligomers generated from CP149 dimer in the presence of HAP-1, an anti-HBV small molecule and capsid-assembly misdirector, were formed under noncapsid-assembly conditions (i.e., in the absence of any added NaCl), indicating that these assemblies are not dependent on either high ionic strength or the presence of metal cations. The oligomers are likely analogous to the oligomers observed by Zlotnick et al. (36), although they appear not to be kinetically trapped because a significant reservoir of free CP149 dimer is still present in these samples. Zlotnick et al. reported that the oligomers they observed persisted to >24 h in some cases, which is consistent with our observations (data not shown). The CCS values obtained from ESI-IMS-MS analyses suggest that the HAP-induced oligomers of CP149 dimer are not tiled, as may be expected for assembly-competent complexes (9) (Table S1). The observed oligomers have slightly but consistently more compact structures than those expected for the tiled models, the exact morphologies of which are not known. Incubation of HAP-1 with Δ2C, lacking the C-terminus and therefore the dimer–dimer interaction interface, did not result in the formation of oligomers, implying that the CP149 dimer oligomers observed are formed through native C-terminus contacts (Fig. S3). Oligomers of the CP149 fused dimer were found to be distinctly more extended in shape compared with HAP-induced CP149 oligomers and consistent with a tiled assembly pattern. The capsid-assembly competence of the fused dimer was verified using TEM, whereas the addition of HAP-1 to the CP149 dimer did not lead to capsid assembly, but rather the production of large, aberrant noncapsid structures (Fig. 5 d). It is possible that the reduced flexibility of the fused dimer is responsible for reduced sensitivity to assembly misdirection by HAP-1.
The work described here highlights the importance of the C-terminus and dynamics of the HBV CP, which influence the conformational dynamics of the dimer, its stability, and its assembly patterns. Distinct assembly pathways have been highlighted, with differences in the structural build of the oligomeric intermediates, and the nature of small molecule-induced assembly misdirection has been described. The combined ability of IMS and MS to separate species within a heterogeneous mixture based on mass and shape in a single experiment provides a valuable tool to study myriad biological processes. Key to this study, these techniques have been used to characterize order–disorder transitions in proteins and protein complexes and macromolecular assembly processes rapidly, using only picomolar amounts of material. Such techniques are valuable for the characterization of targets for future antiviral therapy.
Acknowledgments
D.A.S. was funded by an Engineering and Physical Sciences Research Council White Rose studentship; K.H. was funded by a Biotechnology and Biological Sciences Research Council Collaborative Awards in Science and Engineering award (iQur PLC, London, UK). The Synapt HDMS mass spectrometer was purchased with funds from the Biotechnology and Biological Sciences Research Council through its Research Equipment Initiative scheme (BB/E012558/1). The authors thank all members of the Ashcroft and Stonehouse groups for helpful discussions.
Contributor Information
Nicola J. Stonehouse, Email: n.j.stonehouse@leeds.ac.uk.
Alison E. Ashcroft, Email: a.e.ashcroft@leeds.ac.uk.
Supporting Material
References
- 1.Dienstag J.L. Hepatitis B virus infection. N. Engl. J. Med. 2008;359:1486–1500. doi: 10.1056/NEJMra0801644. [DOI] [PubMed] [Google Scholar]
- 2.Nassal M., Schaller H. Hepatitis B virus replication. Trends Microbiol. 1993;1:221–228. doi: 10.1016/0966-842x(93)90136-f. [DOI] [PubMed] [Google Scholar]
- 3.Bartenschlager R., Schaller H. Hepadnaviral assembly is initiated by polymerase binding to the encapsidation signal in the viral RNA genome. EMBO J. 1992;11:3413–3420. doi: 10.1002/j.1460-2075.1992.tb05420.x. [DOI] [PMC free article] [PubMed] [Google Scholar]
- 4.Ceres P., Stray S.J., Zlotnick A. Hepatitis B virus capsid assembly is enhanced by naturally occurring mutation F97L. J. Virol. 2004;78:9538–9543. doi: 10.1128/JVI.78.17.9538-9543.2004. [DOI] [PMC free article] [PubMed] [Google Scholar]
- 5.Stray S.J., Ceres P., Zlotnick A. Zinc ions trigger conformational change and oligomerization of hepatitis B virus capsid protein. Biochemistry. 2004;43:9989–9998. doi: 10.1021/bi049571k. [DOI] [PubMed] [Google Scholar]
- 6.Zlotnick A., Johnson J.M., Endres D. A theoretical model successfully identifies features of hepatitis B virus capsid assembly. Biochemistry. 1999;38:14644–14652. doi: 10.1021/bi991611a. [DOI] [PubMed] [Google Scholar]
- 7.Packianathan C., Katen S.P., Zlotnick A. Conformational changes in the hepatitis B virus core protein are consistent with a role for allostery in virus assembly. J. Virol. 2010;84:1607–1615. doi: 10.1128/JVI.02033-09. [DOI] [PMC free article] [PubMed] [Google Scholar]
- 8.Cohen B.J., Richmond J.E. Electron microscopy of hepatitis B core antigen synthesized in E. coli. Nature. 1982;296:677–679. doi: 10.1038/296677a0. [DOI] [PubMed] [Google Scholar]
- 9.Uetrecht C., Barbu I.M., Heck A.J. Interrogating viral capsid assembly with ion mobility-mass spectrometry. Nat. Chem. 2011;3:126–132. doi: 10.1038/nchem.947. [DOI] [PubMed] [Google Scholar]
- 10.Wynne S.A., Crowther R.A., Leslie A.G. The crystal structure of the human hepatitis B virus capsid. Mol. Cell. 1999;3:771–780. doi: 10.1016/s1097-2765(01)80009-5. [DOI] [PubMed] [Google Scholar]
- 11.Freund S.M., Johnson C.M., Ferguson N. Moving towards high-resolution descriptions of the molecular interactions and structural rearrangements of the human hepatitis B core protein. J. Mol. Biol. 2008;384:1301–1313. doi: 10.1016/j.jmb.2008.10.020. [DOI] [PubMed] [Google Scholar]
- 12.Hilmer J.K., Zlotnick A., Bothner B. Conformational equilibria and rates of localized motion within hepatitis B virus capsids. J. Mol. Biol. 2008;375:581–594. doi: 10.1016/j.jmb.2007.10.044. [DOI] [PMC free article] [PubMed] [Google Scholar]
- 13.Heck A.J., Van Den Heuvel R.H. Investigation of intact protein complexes by mass spectrometry. Mass Spectrom. Rev. 2004;23:368–389. doi: 10.1002/mas.10081. [DOI] [PubMed] [Google Scholar]
- 14.Benesch J.L., Ruotolo B.T., Robinson C.V. Protein complexes in the gas phase: technology for structural genomics and proteomics. Chem. Rev. 2007;107:3544–3567. doi: 10.1021/cr068289b. [DOI] [PubMed] [Google Scholar]
- 15.Giles K., Pringle S.D., Bateman R.H. Applications of a travelling wave-based radio-frequency-only stacked ring ion guide. Rapid Commun. Mass Spectrom. 2004;18:2401–2414. doi: 10.1002/rcm.1641. [DOI] [PubMed] [Google Scholar]
- 16.Pringle S.D., Giles K., Scrivens J.H. An investigation of the mobility separation of some peptide and protein ions using a new hybrid quadrupole/travelling wave IMS/oa-ToF instrument. Int. J. Mass Spectrom. 2007;261:1–12. [Google Scholar]
- 17.Benesch J.L., Ruotolo B.T. Mass spectrometry: come of age for structural and dynamical biology. Curr. Opin. Struct. Biol. 2011;21:641–649. doi: 10.1016/j.sbi.2011.08.002. [DOI] [PMC free article] [PubMed] [Google Scholar]
- 18.Valentine S.J., Counterman A.E., Clemmer D.E. A database of 660 peptide ion cross sections: use of intrinsic size parameters for bona fide predictions of cross sections. J. Am. Soc. Mass Spectrom. 1999;10:1188–1211. doi: 10.1016/S1044-0305(99)00079-3. [DOI] [PubMed] [Google Scholar]
- 19.Ruotolo B.T., Benesch J.L., Robinson C.V. Ion mobility-mass spectrometry analysis of large protein complexes. Nat. Protoc. 2008;3:1139–1152. doi: 10.1038/nprot.2008.78. [DOI] [PubMed] [Google Scholar]
- 20.Smith D.P., Knapman T.W., Ashcroft A.E. Deciphering drift time measurements from travelling wave ion mobility spectrometry–mass spectrometry studies. Eur. J. Mass Spectrom. (Chichester, Eng.) 2009;15:113–130. doi: 10.1255/ejms.947. [DOI] [PubMed] [Google Scholar]
- 21.Koeniger S.L., Merenbloom S.I., Clemmer D.E. Evidence for many resolvable structures within conformation types of electrosprayed ubiquitin ions. J. Phys. Chem. B. 2006;110:7017–7021. doi: 10.1021/jp056165h. [DOI] [PubMed] [Google Scholar]
- 22.Smith D.P., Giles K., Ashcroft A.E. Monitoring copopulated conformational states during protein folding events using electrospray ionization–ion mobility spectrometry–mass spectrometry. J. Am. Soc. Mass Spectrom. 2007;18:2180–2190. doi: 10.1016/j.jasms.2007.09.017. [DOI] [PMC free article] [PubMed] [Google Scholar]
- 23.Bohrer B.C., Merenbloom S.I., Clemmer D.E. Biomolecule analysis by ion mobility spectrometry. Annu. Rev. Anal. Chem. (Palo Alto Calif.) 2008;1:293–327. doi: 10.1146/annurev.anchem.1.031207.113001. [DOI] [PMC free article] [PubMed] [Google Scholar]
- 24.Uetrecht C., Rose R.J., Heck A.J. Ion mobility mass spectrometry of proteins and protein assemblies. Chem. Soc. Rev. 2010;39:1633–1655. doi: 10.1039/b914002f. [DOI] [PubMed] [Google Scholar]
- 25.Beveridge R., Chappuis Q., Barran P. Mass spectrometry methods for intrinsically disordered proteins. Analyst (Lond.) 2013;138:32–42. doi: 10.1039/c2an35665a. [DOI] [PubMed] [Google Scholar]
- 26.Jurneczko E., Cruickshank F., Barran P.E. Intrinsic disorder in proteins: a challenge for (un)structural biology met by ion mobility–mass spectrometry. Biochem. Soc. Trans. 2012;40:1021–1026. doi: 10.1042/BST20120125. [DOI] [PubMed] [Google Scholar]
- 27.Knapman T.W., Valette N.M., Ashcroft A.E. Ion mobility spectrometry–mass spectrometry of intrinsically unfolded proteins: trying to put order into disorder. Curr. Anal. Chem. 2013;9:181–191. doi: 10.2174/1573411011309020004. [DOI] [PMC free article] [PubMed] [Google Scholar]
- 28.Pagel K., Natan E., Robinson C.V. Intrinsically disordered p53 and its complexes populate compact conformations in the gas phase. Angew. Chem. Int. Ed. Engl. 2013;52:361–365. doi: 10.1002/anie.201203047. [DOI] [PubMed] [Google Scholar]
- 29.Saikusa K., Kuwabara N., Akashi S. Characterisation of an intrinsically disordered protein complex of Swi5-Sfr1 by ion mobility mass spectrometry and small-angle x-ray scattering. Analyst (Lond.) 2013;138:1441–1449. doi: 10.1039/c2an35878f. [DOI] [PubMed] [Google Scholar]
- 30.Canon F., Ballivian R., Dugourd P. Folding of a salivary intrinsically disordered protein upon binding to tannins. J. Am. Chem. Soc. 2011;133:7847–7852. doi: 10.1021/ja200534f. [DOI] [PubMed] [Google Scholar]
- 31.Shepherd D.A., Veesler D., Cambillau C. Unraveling lactococcal phage baseplate assembly by mass spectrometry. Mol. Cell. Proteomics. 2011;10 doi: 10.1074/mcp.M111.009787. M111.0009787. [DOI] [PMC free article] [PubMed] [Google Scholar]
- 32.Shoemaker G.K., Van Duijn E., Heck A.J. Norwalk virus assembly and stability monitored by mass spectrometry. Mol. Cell. Proteomics. 2010;10:1742–1751. doi: 10.1074/mcp.M900620-MCP200. [DOI] [PMC free article] [PubMed] [Google Scholar]
- 33.Uetrecht C., Versluis C., Heck A.J. Stability and shape of hepatitis B virus capsids in vacuo. Angew. Chem. Int. Ed. Engl. 2008;47:6247–6251. doi: 10.1002/anie.200802410. [DOI] [PMC free article] [PubMed] [Google Scholar]
- 34.Böttcher B., Wynne S.A., Crowther R.A. Determination of the fold of the core protein of hepatitis B virus by electron cryomicroscopy. Nature. 1997;386:88–91. doi: 10.1038/386088a0. [DOI] [PubMed] [Google Scholar]
- 35.Conway J.F., Cheng N., Steven A.C. Visualization of a 4-helix bundle in the hepatitis B virus capsid by cryo-electron microscopy. Nature. 1997;386:91–94. doi: 10.1038/386091a0. [DOI] [PubMed] [Google Scholar]
- 36.Stray S.J., Bourne C.R., Zlotnick A. A heteroaryldihydropyrimidine activates and can misdirect hepatitis B virus capsid assembly. Proc. Natl. Acad. Sci. USA. 2005;102:8138–8143. doi: 10.1073/pnas.0409732102. [DOI] [PMC free article] [PubMed] [Google Scholar]
- 37.Mesleh M.F., Hunter J.M., Jarrold M.F. Structural information from ion mobility measurements: effects of the long-range potential. J. Phys. Chem. 1996;100:16082–16086. [Google Scholar]
- 38.Bush M.F., Hall Z., Ruotolo B.T. Collision cross sections of proteins and their complexes: a calibration framework and database for gas-phase structural biology. Anal. Chem. 2010;82:9557–9565. doi: 10.1021/ac1022953. [DOI] [PubMed] [Google Scholar]
- 39.Carrillo-Tripp M., Shepherd C.M., Reddy V.S. VIPERdb2: an enhanced and web API enabled relational database for structural virology. Nucleic Acids Res. 2009;37(Database issue):D436–D442. doi: 10.1093/nar/gkn840. [DOI] [PMC free article] [PubMed] [Google Scholar]
- 40.Valentine R.C., Shapiro B.M., Stadtman E.R. Regulation of glutamine synthetase. XII. Electron microscopy of the enzyme from Escherichia coli. Biochemistry. 1968;7:2143–2152. doi: 10.1021/bi00846a017. [DOI] [PubMed] [Google Scholar]
- 41.de la Mora J.F. Electrospray ionization of large multiply charged species proceeds via Dole’s charged residue mechanism. Anal. Chim. Acta. 2000;406:93–104. [Google Scholar]
- 42.Zlotnick A., Cheng N., Wingfield P.T. Dimorphism of hepatitis B virus capsids is strongly influenced by the C-terminus of the capsid protein. Biochemistry. 1996;35:7412–7421. doi: 10.1021/bi9604800. [DOI] [PubMed] [Google Scholar]
- 43.Bourne C.R., Finn M.G., Zlotnick A. Global structural changes in hepatitis B virus capsids induced by the assembly effector HAP1. J. Virol. 2006;80:11055–11062. doi: 10.1128/JVI.00933-06. [DOI] [PMC free article] [PubMed] [Google Scholar]
- 44.Politis A., Park A.Y., Robinson C.V. Integrating ion mobility mass spectrometry with molecular modelling to determine the architecture of multiprotein complexes. PLoS ONE. 2010;5:e12080. doi: 10.1371/journal.pone.0012080. [DOI] [PMC free article] [PubMed] [Google Scholar]
Associated Data
This section collects any data citations, data availability statements, or supplementary materials included in this article.