

Abstract
Members of the ETS family of transcription factors regulate a functionally diverse array of genes. All ETS proteins share a structurally-conserved but sequence-divergent DNA-binding domain, known as the ETS domain. Although the structure and thermodynamics of the ETS-DNA complexes are well known, little is known about the kinetics of sequence recognition, a facet that offers potential insight into its molecular mechanism. We have characterized DNA binding by the ETS domain of PU.1 by biosensor-surface plasmon resonance (SPR). SPR analysis revealed a striking kinetic profile for DNA binding by the PU.1 ETS domain. At low salt concentrations, it binds high-affinity cognate DNA with a very slow association rate constant (≤105 M−1 s−1), compensated by a correspondingly small dissociation rate constant. The kinetics are strongly salt-dependent but mutually balance to produce a relatively weak dependence in the equilibrium constant. This profile contrasts sharply with reported data for other ETS domains (e.g., Ets-1, TEL) for which high-affinity binding is driven by rapid association (>107 M−1 s−1). We interpret this difference in terms of the hydration properties of ETS-DNA binding and propose that at least two mechanisms of sequence recognition are employed by this family of DNA-binding domain. Additionally, we use SPR to demonstrate the potential for pharmacological inhibition of sequence-specific ETS-DNA binding, using the minor groove-binding distamycin as a model compound. Our work establishes SPR as a valuable technique for extending our understanding of the molecular mechanisms of ETS-DNA interactions as well as developing potential small-molecule agents for biotechnological and therapeutic purposes.
Keywords: ETS transcription factors, PU.1, protein-DNA interactions, surface plasmon resonance, transcription factor inhibition
Introduction
ETS proteins comprise a major family of eukaryotic transcription factors. They are conserved throughout the metazoan phyla1 and regulate the expression of a functionally diverse array of genes.2 Despite their functional diversity and lack of extensive sequence homology, all ETS proteins share a structurally conserved DNA-binding domain (known as the ETS domain) which recognize the DNA sequence motif 5'-GGA(A/T)-3'. High-resolution structures of the various ETS domains3–13 have confirmed a common binding mode in which an essential recognition helix contacts bases of the core consensus (directly or water-mediated) in the major groove while less ordered structures interact with flanking bases primarily via backbone contacts at the minor groove. Although the flanking contacts (so-called “indirect readout”14) appear to be structurally nonspecific, the selectivity of flanking sequences among ETS proteins is non-degenerate and exhibit distinctive patterns among ETS family members.15 To date, the biophysical basis of this selectivity has remained elusive.
Recently, thermodynamic studies have begun to shed some light, and comprehensive data on sequence recognition by the ETS-family member PU.1 (Spi-1) have enabled a coherent physical description.16–20 Changes in the flanking bases elicit profound changes in the thermodynamics of binding (enthalpy/entropy contributions, heat capacity changes, salt-dependence) all of which are tightly correlated with overall site affinity. The recent identification of specific hydration of the protein-DNA interface as the underlying molecular event19 has further enabled a unified interpretation of the thermodynamics data. Specifically, high-affinity PU.1 ETS-DNA binding requires the formation of a specific hydration network that couples flanking and core protein-DNA contacts. This water network appears to be highly cooperative, as binding to a suboptimal (but still cognate) sequence is manifestly devoid of sensitivity to water activity. The thermodynamic data on ETS-DNA interactions can be considerably enhanced with kinetic studies which, to our knowledge, have been limited to studies on cognate vs. non-cognate sites.21
As part of our effort to better understand ETS-DNA interactions and develop small molecule inhibitors of the complexes as potential biotechnology and therapeutic agents, we have characterized the sequence-specific interactions of the PU.1 ETS domain by biosensor-surface plasmon resonance (SPR). Commercial biosensor-SPR instruments, such as Biacore, are well-suited for the kinetic and thermodynamic analysis of many types of interactions but evaluation of protein-DNA complexes with such instruments has been less extensive. Potential difficulties with tightly bound protein-DNA complexes include i) mass transfer limits on kinetics, where the rates of transfer of components from the injected solution to the immobilized component is slower than the association reaction, ii) very slow dissociation rates due to rebinding during the dissociation phase, and iii) limited time for the association reaction due to volume limitations in the injection syringe, have restricted use of these instruments. Myszka et al. showed that the latter problem can be resolved for equilibrium analysis by immobilizing the DNA target sequence and placing the protein at different concentrations in the running buffer.22 With this method they were able to inject protein for hours and determine dissociation constants (KD) below 10−9 M by steady-state analysis, which is not affected by mass transfer and rebinding. Blaesin et al. were able to determine KD values down to below 10−9 M for the DnaA protein with a cognate site by using low immobilization amounts of DNA and a high flow rate.23 No kinetics values were reported but they did note that with the relatively rapid dissociation rates of this complex at higher salt concentrations, the SPR method performed more reliably than electrophoretic mobility shift (EMSA). He et al. presented a mathematical and very clever experimental approach to deal with the mass transfer effect in very strong binding of proteins to DNA.22 They used the lac repressor-operator interaction as a test system and compared their results to previous values from Bondeson et al.24 that did not agree with filter binding results.25 They clearly showed that, with the lac DNA immobilized and lac repressor in the injection solution, serious mass transfer effects and rebinding in dissociation were obtained at low flow rates. The observed association rate constants increased markedly as the flow rate increased, in agreement with the removal of mass transfer. In the dissociation phase of the sensorgram, the true dissociation kinetics were masked by rebinding of the dissociated protein to the immobilized DNA, instead of the protein being removed in buffer flow. To deal with rebinding the authors included excess lac DNA in the injected buffer at the end of the association phase. As the concentration of DNA in the injected buffer solution increased, the dissociated protein bound to the DNA in the injected solution instead of the immobilized DNA. In this way rebinding was relieved and at high DNA concentration and a limiting kd value, which agreed well with filter binding results, was determined.22
In our DNA biosensor studies with the PU.1 ETS domain both mass transfer and rebinding were carefully evaluated and minimized in the experimental protocol that we developed. The incorporation of optimally designed flow cells in current instrumentation as well as optimized experimental protocols and sensor chips, have moved biosensor-SPR into the methods available for quantitative analysis of protein-DNA interactions. Here we show that careful use of salt and non-specific DNA allows useful data collection over a broad range of conditions without mass transfer or rebinding problems. Sequence-specific PU.1 ETS-DNA interactions represent an excellent model system for evaluating protein-DNA complex formation by SPR because extensive equilibrium data by electrophoretic mobility shift assays (EMSA) and filter binding methods have been reported.16–20 These published values provide an excellent reference set for comparison with SPR equilibrium results. At the same time, SPR fills a gap in the study of ETS-DNA interactions with the kinetics of complex formation. Both equilibrium and kinetics results for PU.1 binding to a set DNA sequences (Figure 1) have been determined under various ionic conditions with and without nonspecific DNA in the injection solution. This is one of the few reports on protein-DNA interactions to report results both with and without nonspecific DNA, and the differences in kinetics and equilibrium are very informative. The equilibrium results are in excellent agreement with published results on the same system under essentially identical conditions.17,18
Fig. 1.
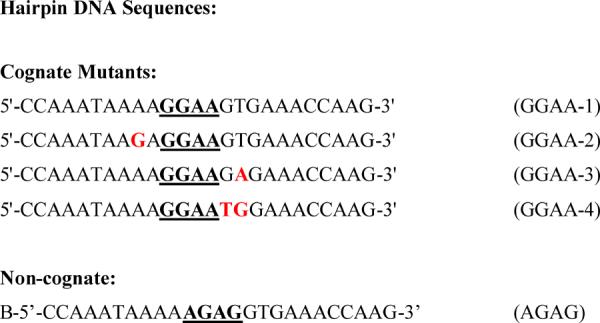
DNA sequences used in this study. The cognate sites are derived from the λB site of the Igλ2–4 enhancer (GGAA-1). The duplex sequences are formed as hairpin (CTCT- loop), biotinylated at the 5' end, and immobilized via streptavidin for SPR analysis. Mutations in the flanking sequences are shown in red. The non-cognate site is identical to λB except the core consensus is mutated to 5'-AGAG-3'.
The kinetics results reveal strong salt dependence with interesting differences with and without non-specific DNA, and they provide new insight into the current model of sequence-specific PU.1 ETS-DNA interactions. In addition, we show that an AT-specific minor groove binding compound can bind at the 5' flanking side of the critical GGAA recognition sequence and inhibit PU.1 binding in the major groove. Our results establish a method to screen libraries of DNA-binding small molecules for compounds with inhibitory properties on ETS-DNA binding. Such a library of inhibitors could significantly enhance our understanding of flanking sequence effects in ETS-DNA complexes and yield potentially selective candidates for investigation in vivo. Transcription factor-DNA complexes represent an under-utilized therapeutic target26–29 and the results reported here will hopefully encourage others to apply small molecules to this area.
Results
Cognate sites for ETS proteins encompass a large set of ~10-bp sequences harboring a core 5'-GGAA/T-3' consensus and variable flanking bases.15 The immobilized sequences used in this study are based on the λB motif of the Ig2–4 enhancer,30 5'-AAAGGAAGTG-3' (denoted GGAA-1, Figure 1), a native high-affinity cognate site for PU.1.16,17 We embedded these sequences in 25-bp hairpin duplexes (Figure 1) to provide adequate flanking sequences against potential end effects. Specifically, at the salt concentrations we employ (>250 mM NaCl), electrostatic end effects project into the duplex by five or fewer bp.31 With respect to the protein, PU.1 ETS is known to self-associate at above 10 μM and above 1 μM in the DNA-bound state.20 We therefore maintained PU.1 concentrations well below this level (less than 400 nM) in the injection solution to enable treatment of the protein as a monomer in both free and bound states.
Initial studies with GGAA-1 indicated very tight binding that was characterized by rapid association kinetics as well as slow dissociation. At least 400 mM NaCl was required to move the rates to a time régime that permits accurate kinetic measurements without significant mass transfer and rebinding (Table 1). We have taken all possible steps to minimize mass transfer, including working at low DNA immobilization levels, running at high flow rates and using optimized flow cells in a Biacore T200 instrument.32–34 Nonetheless, mass transfer effects were observed at 300 mM NaCl (Figure S1, Supporting Information) from the dependence of the sensorgram shapes and apparent kinetics on flow rate. At 400 mM NaCl, flow rate dependence was observed at 25 μL/min but not at 50 and 100 μL/min (Figure S1, Supporting Information). All our kinetics data were therefore collected at 50 μL/min or higher to minimize mass transfer. Excellent fits to the data were obtained with a 1:1 global model incorporating a mass transfer correction (Equation 6) for binding at 400 mM NaCl and higher (Figure 2a, Table 1). At 400 mM NaCl, with GGAA-1 we measured association and dissociation rate constants of (3.1 ± 0.1) × 107 M−1 s−1 and (0.22 ± 0.01) s−1, respectively, giving an apparent equilibrium dissociation constant (KD) of (7.1 ± 0.2) nM. In comparison, binding to the noncognate 5'-AAAAGAGGTG-3' sequence (denoted AGAG, Figure 1) was very rapid and beyond instrumental resolution (Figure 2d). By steady-state analysis, we obtained a dissociation constant of KD = (1.10 ± 0.04) μM, ~150 times weaker than GGAA-1. Above 500 mM NaCl binding to the AGAG site was undetectable.
Table 1.
Apparent kinetics of PU.1 ETS-DNA binding in the absence of salmon sperm DNA as nonspecific competitor.
| CM4-chip (less negatively charged surface) | SA-chip (more negatively charged surface) | SA-chip | |||||
|---|---|---|---|---|---|---|---|
| ?B site (GGAA-1) | AGAG | ||||||
|
| |||||||
| [Na+], mM | ka, M−1 s−1 | kd, s−1 | KD, nM | ka, M−1 s−1 | kd, s−1 | KD, nM | KD, μM |
| 300 | 0.15± 0.2 | ||||||
| 400 | (3.1 ± 0.1) × 107 | 0.22 ± 0.01 | 7.0 ± 0.2 | (7.9 ± 0.2) ×107 | 0.25 ± 0.01 | 3.2 ± 0.1 | 1.1 ± 0.1 |
| 500 | (4.8 ± 0.1) × 106 | 0.24 ± 0.01 | 50 ± 1 | (1.4 ± 0.1) × 106 | 0.08 ± 0.01 | 57 ± 0.2 | 7.1 ± 2.5 |
| 600 | b1.38 × 106 | b0.75 | b543 | (1.0 ± 0.1) × 106 | 0.6 ± 0.1 | (6.0 ± 0.1) × 102 | — a |
| 700 | (9.6 ± 0.1) × 105 | 3.6 ± 0.1 | (3.8 ± 0.2) × 103 | (4.6 ± 0.1) ×105 | 1.8 ± 0.1 | (3.9 ± 0.1) × 103 | — a |
No binding observed under these conditions.
Values extrapolated from the plot in Figure S2.
Errors listed in this table are the standard errors for the fit to the 1:1 model.
Fig. 2.
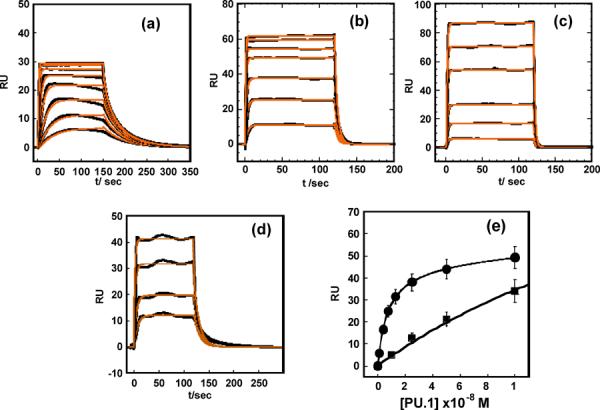
Kinetic and steady-state analysis of PU.1 ETS binding to the cognate λB site and non-cognate DNA by SPR. Sensorgrams for the λB site GGAA-1 in (a) 400Na (2, 4, 8, 15, 25, 50 and 75 nM PU.1 ETS from bottom to top), (b) 500Na (10, 25, 50, 100, 150, 200, 250 nM PU.1 ETS), (c) 600Na (10, 25, 50, 100, 150, 200, 250 nM PU.1 ETS) and (d) Sensorgrams for non-cognate DNA, AGAG at 400Na (10, 25, 50 and 100 nM PU.1 ETS from bottom to top). All the data were acquired at 25°C and pH 7.4 (e) Comparative binding isotherm from steady state analysis for (●) GGAA-1 and (∎) AGAG.
The apparent KD values for GGAA-1 are highly sensitive to salt concentrations. Measurements at 400 to 700 mM NaCl gave a salt dependence slope (SKobs) of 11.0 ± 0.4, indicating a strong electrostatic component to the interaction (Figure 3). To assess the potential contribution by the sensor chip's surface charge, the original SA chip was substituted with a CM4 chip, which has reduced carboxymethylation with lower immobilization capacity and surface charge density (~30% of the SA chip). We reasoned that the lower charge density could reduce any nonspecific binding of positively charged protein to the chip surface. Instead, we observed similar kinetics on both sensor chips (Figure S2, Supporting Information) and their ratios produced similar equilibrium constants (Figure 3 and Table 1). Clearly, under our experimental conditions the chip surfaces did not exert significant effect on the PU.1 ETS-DNA binding affinities or kinetics. The association kinetics constant deceases while the dissociation constant increases with increasing salt concentration as predicted by theory.35 For GGAA-1 the kinetics values are well within the resolution of the Biacore T200 (ka from 103 to 109 M−1s−1 and kd from 10−5 to 1 s−1) while the rates are too fast in general for the noncognate DNA and no kinetics results are reported for that DNA.
Fig. 3.
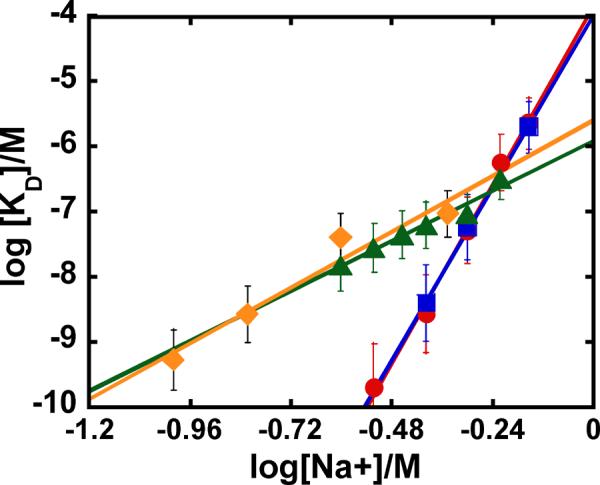
Salt dependence of PU.1 ETS-λB binding as observed by SPR. The KD values obtained from SPR kinetic data for PU.1 ETS-GGAA-1 complex formation under different experimental conditions are compared in this plot. (●) SA and (■) CM4 chip without nonspecific DNA, and (▲) CM4 and (◆) filter binding data with nonspecific DNA.
Nonspecific DNA unmasks biophysically relevant PU.1 ETS-DNA interactions
Most studies of sequence-specific protein-DNA binding add a nonspecific (NS) DNA to minimize nonspecific binding to the specific site and to better simulate biologically relevant conditions. To evaluate the effects of NS DNA and compare our results with published values, we repeated our experiments at 400 mM NaCl with added salmon sperm DNA (from 25 to 300 μM bp) in the injected protein samples (Figure 4). Salmon sperm DNA is a natural mixed-sequence polymer; any adventitious ETS binding sites are expected to be negligible relative to the immobilized DNA. Addition of 25 μM bp NS DNA significantly reduced the apparent binding of the PU.1 ETS domain to GGAA-1. By 100 μM bp NS DNA, the effect on the apparent KD began to level out as free protein is depleted (Figure 4d). KD is reduced about 20 times by the addition of 300 μM NS DNA.
Fig. 4.
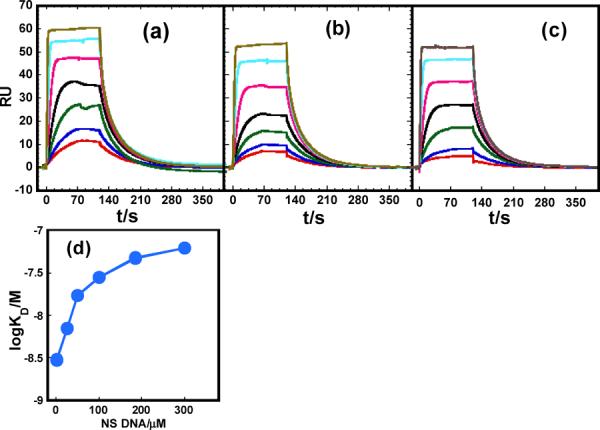
Effect of nonspecific DNA on apparent ETS-λB kinetics as observed by SPR. Sensorgrams for PU.1-GGAA-1 binding were acquired at 400 mM NaCl in the presence of (a) 100, (b) 185 and (c) 300 μM bp salmon sperm DNA as nonspecific DNA. The concentration of protein was 6, 8, 15, 25, 50, 100, 200 nM from bottom to top in each panel. (d) Apparent KD as a function of nonspecific DNA concentration.
Importantly, the addition of NS DNA enabled us to significantly expand the accessible salt range for PU.1 with the cognate DNA. In the presence of 100 μM bp NS DNA, we obtained steady-state KD values from (18 ± 2) nM to (329 ± 11) nM over the extended range of 250 to 600 mM NaCl (Table 2). The plot of log KD versus log [Na+] is linear and the KD values are in quantitative agreement with published filter binding experiments which used a comparable concentration of nonspecific DNA (~180 μM bp poly (dA-dT)).18 Although we were unable to directly determine equilibrium values below 250 mM NaCl, linear extrapolation of our measured log KD values gives excellent agreement with the filter binding values (Table 2).
Table 2.
SPR analysis of PU.1 ETS-DNA binding to the ?B site (GGAA-1) in the presence of salmon sperm DNA as nonspecific competitor.
| [Na+], mM | ka, M−1 s−1 | kd, s−1 | KD, nM | ||
|---|---|---|---|---|---|
| Kinetic fit | Steady-state | Filter bindinga | |||
| 100 | 0.9b | 0.543 ± 0.153 | |||
| 150 | 3.3b | 2.7 ± 0.4 | |||
| 250 | (3.2 ± 0.1) × 104 | 0.00059 ± 0.00002 | 18 ± 1 | 18 ± 2 | 40 ± 5.5 |
| 300 | (1.0 ± 0.1) × 105 | 0.0026 ± 0.0001 | 26 ± 4 | 28 ± 3 | |
| 350 | (7.7 ± 0.1) × 105 | 0.027 ± 0.001 | 34 ± 1 | 45 ± 4 | |
| 400 | (2.4 ± 0.1) × 106 | 0.18 ± 0.01 | 73 ± 1 | 63 ± 2 | |
| 450 | 94.4 ± 21.2 | ||||
| 500 | 92 ± 7 | ||||
| 600 | 329 ± 11 | ||||
Kinetics of ETS PU.1-DNA interactions in the presence of nonspecific DNA
We measured the kinetics of PU.1 ETS binding to the cognate GGAA-1 site at NaCl concentrations from 250 to 400 mM in the presence of 300 μM NS DNA (Figure 5). As in Figure 2, the experimental results are shown as black lines while the fits to a global 1:1 model with a mass transfer correction (Equation 6) are in red. The agreement between the experiment and the fitted lines is excellent. The association rate differences over this relatively small change in salt concentration are quite striking. We have used a limited salt concentration range because below 250 mM NaCl mass transfer in association and rebinding in dissociation limit kinetics measurements. At over 400 mM NaCl the rates become too fast for SPR methods and a significant part of the reaction occurs in the mixing phase. As described above, all possible methods to minimize mass transfer were used in these experiments: a T200 instrument that is optimized for kinetics studies, a high flow rate (100 μL/min, the instrument limit), a low DNA immobilization level, a limited salt concentration range to keep the rate constant in the allowed range for the T200 and a fitting function with a mass transfer for correction term. As shown in Figure S1, we always test for mass transfer by doing experiments at different flow rates to establish the usable salt concentration range.
Fig. 5.
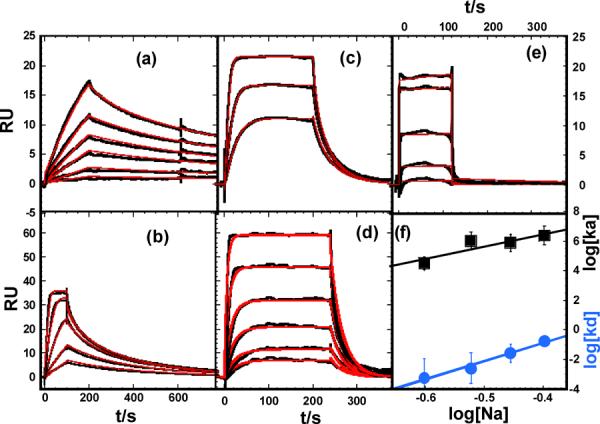
Salt dependent kinetics of PU.1 ETS-λB binding. Senorgrams were acquired in the presence of 300 μM bp salmon sperm DNA in buffer containing NaCl as follows: (a) 250 mM NaCl (10, 25, 50, 75, 100 and 150 nM PU.1 ETS from bottom to top), (b) 300 mM NaCl (25, 50, 100, 200 and 400 nM PU.1 ETS), (c) 350 mM NaCl (25, 50 and 100 nM), and (d) 400 mM NaCl (10, 25, 50, 100, 200 and 400 nM PU.1 ETS). For comparison, the sensorgram for (e) PU.1-AGAG binding in 250 mM NaCl (50, 100, 200, 400 and 1000 nM PU.1 ETS) is also shown. (f) Salt dependence of the association and dissociation rate constants.
At 250 mM NaCl, complex formation with the cognate GGAA-1 site is quite slow (ka = (3.2 ± 0.1) × 104 M−1 s−1) and the reaction does not reach steady-state within the experimental period (Figure 5). Once formed, the specific complex is very long lived (kd = (5.9 ± 0.2) × 10−4 s−1, corresponding to a half-life of >19 min.) The kinetics are also highly salt-dependent (Table 2). The association and rate constant increases ~75-fold from 250 to 400 mM NaCl. Over the same range, the dissociation rate constant increases ~300-fold, reducing the half-life of the complex to 4 s at 400 mM. Thus, the relatively modest change in equilibrium constant is the compensated result of large changes in kinetic behavior. Above 400 mM salt concentrations, the rates of complex formation become too fast to be directly analyzed by SPR kinetics and steady-state fits were used to determine the KD values (Table 2). In contrast, the kinetics for nonspecific binding to the AGAG sequence are very rapid (beyond instrumental resolution) at all salt concentrations, as in the case without added NS DNA.
Competitive displacement of PU.1 ETS binding: SPR analysis
In addition to probing protein-DNA interactions in direct binding experiments, we investigated the utility of SPR in displacement experiments. This experimental mode is valuable for SPR studies because multiple sequences can be characterized using only a single immobilized species. PU.1 is again a good model system for this study because variation in the bases flanking the core GGAA consensus gives rise to a wide dispersion of affinities while maintaining sequence specificity.14,17 In each experiment constant 100 nM protein solutions were injected over immobilized GGAA-2 (Figure 1) with other sequences in Figure 1 added at graded concentrations. GGAA-2 was used on the SPR surface in this experiment because it has shown the highest binding affinity for PU.1.17 When PU.1 is injected with other DNA sequences the SPR signal decreases with increasing injected DNA concentration (Figure 6a–d). The GGAA-1 hairpin duplex (Figure 1) showed decreased protein affinity compare to GGAA-2. The mutations in GGAA-3 (3'GTG→GAG) and GGAA-4 (3'GTG→TGG) at the 3' of the core sequence, however, have a strong negative effect on binding affinity (Figure 6e). These observations are in agreement with filter binding experiments17 and further demonstrate SPR as an analytical technique for protein-DNA interactions.
Fig. 6.
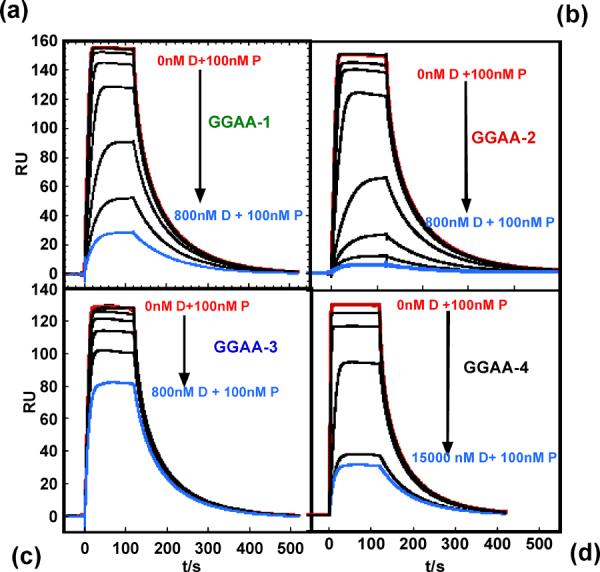
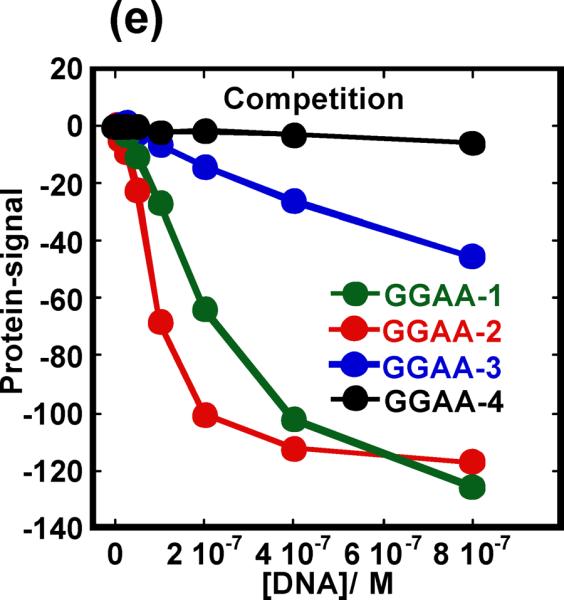
Competitive binding by PU.1 ETS to λB mutant sequences. PU.1-DNA competition experiments for (a) GGAA-1 (b) GGAA-2, (c) GGAA-3 and (d) GGAA-4. In each experiment 100 nM protein (P) was injected mixed with DNA site as indicated (D). Nonspecific DNA was present at 100 μM bp in the samples and running buffer (400 mM NaCl). (e) Plot of normalized protein signal vs DNA concentrations. The plot is truncated at 800nM DNA so that the strong competitors are better resolved. The actual experiment went to 15 μM DNA in Figure 6e.
Inhibition of ETS binding by a small molecule minor groove binder: Proof of concept
A key goal of our binding studies is to identify strong and specific inhibitors for this complex and to establish a method for use with PU.1 as well as other ETS proteins. More specifically, we are interested in whether relatively simple AT-specific minor groove binders can specifically inhibit ETS transcription factors that bind in the major groove at cognate sites near AT sequences. We chose distamycin, a well-characterized AT-specific minor groove binder, as an initial test system. PU.1 inhibition experiments are similar to those described for mutant DNAs as described above. At a protein concentration of 100 nM, increasing concentrations of distamycin suppressed the SPR signal and abolished it by > 95% at 1 μM distamycin (Figure 7). The residual signal is primarily due to distamycin binding in the minor groove of DNA as well as some nonspecific protein binding. This is a clear demonstration that minor grove binders, such as distamycin, are able to block the ability of the PU.1 protein to bind site specifically in the DNA major groove.
Fig. 7.
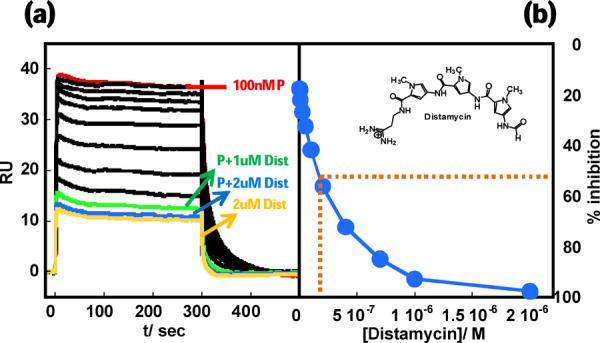
Displacement of PU.1 ETS from the λB site by distamycin. (a) A constant concentration (100 nM) of protein (P) was titrated with up to 2.0 μM distamycin (Dist) from top to bottom (400 mM NaCl). The bottom-most sensogram is for free distamycin (2 μM). (b) Inhibition of protein binding vs distamycin concentration.
Discussion
The transcriptional activity of PU.1 is directly correlated to its DNA-binding affinity and specificity.22 Our goals in using SPR to probe ETS-DNA binding are to gain insight into the mechanism of complex formation through their kinetics, and to establish an efficient, high-sensitivity experimental platform for identifying small molecules as tools to modify protein-DNA interfaces. These molecules may be developed into agents for regulating the transcriptional activity of ETS proteins with potential use in biotechnology and therapeutic applications. We have obtained binding kinetics of PU.1 with DNA sites derived from the λB Igλ2–4 enhancer, a natural PU.1 cognate binding site, using SPR techniques. Several studies have reported equilibrium binding constants from EMSA, filter binding, and fluorescence anisotropy experiments using radioactively or fluorescently labeled DNA sequences.16–20,36,37 SPR offers an alternative, label-free approach for the measurement of the thermodynamic as well as kinetic parameters of protein-DNA binding processes. There are limited SPR binding and kinetic studies on protein-DNA interactions since the binding strength and ionic effects involved in sequence-specific protein-DNA complexes present a challenge for biosensor-SPR methods. Indeed, an earlier study on kinetics of ETS-DNA using SPR was limited by sensitivity and mass transfer.21 Here we have mitigated mass transfer effects by the use of (i) low DNA immobilization levels, (ii) high injection flow rates, (iii) use of a T200 instrument that is optimized to minimize mass transfer and (iv) working in salt concentration ranges where mass transfer is minimized.32–34,38
The role of nonspecific DNA in SPR analysis of TF-DNA interactions
The kinetics of PU.1 ETS binding to the cognate site GGAA sites are dependent on salt concentration, and are modulated by the addition of a nonspecific (NS) competitor DNA. In the absence of NS DNA, very tight association of PU.1 with cognate DNA with slow dissociation kinetics and mass transfer effects prevented quantitative analysis of the kinetics at NaCl concentrations below 400 mM (Figure 2). The need for high salt concentrations in the absence of NS DNA has also been reported in a previous study of PU.1 ETS-DNA binding by SPR.21 At the single concentration of 650 mM NaCl examined, the on- and off-rate constants to another high-affinity site were (4.9 ± 1.2) × 105 M−1 s−1 and (0.085 ± 0.02) s−1, in close agreement with our data without NS DNA (Table 1).
Addition of NS DNA to the injection solution enabled experiments at lower salt concentration (down to 250 mM) and produced a more biologically relevant solution environment. It also gave results in excellent agreement with published thermodynamics in the presence of comparable concentrations of nonspecific DNA. Specifically, in the presence of NS DNA, the salt-dependence in the kinetically-determined KD for GGAA-1 (slope of 3.5 in Equation 7) agrees with the value obtained by filter binding studies under essentially identical solution conditions (Figure 3).18 Extrapolation down to 100 and 150 mM Na+ gave KD estimates of 0.9 and 3.33 nM, respectively, again in agreement with reported values.18 Finally, our competition experiments recapitulated the same rank order for a known series of PU.1 cognate variants.17 Thus, in the presence of NS DNA, the thermodynamics of interactions on the biosensor surface are experimentally indistinguishable from those in solution.
It is interesting that the results with NS DNA can still be fit within experimental error with 1:1 binding model under our experimental conditions. The effect of NS DNA in the injection solution on observed kinetics depends on many interacting factors but under our conditions the results may be interpreted as follows. Given the high flow rate (100 μl/min) used in our kinetics experiments and the short time the injected solution takes to move through the flow cells (the T200 SPR flow cell volume is 0.06 μl and the time to renew the solution inside flow cell is 0.036 s), the presence of excess NS DNA perturbs the observed binding to immobilized DNA primarily through the distribution of free and bound PU.1 ETS in a pre-equilibrium in the injection solution:
| (1) |
where [NS DNA] denotes the concentration of binding sites. Since, k−1/k1 = KD,NS, Equation (1) becomes:
| (1) |
Although our treatment neglects site depletion according to the McGhee-von Hippel model,39 this is a is reasonable approximation given the excess of NS binding sites and it predicts the parameters primarily affected by the presence of NS DNA. If the presence of NS DNA under our conditions is only to reduce the free protein concentration, as in Equation (2), ka and KD would predictably be the two parameters most affected for PU.1 binding to cognate DNA, while kd would not be changed. This is our observation at 400 mM NaCl where kinetic data with and without NS DNA are available (c.f. Tables 1 and 2). Our interpretation is also consistent with the observation that the effect of NS DNA on the apparent KD flattens out (Figure 4d), as the free protein concentration is reduced to a low level with increasing lattice sites.40 Since the primary effect of NS DNA under these experimental conditions is to decrease the free protein concentration, the 1:1 binding model still holds but with increased KD for PU.1 binding.
From Equation (1) we may also estimate the quantitative effect on ka and KD by the presence of NS DNA in the injection solution. The ratio of free-to-bound PU.1 (Φ) in the injection solution is approximated from the nonspecific dissociation constant and the concentration of NS DNA present. Although KD,NS for PU.1 and the mixed-polymeric salmon sperm DNA is not known, we may use the value for the noncognate AGAG site at 400 μM NaCl (1.1 μM, Table 1) as a low-end estimate. The concentration of effective lattice sites is also not known exactly, but is predictably lower than calculated simply based on site size alone (300 μM bp/10 bp site−1 ≈30 μM sites). We must therefore consider the resultant value of Φ ~ 0.04 to be a very low-end estimate. As expected, these assumptions over-estimate the effect of NS DNA on ka and KD (~10-fold only) at 400 mM NaCl. On the other hand, the dissociation rate constant (kd) is hardly altered, thus supporting our assignment of a pre-equilibrium effect to NS DNA. Obviously the effects of NS DNA will depend on the experimental conditions as well as the target DNA length and related factors. Clearly, additional kinetics studies under a wide array of conditions as well as with other proteins will be required for a full understanding of these important interactions.
Divergent kinetic properties of site recognition among ETS proteins
Previous studies have noted the modest salt dependence of equilibrium for high-affinity binding by PU.1.18,19 Our direct kinetic measurements reveal that this modest dependence is, in fact, the compensated result of much more pronounced changes in association and dissociation rate constants. Specifically, a relatively small increase from 250 to 400 mM NaCl increased the on- and off-rates by approximately 75- and 300-fold, respectively. At 250 mM NaCl, the lowest salt concentration used, the on-rate is strikingly low ((3.2 ± 0.1) × 104 M−1 s−1) and accompanied by a low off-rate ((5.9 ± 0.2) × 10−4 s−1) to give a half-life of ~20 min. These kinetics for PU.1 are in stark contrast with reported kinetics of minimal ETS domains from other ETS family members, namely Ets-1 and TEL (ETV6).41,42 The high-affinity binding of minimal ETS domains of both Ets-1 and TEL to cognate sites is driven by rapid association (>108 M−1 s−1 Ets-1; >107 M−1 s−1 for TEL) (Table 3). Such a profound difference cannot be attributed only to the different techniques or solution conditions used (which also contained comparable concentrations of nonspecific DNA), and suggest intrinsic differences in the biophysical mechanism of sequence recognition employed by these structurally conserved proteins.
Table 3. Kinetic profiles of reported high-affinity ETS-DNA interactions.
The values excerpted from the literature are for a construct most closely corresponding to the minimal ETS domains (i.e., minus autoinhibitory modules) that represent an appropriate counterpart to the PU.1 ETS domain. In cases where no error is stated in the table, none was reported.
| ETS domain | ka, M−1 s−1 | kA, s−1 | KD, nM | [salt], mM | Reference |
|---|---|---|---|---|---|
| PU.1 | (3.2 ±0.1) × 104 | (5.9 ±0.2) × 10−4 | 18 ± 1.5 | 250 (Na+) | This work |
| (4.9 ± 1.2) × 105 | (8.5 ± 2.0) × 10−2 | 170 ± 5 | 650 (Na+) | Pióet al.21a | |
| Ets-1 | 14 × 108 | 1.6 × 10⁻² | 0.0085 ± 0.0007 | 65 (K+) + 6 Mg2+ | Jonsen et al.42b |
| TEL (ETV6) | 8.7 × 10⁷ | ~0.2 | 2.3 ± 0.4 | 50 (K+) + 6 (Mg2+) | Green et al.41b |
No nonspecific DNA was used in this SPR study.
kd determined by EMSA; ka inferred by Equation 4.
A recent study employing osmotic stress as a hydration probe of PU.1-DNA binding demonstrates that a net, cooperative uptake of water is a characteristic feature of sequence-specific binding that tracks with overall affinity.19 Moreover; high-affinity binding is associated with a water-sequestering cavity at the core consensus, but not in a low-affinity complex with a suboptimal cognate site. The formation of this cavity and the attendant arrangement of ordered water molecules within it as PU.1 binds to its cognate site would be expected to limit the rate in specific complex formation. The unusually slow on-rates at the lowest salt concentrations tested are therefore consistent with this model. We also note the much faster association of PU.1 with a non-cognate sequence, which does not incorporate waters of hydration (c.f. Figures 5a and 5e), in agreement with the reduction in association rates by interfacial water. Under the conditions used with the PU.1 DNA binding domain and the cognate DNA sequences in Figure 1, fits to the experimental binding results with a 1:1 model are excellent (Figures 2 and 5). This agreement suggests that organization of the water interface and binding of PU.1 must occur in a concerted slow step. Processes after this step that are faster are not observed.
The demonstrated role of hydration in high-affinity PU.1-ETS binding is also corroborated by the PU.1 ETS-DNA cocrystal structure which shows a well-ordered network of water molecules lining the protein-DNA interface at the core consensus.13 In contrast, water-mediated contacts do not appear to play a major role in the corresponding structure for Ets-1.12,43 (A protein-DNA structure is not available for TEL.) If the structural data indeed reflect the solution behavior of these domains, they suggest at least two physical mechanisms of sequence recognition by ETS domain. One is a “low-water” mechanism (for Ets-1, TEL, and presumably others) in which the ETS domain docks rapidly to solvent-exposed contacts of the protein-DNA interface. The high rate of association is consistent with the unbound structures of Ets-144 and TEL (pdb = 2DAO, unpublished) which are essentially as they appear in the DNA-bound structure (for Ets-1). The other is a “waterlogged” mechanism (characteristic of PU.1) in which association is rate-limited by a slow process of arranging waters of hydration along the interface. A low entropic contribution, consistent with the latter mechanism, for high-affinity PU.1 ETS binding is well-established by calorimetric and noncalorimetric measurements.18,20 In addition, an NMR dynamic analysis of unbound PU.1 ETS found that the loop adjoining α2 and the recognition helix α3 exhibits motion on the seconds-to-hours' time scale.45 This independent observation dovetails into the expected need for some structural flexibility in the protein to accommodate the spatial requirements of interfacial waters required for optimal affinity.
Pharmacological modulation of ETS-DNA binding
ETS proteins are involved in the regulation of many genes of therapeutic interest. Over-expression of ETS family-associated gene fusions, for example, are increasingly recognized as pathological determinants in prostate cancer.27 In the immune system, PU.1 controls the expression of several key genes involved in inflammation.28 The use of small molecules to selectively disrupt the binding of PU.1 and other ETS proteins to ETS-dependent promoters represent a promising therapeutic approach to control their transcriptional activity.29 In addition, small molecules that could modulate transcription factor-DNA interfaces would allow for the chemical control of gene networks.26,46 With the explosion of information on the regulatory mechanisms for gene expression, including regulation circuits from noncoding DNA regions as recently shown by the ENCODE project,47 external control of gene regulation with small molecules is an under-utilized area for drug development.
Distamycin is a well characterized DNA minor groove binder which binds to A-track sequences of the type commonly found at the 5' side of the PU.1 binding site with a KD in the range of 10 nM.48 Our GGAA-1 sequence derived from the λB site of the Igλ2–4 enhancer has such an A-track at the 5' of GGAA. Under our experimental conditions, distamycin did not bind PU.1 ETS as we observed no significant spectrophotometric changes for distamycin in the presence of the protein (data not shown). The 5' region of the GGAA flanking sequence is excellent for initial testing since it appears less important to PU.1 binding than the 3' flanking sequence and, thus, may be the most difficult region for ETS protein inhibition. Success with this region would suggest that inhibition is possible with small molecules that are relatively easy to synthesize.
The results in Figure 7 clearly demonstrate the feasibility of inhibiting PU.1 ETS using minor groove binders in the 5' flanking sequence. The protein, as shown in the figure, binds with a very strong SPR signal (KD = 7 nM), only to give up that signal when injected with distamycin. The IC50 (concentration of distamycin required to inhibit 50% protein binding) is ~0.25 μM. Distamycin, a monocation polyamide, has a completely different mode of binding and cannot directly compete with protein for its cognate binding site in the major groove. Distamycin must therefore inhibit binding indirectly through an allosteric effect (Figure 8) as previously observed in different systems by Dervan and coworkers.49,50 Distamycin is apparently able to hold the DNA grooves and backbone in a conformation that prohibits DNA binding. Our results also demonstrate the potential of SPR biosensor methods in developing a biophysical assay platform for testing small molecule inhibitors for transcription factor. Targeting a major groove transcription factor with small molecules is a challenge with few successes in the literature. These results give us a development platform to design new agents to control the expression of transcription factors. A large set of synthetic molecules can now be tested to see how the structure of these compounds affects inhibition.
Fig. 8.
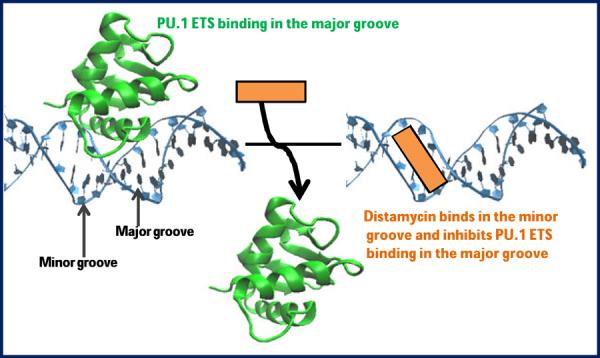
Model for allosteric inhibition of major groove protein by minor groove binder distamycin.
MATERIALS AND METHODS
DNAs, Protein and Buffer
Immobilized DNA was prepared from 5'-biotinylated, 25-bp hairpin duplex DNA from Integrated DNA Technologies (Figure 1). At the salt concentrations that we use (>250 mM), these DNAs are long enough so that end effects on PU.1 binding are negligible.31,51,52 Salmon sperm DNA was purchased from Worthington Biochemical Corporation. Solutions for SPR were prepared in degassed 25 mM sodium phosphate buffer (Na2HPO4) of pH 7.4 containing 1 mM ethylenediaminetetraacetic acid (EDTA), 0.05% P20 and variable NaCl concentrations. The ETS domain of murine PU.1 (residues 167 to 272) was over-expressed in E. coli and purified as described.19 Purified PU.1 ETS domain was stored at 4°C in 10 mM Na2HPO4/NaH2PO4 buffer, pH 7.4, containing 0.5 M NaCl. Under this condition, the protein exhibited no loss of specific binding over at least several weeks.
Biosensor SPR
SPR measurements were performed with a four-channel Biacore T200 biosensor system that is optimized to minimize mass transfer effects. 5'-Biotin-labeled DNA samples (Figure 1) were captured with streptavidin on either sensor chips SA from Biacore or with CM4 carboxymethyl dextran chips on which the carboxymethyl groups were activated and coupled with streptavidin by amine linkages33. One flow cell was left blank as a control while others functionalized with a DNA sequence. SA chips were used for preliminary studies to establish conditions for the experiments and approximately 800 RUs (RU, response units) of DNA were immobilized on those surfaces. To minimize chip surface charge effects as well as mass transfer effects, low-charge CM4 chips were used for all other studies. If the rate of mass transfer of the protein to the sensor surface is significantly slower than the association rate, the observed kinetics can be distorted by mass transfer. To minimize mass transfer a low amount of DNA should be immobilized and only about 100 RUs of DNA were immobilized for kinetics studies. In addition, high flow rates minimize mass transfer effects by keeping a constant injected concentration of the protein at the chip surface and the protein was injected at the maximum flow rate of 100 μL/min. The data were fit using Biaevaluation software to a function with a mass transfer correction term (Equation 6) to help correct for any residual mass transfer effects. Finally, it is possible to test for any residual mass transfer influence on the kinetics by determining rate constants at different flow rates. Under the conditions reported in Tables 1 and 2 we found no difference outside of experimental variation in kinetics constants at flow rates above 25 μL/min, indicating that our results are true kinetics constants.32–38
The interactions were evaluated with several levels of nonspecific binding salmon sperm DNA. The reference response from the blank cell was subtracted from the response in each cell containing DNA to give a signal that is directly proportional to the amount of bound protein. Steady-state binding results from the SPR experiments were fitted with a single-site model:
| (2) |
where r (stoichiometry) represents the moles of bound protein per mole of DNA hairpin duplex, K is binding constant, and Cfree is the free protein concentration in equilibrium with the complex. The stoichiometry r of the reaction is calculated as follows:
| (3) |
RU is the observed (experimental) response in the plateau region and RUmax is the predicted maximum response for a monomer protein binding to a nucleic acid site.33 Dividing the observed steady-state response RU by the calculated RUmax yields a stoichiometry normalized binding isotherm.
Kinetic analysis was performed by global fitting of the binding data with mass transport limited kinetic binding model (Equation 6)38:
| (4) |
Before injection, [A]t=0 = 0, [B]t=0 = RUmax, [AB]t=0 = 0.
After injection: all are time dependent until steady-state is reached.
For association:
For dissociation:
where [A] is the concentrations of the protein at the sensor surface, [B] is the concentration of the immobilized DNA without bound protein and [AB] is the concentration of the complex; ka is the association and kd the dissociation rate constant. If mass transfer is significant, the protein concentration in the injected solution, Abulk is not the same as protein concentration at the surface, A and an additional term is needed to correct for this effect.38.
| (6) |
where [A] and [Abulk] are the concentrations of the protein at the sensor surface and in the bulk solution, respectively; kt is mass transport coefficient.
For the distamycin inhibition studies, protein was injected at a constant concentration of 100 nM onto the surface to make sure that all the DNA binding sites are saturated before adding distamycin. Increasing concentrations of distamycin was added and the change in protein signal was observed, which was then plotted against compound concentration. The midpoint of the transition in the plot is used as IC50 (compound required to achieve 50% protein inhibition) value.
Calculation of number of phosphate contacts
DNA polyelectrolyte theory35 was used to interpret the quantitative dependence of the binding constant on salt activity to give the number of phosphate contacts, Z in a DNA complex:
| (7) |
Where KD = 1/KA is observed equilibrium dissociation constant at each salt activity [M+] and Ψ is 0.88 for double-stranded B-DNA.
Supplementary Material
Highlights
PU.1 ETS is a transcription factor, which binds to specific DNA sequences and controls gene expression in cells.
The DNA binding kinetics of PU.1 ETS are strongly salt-dependent but mutually balanced to produce a relatively moderate dependence in the equilibrium constant.
We propose therefore at least two mechanisms of sequence recognition for this family.
We also demonstrate pharmacological inhibition of sequence-specific ETS binding, using distamycin as a model compound.
We show biosensor surface plasmon resonance results agree quiet well with solution methods for DNA-transcription factor complexes.
Acknowledgement
This investigation was financially supported by NIH NIAID grant AI064200 (W.D.W) as well as American Cancer Society Institutional Research Grant IRG-77-003-27 and the College of Pharmacy, Washington State University (G.M.K.P.)
ABBREVIATIONS
- SPR
Surface plasmon resonance
- NS
Nonspecific
- EMSA
Electrophoretic mobility shift assay
Footnotes
Publisher's Disclaimer: This is a PDF file of an unedited manuscript that has been accepted for publication. As a service to our customers we are providing this early version of the manuscript. The manuscript will undergo copyediting, typesetting, and review of the resulting proof before it is published in its final citable form. Please note that during the production process errors may be discovered which could affect the content, and all legal disclaimers that apply to the journal pertain.
References
- 1.Degnan BM, Degnan SM, Naganuma T, Morse DE. The ets multigene family is conserved throughout the Metazoa. Nucleic Acids Res. 1993;21:3479–84. doi: 10.1093/nar/21.15.3479. [DOI] [PMC free article] [PubMed] [Google Scholar]
- 2.Hollenhorst PC, McIntosh LP, Graves BJ. Genomic and biochemical insights into the specificity of ETS transcription factors. Annu Rev Biochem. 2011;80:437–71. doi: 10.1146/annurev.biochem.79.081507.103945. [DOI] [PMC free article] [PubMed] [Google Scholar]
- 3.Agarkar VB, Babayeva ND, Wilder PJ, Rizzino A, Tahirov TH. Crystal structure of mouse Elf3 C-terminal DNA-binding domain in complex with type II TGF-beta receptor promoter DNA. J Mol Biol. 2010;397:278–89. doi: 10.1016/j.jmb.2010.01.017. [DOI] [PMC free article] [PubMed] [Google Scholar]
- 4.Batchelor AH, Piper DE, de la Brousse FC, McKnight SL, Wolberger C. The structure of GABPα/β: an ETS domain-ankyrin repeat heterodimer bound to DNA. Science. 1998;279:1037–41. doi: 10.1126/science.279.5353.1037. [DOI] [PubMed] [Google Scholar]
- 5.Escalante CR, Brass AL, Pongubala JMR, Shatova E, Shen L, Singh H, Aggarwal AK. Crystal Structure of PU.1/IRF-4/DNA Ternary Complex. Mol Cell. 2002;10:1097–1105. doi: 10.1016/s1097-2765(02)00703-7. [DOI] [PubMed] [Google Scholar]
- 6.Hassler M, Richmond TJ. The B-box dominates SAP-1-SRF interactions in the structure of the ternary complex. EMBO J. 2001;20:3018–28. doi: 10.1093/emboj/20.12.3018. [DOI] [PMC free article] [PubMed] [Google Scholar]
- 7.Mo Y, Vaessen B, Johnston K, Marmorstein R. Structure of the elk-1-DNA complex reveals how DNA-distal residues affect ETS domain recognition of DNA. Nat Struct Biol. 2000;7:292–7. doi: 10.1038/74055. [DOI] [PubMed] [Google Scholar]
- 8.Mo Y, Vaessen B, Johnston K, Marmorstein R. Structures of SAP-1 bound to DNA targets from the E74 and c-fos promoters: insights into DNA sequence discrimination by Ets proteins. Mol Cell. 1998;2:201–12. doi: 10.1016/s1097-2765(00)80130-6. [DOI] [PubMed] [Google Scholar]
- 9.Wang Y, Feng L, Said M, Balderman S, Fayazi Z, Liu Y, Ghosh D, Gulick AM. Analysis of the 2.0 A crystal structure of the protein-DNA complex of the human PDEF Ets domain bound to the prostate specific antigen regulatory site. Biochemistry. 2005;44:7095–106. doi: 10.1021/bi047352t. [DOI] [PubMed] [Google Scholar]
- 10.Babayeva ND, Wilder PJ, Shiina M, Mino K, Desler M, Ogata K, Rizzino A, Tahirov TH. Structural basis of Ets1 cooperative binding to palindromic sequences on stromelysin-1 promoter DNA. Cell Cycle. 2010;9:3054–62. doi: 10.4161/cc.9.15.12257. [DOI] [PMC free article] [PubMed] [Google Scholar]
- 11.Escalante CR, Brass AL, Pongubala JM, Shatova E, Shen L, Singh H, Aggarwal AK. Crystal structure of PU.1/IRF-4/DNA ternary complex. Mol Cell. 2002;10:1097–105. doi: 10.1016/s1097-2765(02)00703-7. [DOI] [PubMed] [Google Scholar]
- 12.Werner MH, Clore M, Fisher CL, Fisher RJ, Trinh L, Shiloach J, Gronenborn AM. The solution structure of the human ETS1-DNA complex reveals a novel mode of binding and true side chain intercalation. Cell. 1995;83:761–71. doi: 10.1016/0092-8674(95)90189-2. [DOI] [PubMed] [Google Scholar]
- 13.Kodandapani R, Pio F, Ni CZ, Piccialli G, Klemsz M, McKercher S, Maki RA, Ely KR. A new pattern for helix-turn-helix recognition revealed by the PU.1 ETS-domain-DNA complex. Nature. 1996;380:456–60. doi: 10.1038/380456a0. [DOI] [PubMed] [Google Scholar]
- 14.Szymczyna BR, Arrowsmith CH. DNA binding specificity studies of four ETS proteins support an indirect read-out mechanism of protein-DNA recognition. J Biol Chem. 2000;275:28363–70. doi: 10.1074/jbc.M004294200. [DOI] [PubMed] [Google Scholar]
- 15.Wei GH, Badis G, Berger MF, Kivioja T, Palin K, Enge M, Bonke M, Jolma A, Varjosalo M, Gehrke AR, Yan J, Talukder S, Turunen M, Taipale M, Stunnenberg HG, Ukkonen E, Hughes TR, Bulyk ML, Taipale J. Genome-wide analysis of ETS-family DNA-binding in vitro and in vivo. EMBO J. 2010;29:2147–60. doi: 10.1038/emboj.2010.106. [DOI] [PMC free article] [PubMed] [Google Scholar]
- 16.Poon GM, Groß P, Macgregor RB., Jr. The sequence-specific association of the ETS domain of murine PU.1 with DNA exhibits unusual energetics. Biochemistry. 2002;41:2361–71. doi: 10.1021/bi015572q. [DOI] [PubMed] [Google Scholar]
- 17.Poon GM, Macgregor RB., Jr. Base coupling in sequence-specific site recognition by the ETS domain of murine PU.1. J Mol Biol. 2003;328:805–19. doi: 10.1016/s0022-2836(03)00362-0. [DOI] [PubMed] [Google Scholar]
- 18.Poon GM, Macgregor RB., Jr. A thermodynamic basis of DNA sequence selectivity by the ETS domain of murine PU.1. J Mol Biol. 2004;335:113–27. doi: 10.1016/j.jmb.2003.09.046. [DOI] [PubMed] [Google Scholar]
- 19.Poon GMK. Sequence Discrimination by DNA-binding Domain of ETS Family Transcription Factor PU.1 Is Linked to Specific Hydration of Protein-DNA Interface. J Biol Chem. 2012;287:18297–18307. doi: 10.1074/jbc.M112.342345. [DOI] [PMC free article] [PubMed] [Google Scholar]
- 20.Poon GMK. DNA Binding Regulates the Self-Association of the ETS Domain of PU.1 in a Sequence-Dependent Manner. Biochemistry. 2012;51:4096–4107. doi: 10.1021/bi300331v. [DOI] [PubMed] [Google Scholar]
- 21.Pió F, Assa-Munt N, Yguerabide J, Maki RA. Mutants of ETS domain PU.1 and GGAA/T recognition: free energies and kinetics. Protein Sci. 1999;8:2098–109. doi: 10.1110/ps.8.10.2098. [DOI] [PMC free article] [PubMed] [Google Scholar]
- 22.He X, Coombs D, Myszka DG, Goldstein B. A theoretical and experimental study of competition between solution and surface receptors for ligand in a Biacore flow cell. Bull Math Biol. 2006;68:1125–50. doi: 10.1007/s11538-006-9093-9. [DOI] [PubMed] [Google Scholar]
- 23.Blaesing F, Weigel C, Welzeck M, Messer W. Analysis of the DNA-binding domain of Escherichia coli DnaA protein. Mol Microbiol. 2000;36:557–69. doi: 10.1046/j.1365-2958.2000.01881.x. [DOI] [PubMed] [Google Scholar]
- 24.Bondeson K, Frostell-Karlsson A, Fagerstam L, Magnusson G. Lactose repressor-operator DNA interactions: kinetic analysis by a surface plasmon resonance biosensor. Anal Biochem. 1993;214:245–51. doi: 10.1006/abio.1993.1484. [DOI] [PubMed] [Google Scholar]
- 25.Goeddel DV, Yansura DG, Caruthers MH. Binding of synthetic lactose operator DNAs to lactose represessors. Proc Natl Acad Sci U S A. 1977;74:3292–6. doi: 10.1073/pnas.74.8.3292. [DOI] [PMC free article] [PubMed] [Google Scholar]
- 26.Darnell JE., Jr. Transcription factors as targets for cancer therapy. Nat Rev Cancer. 2002;2:740–9. doi: 10.1038/nrc906. [DOI] [PubMed] [Google Scholar]
- 27.Raskatov JA, Nickols NG, Hargrove AE, Marinov GK, Wold B, Dervan PB. Gene expression changes in a tumor xenograft by a pyrrole-imidazole polyamide. Proc Natl Acad Sci U S A. 109:16041–5. doi: 10.1073/pnas.1214267109. [DOI] [PMC free article] [PubMed] [Google Scholar]
- 28.Bashkin JK, Aston K, Ramos JP, Koeller KJ, Nanjunda R, He G, Dupureur CM, David Wilson W. Promoter scanning of the human COX-2 gene with 8-ring polyamides: Unexpected weakening of polyamide-DNA binding and selectivity by replacing an internal N-Me-pyrrole with beta-alanine. Biochimie. doi: 10.1016/j.biochi.2012.09.023. [DOI] [PMC free article] [PubMed] [Google Scholar]
- 29.Nhili R, Peixoto P, Depauw S, Flajollet S, Dezitter X, Munde MM, Ismail MA, Kumar A, Farahat AA, Stephens CE, Duterque-Coquillaud M, David Wilson W, Boykin DW, David-Cordonnier MH. Targeting the DNA-binding activity of the human ERG transcription factor using new heterocyclic dithiophene diamidines. Nucleic Acids Res. 41:125–38. doi: 10.1093/nar/gks971. [DOI] [PMC free article] [PubMed] [Google Scholar]
- 30.Eisenbeis CF, Singh H, Storb U. PU.1 is a component of a multiprotein complex which binds an essential site in the murine immunoglobulin lambda 2–4 enhancer. Mol Cell Biol. 1993;13:6452–61. doi: 10.1128/mcb.13.10.6452. [DOI] [PMC free article] [PubMed] [Google Scholar]
- 31.Allison SA. End Effects in Electrostatic Potentials of Cylinders: Models for DNA Fragments. J. Phys. Chem. 1994;98:12091–12096. [Google Scholar]
- 32.Rich RL, Myszka DG. Survey of the 2009 commercial optical biosensor literature. J Mol Recognit. 24:892–914. doi: 10.1002/jmr.1138. [DOI] [PubMed] [Google Scholar]
- 33.Nanjunda R, Munde M, Liu Y, Wilson WD. Real-time monitoring of nucleic acid interactions with Biosensor Plasmon Resonance in the book, Methods for Studying DNA/Drug Interactions. CRC. 2011;392 [Google Scholar]
- 34.Myszka DG. Kinetic, equilibrium, and thermodynamic analysis of macromolecular interactions with BIACORE. Methods Enzymol. 2000;323:325–40. doi: 10.1016/s0076-6879(00)23372-7. [DOI] [PubMed] [Google Scholar]
- 35.Record MT, Jr., Anderson CF, Lohman TM. Thermodynamic analysis of ion effects on the binding and conformational equilibria of proteins and nucleic acids: the roles of ion association or release, screening, and ion effects on water activity. Q Rev Biophys. 1978;11:103–78. doi: 10.1017/s003358350000202x. [DOI] [PubMed] [Google Scholar]
- 36.Yee AA, Yin P, Siderovski DP, Mak TW, Litchfield DW, Arrowsmith CH. Cooperative interaction between the DNA-binding domains of PU.1 and IRF4. J Mol Biol. 1998;279:1075–83. doi: 10.1006/jmbi.1998.1838. [DOI] [PubMed] [Google Scholar]
- 37.McKercher SR, Lombardo CR, Bobkov A, Jia X, Assa-Munt N. Identification of a PU.1-IRF4 protein interaction surface predicted by chemical exchange line broadening. Proc Natl Acad Sci U S A. 2003;100:511–6. doi: 10.1073/pnas.0136910100. [DOI] [PMC free article] [PubMed] [Google Scholar]
- 38.Karlsson R. Affinity analysis of non-steady-state data obtained under mass transport limited conditions using BIAcore technology. J Mol Recognit. 1999;12:285–92. doi: 10.1002/(SICI)1099-1352(199909/10)12:5<285::AID-JMR469>3.0.CO;2-Y. [DOI] [PubMed] [Google Scholar]
- 39.McGhee JD, von Hippel PH. Theoretical aspects of DNA-protein interactions: co-operative and non-co-operative binding of large ligands to a one-dimensional homogeneous lattice. J Mol Biol. 1974;86:469–89. doi: 10.1016/0022-2836(74)90031-x. [DOI] [PubMed] [Google Scholar]
- 40.Kowalczykowski SC, Paul LS, Lonberg N, Newport JW, McSwiggen JA, von Hippel PH. Cooperative and noncooperative binding of protein ligands to nucleic acid lattices: experimental approaches to the determination of thermodynamic parameters. Biochemistry. 1986;25:1226–40. doi: 10.1021/bi00354a006. [DOI] [PubMed] [Google Scholar]
- 41.Green SM, Coyne HJ, 3rd, McIntosh LP, Graves BJ. DNA binding by the ETS protein TEL (ETV6) is regulated by autoinhibition and self-association. J Biol Chem. 2010;285:18496–504. doi: 10.1074/jbc.M109.096958. [DOI] [PMC free article] [PubMed] [Google Scholar]
- 42.Jonsen MD, Petersen JM, Xu QP, Graves BJ. Characterization of the cooperative function of inhibitory sequences in Ets-1. Mol Cell Biol. 1996;16:2065–73. doi: 10.1128/mcb.16.5.2065. [DOI] [PMC free article] [PubMed] [Google Scholar]
- 43.Werner MH, Clore GM, Fisher CL, Fisher RJ, Trinh L, Shiloach J, Gronenborn AM. Correction of the NMR structure of the ETS1/DNA complex. J Biomol NMR. 1997;10:317–28. doi: 10.1023/a:1018399711996. [DOI] [PubMed] [Google Scholar]
- 44.Donaldson LW, Petersen JM, Graves BJ, McIntosh LP. Solution structure of the ETS domain from murine Ets-1: a winged helix-turn-helix DNA binding motif. EMBO J. 1996;15:125–34. [PMC free article] [PubMed] [Google Scholar]
- 45.Jia X, Lee LK, Light J, Palmer AG, 3rd, Assa-Munt N. Backbone dynamics of a short PU.1 ETS domain. J Mol Biol. 1999;292:1083–93. doi: 10.1006/jmbi.1999.3123. [DOI] [PubMed] [Google Scholar]
- 46.Koehler AN. A complex task? Direct modulation of transcription factors with small molecules. Curr Opin Chem Biol. 14:331–40. doi: 10.1016/j.cbpa.2010.03.022. [DOI] [PMC free article] [PubMed] [Google Scholar]
- 47.Ecker JR, Bickmore WA, Barroso I, Pritchard JK, Gilad Y, Segal E. Genomics: ENCODE explained. Nature. 489:52–5. doi: 10.1038/489052a. [DOI] [PubMed] [Google Scholar]
- 48.Wang S, Munde M, Wilson WD. Minor groove to major groove, an unusual DNA sequence-dependent change in bend directionality by a distamycin dimer. Biochemistry. 50:7674–83. doi: 10.1021/bi201010g. [DOI] [PMC free article] [PubMed] [Google Scholar]
- 49.Chenoweth DM, Dervan PB. Allosteric modulation of DNA by small molecules. Proc Natl Acad Sci U S A. 2009;106:13175–9. doi: 10.1073/pnas.0906532106. [DOI] [PMC free article] [PubMed] [Google Scholar]
- 50.Moretti R, Donato LJ, Brezinski ML, Stafford RL, Hoff H, Thorson JS, Dervan PB, Ansari AZ. Targeted chemical wedges reveal the role of allosteric DNA modulation in protein-DNA assembly. ACS Chem Biol. 2008;3:220–9. doi: 10.1021/cb700258r. [DOI] [PMC free article] [PubMed] [Google Scholar]
- 51.Stein VM, Bond JP, Capp MW, Anderson CF, Record MT., Jr. Importance of coulombic end effects on cation accumulation near oligoelectrolyte B-DNA: a demonstration using 23Na NMR. Biophys J. 1995;68:1063–72. doi: 10.1016/S0006-3495(95)80281-X. [DOI] [PMC free article] [PubMed] [Google Scholar]
- 52.Feig M, Pettitt BM. Sodium and chlorine ions as part of the DNA solvation shell. Biophys J. 1999;77:1769–81. doi: 10.1016/S0006-3495(99)77023-2. [DOI] [PMC free article] [PubMed] [Google Scholar]
Associated Data
This section collects any data citations, data availability statements, or supplementary materials included in this article.