
Figure 3. Nuclear Accumulation of Thymocytes’ Endogenous NFATc1 in Positively Selecting Thymi.
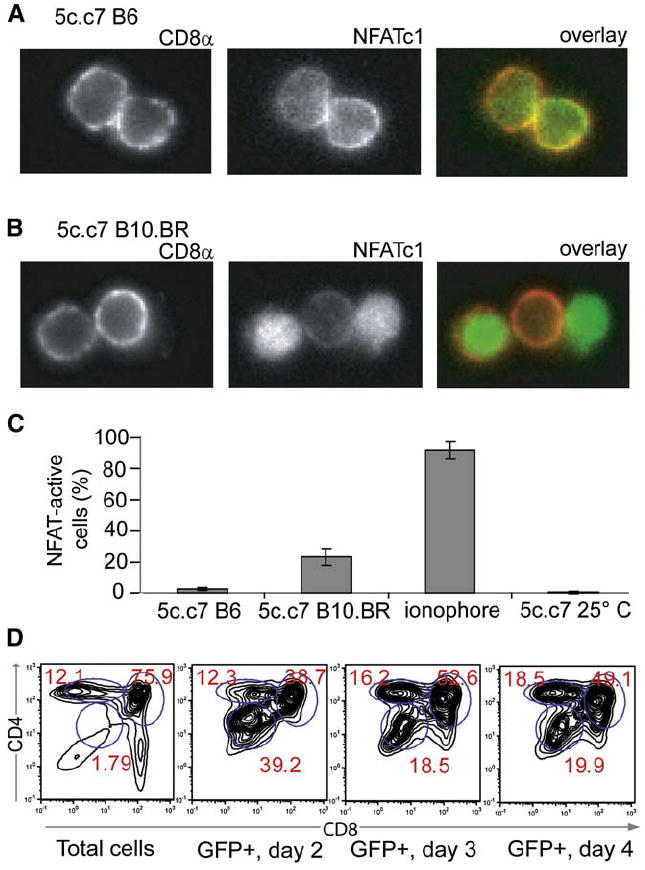
(A) Thymi were dissected from 5c.c7 B6 mice and thymocytes were liberated directly into 4% paraformaldehyde. Fixed cells were then permeabilized and stained with anti-CD8α PE and mouse anti-NFATc1 and then goat anti-mouse Alexa 488. The left panel shows CD8α staining, the middle panel shows NFATc1 staining, and the right panel shows an overlay with CD8α staining in red and NFATc1 staining in green.
(B) 5c.c7 B10.BR thymocytes were isolated and stained as in (A).
(C) Summary of data from (A) and (B), and for 5c.c7 B6 thymocytes treated with the ionophore A23187 for 10 min prior to fixation, or thymi allowed to rest in RT PBS for 5 min prior to thymocyte liberation and fixation. Data are expressed as the proportion (mean ± standard deviation) of CD8+ cells with nuclear NFAT accumulation (>50% nuclear Alexa 488 staining, n > 300) from two mice for each condition.
(D) NFAT transcriptional activity correlates with thymocyte maturation in vivo. 5c.c7 DP thymocytes transduced with NFAT-promoter-driven GFP were injected intrathymically into B10.BR recipients; 5 × 10⁷ thymocytes were prepared from recipient mice at the indicated days after injection, stained for surface expression of CD4 and CD8, and analyzed by flow cytometry. Shown are the CD4-CD8 profiles of total ungated cells (first panel) or cells gated for expression of NFAT-driven GFP on day 2 (second panel), day 3 (third panel), and day 4 (fourth panel) after intrathymic injection. Each profile is representative of two to three mice.