

Abstract
Zebrafish embryos have been extensively used to study heart development and cardiac function, mainly due to the unique embryology and genetics of this model organism. Since most human heart disease occurs during adulthood, adult zebrafish models of heart disease are being created to dissect mechanisms of the disease and discover novel therapies. However, due to its small heart size, the use of cardiac functional assays in the adult zebrafish has been limited. To address this bottleneck, the transparent fish line casper;Tg(cmlc2:nuDsRed) that has a red fluorescent heart can be used to document beating hearts in vivo and to quantify cardiac functions in adult zebrafish. Here, we describe our methods for quantifying shortening fraction and heart rate in embryonic zebrafish, as well as in the juvenile and adult casper;Tg(cmlc2:nuDsRed) fish. In addition, we describe the red blood cell flow rate assay that can be used to reflect cardiac function indirectly in zebrafish at any stage.
Keywords: Zebrafish, Physiology, Shortening fraction, Heart rate, Flow rate
1. Introduction
Uniquely suitable for developmental and chemical genetic studies, the zebrafish is quickly becoming a popular model organism for studying cardiogenesis and heart disease (1, 2). The zebrafish embryo develops ex utero in a clear sac (the chorion), has a beating heart (including an outflow tract, a ventricle, and an atrium) by 24 h postfertilization, and hatches on day 3–4 postfertilization (3). Due to the embryo’s transparency, heart growth and cardiac function can be studied at single-cell resolution. Morpholino knockdown and mRNA overexpression are two convenient tools to study gene function during embryogenesis (4). Stable knockout fish can also be established via TILLING or zinc finger nuclease (ZFN)-based technology (5–7). Unlike in cardiac gene knockout mouse models, zebrafish knockout phenotypes will not be complicated by secondary defects associated with lack of oxygen, because their small body size allows adequate oxygenation by diffusion without a beating heart for the first 5 days (8). The Tol2 transposon system allows novel genetic lines to be created in 50–70% of embryos injected (9), making zebrafish a very convenient model organism to generate transgenics (2). Like Drosophila, zebrafish is the only vertebrate model that is feasible to perform a mutagenesis screen in a standard lab (10, 11). Hundreds of cardiac mutants have already been identified, and cloning of the corresponding genes has revealed insights in both heart development and cardiac function (3, 12–14). Once established, the zebrafish-based disease models can be utilized for rapid and efficient downstream modifier screens or small molecule discovery efforts, with the goal of identifying new therapies (15–19).
Since most heart disease, such as cardiomyopathy and heart failure, occurs in adulthood (20), it is important to establish adult zebrafish models of heart disease and cardiac functional assays. Cardiomyopathy-like responses do exist in the adult zebrafish, as has been reported in the anemia-induced cardiac hypertrophy model tr265 (21). Simplified ECG technology has been developed to monitor heart beating in the adult zebrafish heart, and electrophysiological studies have revealed adult zebrafish have similar action potentials as humans (22, 23). Due to the small size of the adult zebrafish heart (about 1 mm in diameter), the resolution of classic ultrasound-based technology is not satisfactory for reliable measurements of shortening fraction. A high-frequency ultrasound system for use in small animals has been developed, but can only reach a resolution of 25 μm (24, 25). Optical coherence tomography, with a higher resolution of 9–23 μm, has been applied to quantify cardiac functions in Xenopus, chicken embryos, and Drosophila (26–28). It remains unclear whether this technology will be useful to quantify cardiac functions in adult zebrafish.
We have taken advantage of the relatively transparent casper zebrafish line to develop a tool that allows us to quantify cardiac functions in adult zebrafish. The casper line contains two mutated genes (nacre and roy lines) that inhibit the formation of melanocytes and iridophores, which give the fish a certain degree of transparency into adulthood (29). To improve imaging of the heart, we crossed the casper line to Tg(cmlc2:nuDsRed) (30), which has a red fluorescent heart. A beating heart can be observed during the lifespan of the casper;Tg(cmlc2:nuDsRed) fish, which allows one to quantify shortening fraction as well as heart rate in vivo in both the embryo and adult zebrafish. In this chapter, we describe our imaging-based, cardiac function quantification methods in both embryos and adults. In addition, we have included the red blood cell flow rate assay that can be used in most fish as an indirect measure of cardiac function (21, 31).
2. Materials
1× E3: 60 mL 5 M NaCl, 10 mL 1 M KCl, 20 mL 1 M CaCl2, and 20 mL 1 M MgSO4 are mixed with 890 mL ddH2O. pH is adjusted to 7 based on (32).
5 mM (10×) PTU: 0.76 g 1-Phenyl-2-thiourea (Sigma, St. Louis, MO) is added to 1 L of E3 in a glass bottle wrapped in tin foil. For 1× PTU, dilute 50 mL stock solution in 450 mL E3 in a glass bottle wrapped in tin foil. Both solutions can be stored at room temperature (see Note 1).
25× Tricaine solution: 400 mg Tricaine powder (Aquatic Eco-Systems, Inc., Apopka, FL) is mixed with 97.9 mL ddH2O and 2.1 mL 1 M Tris (pH 9). pH is adjusted to 7. The stock solution is stored in the freezer. For 1× Tricaine, 4.2 mL 25× Tricaine solution is diluted in 96 mL E3 based on (32). Working solution can be stored at room temperature for up to 1 week.
3% Methyl Cellulose: 15 mg Methyl Cellulose (Sigma) is added to 500 mL ddH2O and agitated at 80°C until the particles have dissolved and dispersed. After aliquoting, store at 4°C. Use at room temperature.
Equipment: light and fluorescent microscopes connected to a digital camera.
3. Methods
Videos taken of the zebrafish hearts in vivo are used to calculate shortening fraction and heart rate, while the red blood cell flow rate assay consists of direct observation and a picture of the area observed. Shortening fraction and heart rate can be calculated in most fish lines until 4 weeks postfertilization, when pigmentation of the skin begins to obscure direct observation of the heart. The casper;Tg(cmlc2:nuDsRed) line allows the documentation of a beating heart in fish beyond 4 weeks through adulthood. In fact, we have been able to image fish at 10 months by selecting those fish that have less opaque skin. Because of the limited fluorescence in the atrium of the casper;Tg(cmlc2:nuDsRed) fish, only the shortening fraction for the ventricle is measured. Ventricular shortening fraction is calculated from maximum diastole and maximum systole measurements. Although not discussed in this chapter, a software program is now available to semiautomate the analysis of shortening fraction in larvae, as well as calculate other parameters associated with the heart (33, 34). Heart rate can be directly observed throughout the lifespan of the casper;Tg(cmlc2:nuDsRed) fish by counting the beats in 15 s and extrapolating it to beats per minute. Unlike shortening fraction and heart rate, the red blood cell flow rate can be obtained in most zebrafish during embryogenesis and adulthood. Red blood cell flow rate (mm/s) is found by timing a red blood cell between two specified points and dividing the distance by the time.
Our basic setup consists of a Nikon COOLPIX 8700 digital camera (Melville, NY) connected to either a Zeiss Axioplan two microscope (Carl Zeiss, Thornwood, NY) with differential interference contrast for embryological studies or a Leica MZ FLI III fluorescence stereomicroscope (Bannockburn, IL) for older fish. The video files obtained are in QuickTime (.MOV) at 30 frames per second (see Note 2) and picture files are in JPEG. For quantification, a millimeter ruler should be recorded in a video or picture, depending on which assay is used: video for the shortening fraction assay or a JPEG image for the red blood cell flow rate assay. Directions for quantifying distances and areas using the free graphical analysis software ImageJ (National Institutes of Health, Bethesda, MD) are included in the protocols below. To reduce variation in the assays, at least six different fish should be analyzed. Three separate data per fish should be obtained and averaged. The final average (reflecting all the averages in the group tested) and standard deviation are suggested for reporting in publications.
3.1. Heart Imaging of Zebrafish Up to Four Weeks Old
Tricaine fish for a desired amount of time before placing on a microscope slide in a thin layer of Methyl Cellulose or E3 water (see Notes 1 and 3–5).
Position the fish horizontally to obtain a lateral view under a microscope connected to a digital camera (see Note 2). The right eye should be facing downward for optimal viewing of the heart (see Fig. 1a).
Choose a magnification such that the heart fills at least 50% of the camera screen (e.g., up to 400× for embryological studies and as low as 50× for older fish) (see Fig. 1b).
Record the heart beating for at least 15 s.
For cross-sectional area and volume measurements, take a video of a millimeter ruler at the same magnification.
If Methyl Cellulose was used, add E3 water to remove the zebrafish.
Fig. 1.
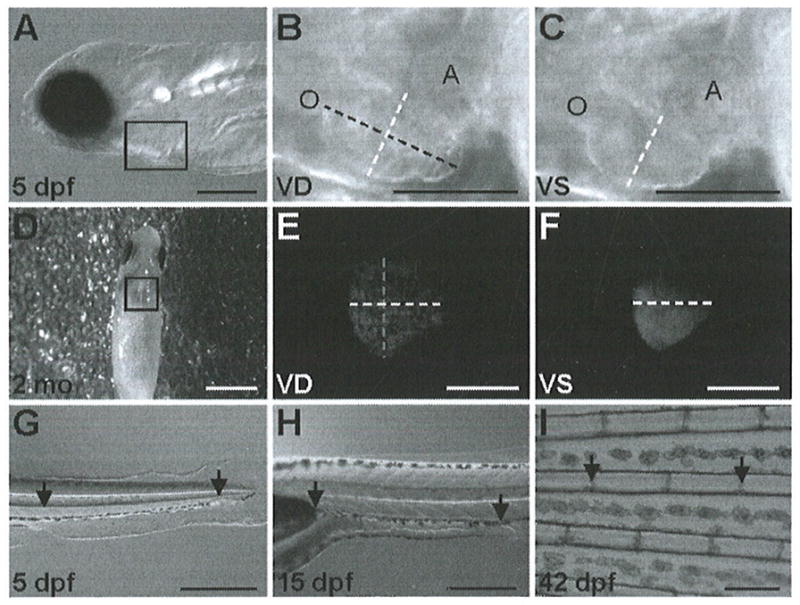
Orientations and measurement locations for shortening fraction, heart rate, and red blood cell flow rate assays. (a) For cardiac imaging, zebrafish up to 4 weeks old are placed on their right side in 3% methyl cellulose or E3, as shown with the 5-dpf zebrafish. (d) Fish older than 4 weeks are placed on a moist sponge, ventral-side up. (b, c, e and f) Maximum ventricular diastole (VD) and ventricular systole (VS) are shown, with the width depicted as a white dashed line and the length as a black or gray dashed line. Outflow tract (O) and atrium (A) are labeled in images (b, c). For the red blood cell flow rate assay, (g) 5-dpf, (h) 15- and 21 -dpf, and (i) 6-week fish are placed horizontally on their right side. Arrows refer to specific locations used for starting and stopping the stopwatch. Scale bars for (a–i) are 0.25, 0.125, 0.125, 3, 1, 1, 0.5, 0.5, and 0.5 mm, respectively. (Images (g–i) are reproduced from (21)).
3.2. Heart Imaging of Zebrafish Older than Four Weeks
Tricaine fish for a desired amount of time before placing in a moist sponge (see Fig. 1d and Notes 4 and 5).
Position the fish vertically to obtain a ventral view under a microscope connected to a digital camera (see Note 2).
Choose a magnification such that the heart fills at least 50% of the camera screen (e.g., 30×).
Record the heart beating for at least 15 s.
For cross-sectional area and volume measurements, take a video of a millimeter ruler at the same magnification.
3.3. Quantifying Shortening Fraction (and Ventricle Size)
In the video file, use the arrow keys to move between frames.
Save the maximum ventricular systole (VS) and ventricular diastole (VD) frames (see Fig. 1b, c, e, and f) as JPEGs.
-
In pixels, measure the width of the heart (depicted as a white dashed line in Fig. 1b, c, e, and f) at maximum diastole and systole of the ventricle.
Open the file with ImageJ.
Select the Straight tool.
Hold in a left click for the width of the ventricle.
Select Analyze → Measure.
Record ImageJ’s “Length” value for the width measurement (in pixels).
Calculate the shortening fraction (%) for the ventricle (see Table 1 for a sample calculation): (100)(width at diastole–width at systole)/(width at diastole).
For calculating cross-sectional area and approximating the volume of the ventricle, proceed with the following steps (see Table 1 for sample calculations).
-
Cross-sectional area can be found by using ImageJ:
Open the file containing a picture of the ventricle in diastole with ImageJ.
Select the Polygon selections tool.
Left click around the perimeter of the ventricle.
Select Analyze → Measure.
Record ImageJ’s “Area” value for the ventricle cross-sectional area (in pixels2).
Save a picture of the ruler (from the video) as a JPEG.
Open the file with ImageJ.
Select the Straight tool.
Hold in a left click for the length of 1 mm.
Select Analyze → Measure.
Record ImageJ’s “Length” value for the number of pixels in 1 mm.
For cross-sectional area (mm2), use the following formula: (cross-sectional area in pixels2)/(pixels in 1 mm)2.
-
To approximate the volume of the ventricle, proceed with the following:
Determine the width (in mm) of the ventricle at maximum diastole by dividing the length in pixels (found above) by the pixels in 1 mm.
Use ImageJ to find the length (in mm) of the ventricle at maximum diastole (see Fig. 1b, e), and then convert the value to mm.
Calculate the approximate volume of the ventricle (mm3) using the following formula (see Note 6): (0.523)(width in mm)2(length in mm).
Table 1.
Example of calculations for ventricular shortening fraction, cross-sectional area, and volume
| Parameter | Calculation | Result |
|---|---|---|
| Width at VD (pixels) | – | 136.74 |
| Width at VS (pixels) | – | 111.72 |
| Ventricular SF (%) | =(100)(136.74−111.72)/136.74 | 18.3 |
| Cross-sectional area of ventricle (pixels2) | – | 25,780 |
| Pixels in 1 mm | – | 838 |
| Cross-sectional area of ventricle (mm2) | =(25780)/(838)^2 | 0.037 |
| Width at VD (mm) | =(136.74)/(838) | 0.163 |
| Length at VD (pixels) | – | 224.93 |
| Length at VD (mm) | =(224.93)/(838) | 0.268 |
| Volume of the ventricle (mm3) | =(0.523)(0.163^2)(0.268) | 0.004 |
3.4. Quantifying Heart Rate
From either a video or live, count the number of beats in 15 s.
To calculate heart rate (beats/min), multiply the number of beats counted by four. For example, if the beats counted in 15 s is 25, the heart rate is 100 beats/min.
3.5. Red Blood Cell Flow Rate
If necessary, anesthetize the zebrafish in Tricaine solution before placing on a microscope slide in a thin layer of Methyl Cellulose or E3 water (see Notes 4 and 7).
Position the fish horizontally to obtain a lateral view under a microscope connected to a digital camera, as shown in Fig. 1h. The right eye should be facing down.
Using a millisecond stopwatch, determine the time in seconds it takes a red blood cell to travel between two arbitrary points. Examples of arbitrary points are shown in Figs. 1g–i (see Note 8).
Take a picture of the area observed.
With the same magnification, take a picture of a millimeter ruler.
-
Using ImageJ, determine the number of pixels in 1 mm.
Open the file with ImageJ.
Select the Straight tool.
Hold in a left click for the length of 1 mm.
Select Analyze → Measure.
Record ImageJ’s “Length” value for the number of pixels in 1 mm.
In pixels, measure the distance traveled by the red blood cell.
Calculate the distance traveled in mm by dividing the number of pixels traveled by the number of pixels in 1 mm (see Table 2 for a sample calculation).
To calculate the red blood cell (RBC) flow rate (mm/s), divide the distance traveled (in mm) by the time (in seconds) (see Table 2 for a sample calculation).
Table 2.
Example of calculations for RBC flow rate
| Parameter | Calculation | Result |
|---|---|---|
| Time (seconds) | – | 1.172 |
| 1 mm (pixels) | – | 1,659 |
| Distance traveled (pixels) | – | 932.09 |
| Distance traveled (mm) | =932.09/1659 | 0.562 |
| RBC flow rate (mm/s) | =0.562/1.172 | 0.48 |
Acknowledgments
We thank Dr. Leonard Zon at Children’s Hospital, Boston, for sharing with us the casper fish; Dr. Geoff Burns at Massachusetts General Hospital, Boston, for the Tg(cmlc2:nuDsRed) fish; Jomok Beninio for his help with zebrafish husbandry; and Dr. Jingchun Yang and Dr. Xiaojing Sun for their advice on the shortening fraction methodology for zebrafish larvae.
Footnotes
To prevent pigment formation, PTU treatment should begin at 24 h postfertilization. PTU is not necessary for imaging embryos less than 3 days postfertilization (dpf) or casper embryos.
Higher frames per second increases the accuracy of the measurements. A minimum of 30 frames per second is recommended.
A paintbrush can be used to position the young zebrafish in Methyl Cellulose.
Consistency in handling the fish, positioning of the fish, time of anesthesia, and duration between anesthesia and measurement is crucial for consistent results.
We anesthetize 4–6-week zebrafish for 2 min and 16-week zebrafish for 2.5 min in 1× Tricaine and image the heart by 3 or 3.5 min, respectively.
The volume of the ventricle is based on the assumption that the shape of a ventricle is an approximate ellipsoid: (4/3)(π) (width in mm2)2(length in mm2), which can be simplified to (0.523)(width in mm)2(length in mm).
For the red blood cell flow rate assay, day-5 zebrafish are not anesthetized. Week-6 zebrafish are anesthetized in 1× Tricaine for 2 min and timed between 2.75 and 3 min, while 16-week fish are anesthetized for 2.5 min and timed between 3.25 and 3.5 min.
When measuring red blood cell flow rate in the tail fin, we measure within the area of the fourth main ray from the ventral side.
References
- 1.Chico TJ, Ingham PW, Crossman DC. Modeling cardiovascular disease in the zebrafish. Trends Cardiovasc Med. 2008;4:150–155. doi: 10.1016/j.tcm.2008.04.002. [DOI] [PubMed] [Google Scholar]
- 2.Lieschke GJ, Currie PD. Animal models of human disease: zebrafish swim into view. Nat Rev Genet. 2007;8:353–367. doi: 10.1038/nrg2091. [DOI] [PubMed] [Google Scholar]
- 3.Glickman NS, Yelon D. Cardiac development in zebrafish: coordination of form and function. Semin Cell Dev Biol. 2002;13:507–513. doi: 10.1016/s1084952102001040. [DOI] [PubMed] [Google Scholar]
- 4.Nasevicius A, Ekker SC. Effective targeted gene ‘knockdown’ in zebrafish. Nat Genet. 2000;26:216–220. doi: 10.1038/79951. [DOI] [PubMed] [Google Scholar]
- 5.Ekker SC. Zinc finger-based knockout punches for zebrafish genes. Zebrafish. 2008;5:121–123. doi: 10.1089/zeb.2008.9988. [DOI] [PMC free article] [PubMed] [Google Scholar]
- 6.Moens CB, Donn TM, Wolf-Saxon ER, Ma TP. Reverse genetics in zebrafish by TILLING. Brief Funct Genomic Proteomic. 2008;7:454–459. doi: 10.1093/bfgp/eln046. [DOI] [PMC free article] [PubMed] [Google Scholar]
- 7.Foley JE, Maeder ML, Pearlberg J, Joung JK, Peterson RT, Yeh JR. Targeted mutagenesis in zebrafish using customized zinc-finger nucleases. Nat Protoc. 2009;4:1855–1867. doi: 10.1038/nprot.2009.209. [DOI] [PMC free article] [PubMed] [Google Scholar]
- 8.Pelster B, Burggren WW. Disruption of hemoglobin oxygen transport does not impact oxygen-dependent physiological processes in developing embryos of zebrafish (Danio rerio) Circ Res. 1996;79:358–362. doi: 10.1161/01.res.79.2.358. [DOI] [PubMed] [Google Scholar]
- 9.Kawakami K, Takeda H, Kawakami N, Kobayashi M, Matsuda N, Mishina M. A transposon-mediated gene trap approach identifies developmentally regulated genes in zebrafish. Dev Cell. 2004;7:133–144. doi: 10.1016/j.devcel.2004.06.005. [DOI] [PubMed] [Google Scholar]
- 10.Stainier DY, Fouquet B, Chen JN, Warren KS, Weinstein BM, Meiler SE, Mohideen MA, Neuhauss SC, Solnica-Krezel L, Schier AF, Zwartkruis F, Stemple DL, Malicki J, Driever W, Fishman MC. Mutations affecting the formation and function of the cardiovascular system in the zebrafish embryo. Development. 1996;123:285–292. doi: 10.1242/dev.123.1.285. [DOI] [PubMed] [Google Scholar]
- 11.Stainier DY. Zebrafish genetics and vertebrate heart formation. Nat Rev Genet. 2001;2:39–48. doi: 10.1038/35047564. [DOI] [PubMed] [Google Scholar]
- 12.Warren KS, Wu JC, Pinet F, Fishman MC. The genetic basis of cardiac function: dissection by zebrafish (Danio rerio) screens. Philos Trans R Soc Lond B Biol Sci. 2000;355:939–944. doi: 10.1098/rstb.2000.0629. [DOI] [PMC free article] [PubMed] [Google Scholar]
- 13.Chen JN, Fishman MC. Genetics of heart development. Trends Genet. 2000;16:383–388. doi: 10.1016/s0168-9525(00)02075-8. [DOI] [PubMed] [Google Scholar]
- 14.Dahme T, Katus HA, Rottbauer W. Fishing for the genetic basis of cardiovascular disease. Dis Model Mech. 2009;2:18–22. doi: 10.1242/dmm.000687. [DOI] [PMC free article] [PubMed] [Google Scholar]
- 15.MacRae CA, Peterson RT. Zebrafish-based small molecule discovery. Chem Biol. 2003;10:901–908. doi: 10.1016/j.chembiol.2003.10.003. [DOI] [PubMed] [Google Scholar]
- 16.Milan DJ, Kim AM, Winterfield JR, Jones IL, Pfeufer A, Sanna S, Arking DE, Amsterdam AH, Sabeh KM, Mably JD, Rosenbaum DS, Peterson RT, Chakravarti A, Kääb S, Roden DM, MacRae CA. Drug-sensitized zebrafish screen identifies multiple genes, including GINS3, as regulators of myocardial repolarization. Circulation. 2009;120:553–559. doi: 10.1161/CIRCULATIONAHA.108.821082. [DOI] [PMC free article] [PubMed] [Google Scholar]
- 17.Kaufman CK, White RM, Zon L. Chemical genetic screening in the zebrafish embryo. Nat Protoc. 2009;4:1422–1432. doi: 10.1038/nprot.2009.144. [DOI] [PMC free article] [PubMed] [Google Scholar]
- 18.Zon LI, Peterson RT. In vivo drug discovery in the zebrafish. Nat Rev Drug Discov. 2005;4:35–44. doi: 10.1038/nrd1606. [DOI] [PubMed] [Google Scholar]
- 19.Peterson RT, Shaw SY, Peterson TA, Milan DJ, Zhong TP, Schreiber SL, MacRae CA, Fishman MC. Chemical suppression of a genetic mutation in a zebrafish model of aortic coarctation. Nat Biotechnol. 2004;22:595–599. doi: 10.1038/nbt963. [DOI] [PubMed] [Google Scholar]
- 20.AHA. Heart Disease and Stroke Statistics – 2010 Update. Dallas, Texas: 2010. [Google Scholar]
- 21.Sun X, Hoage T, Bai P, Ding Y, Chen Z, Zhang R, Huang W, Jahangir A, Paw B, Li YG, Xu X. Cardiac hypertrophy involves both myocyte hypertrophy and hyperplasia in anemic zebrafish. PLoS One. 2009;4:e6596. doi: 10.1371/journal.pone.0006596. [DOI] [PMC free article] [PubMed] [Google Scholar]
- 22.Nemtsas P, Wettwer E, Christ T, Weidinger G, Ravens U. Adult zebrafish heart as a model for human heart? An electrophysiological study. J Mol Cell Cardiol. 2010;48:161–171. doi: 10.1016/j.yjmcc.2009.08.034. [DOI] [PubMed] [Google Scholar]
- 23.Milan DJ, Jones IL, Ellinor PT, MacRae CA. In vivo recording of adult zebrafish electrocardiogram and assessment of drug-induced QT prolongation. Am J Physiol Heart Circ Physiol. 2006;291:H269–273. doi: 10.1152/ajpheart.00960.2005. [DOI] [PubMed] [Google Scholar]
- 24.Sun L, Xu X, Richard WD, Feng C, Johnson JA, Shung KK. A high-frame rate duplex ultrasound biomicroscopy for small animal imaging in vivo. IEEE Trans Biomed Eng. 2008;55:2039–2049. doi: 10.1109/TBME.2008.919110. [DOI] [PubMed] [Google Scholar]
- 25.Sun L, Lien CL, Xu X, Shung KK. In vivo cardiac imaging of adult zebrafish using high frequency ultrasound (45–75 MHz) Ultrasound Med Biol. 2008;34:31–39. doi: 10.1016/j.ultrasmedbio.2007.07.002. [DOI] [PMC free article] [PubMed] [Google Scholar]
- 26.Boppart SA, Tearney GJ, Bouma BE, Southern JF, Brezinski ME, Fujimoto JG. Noninvasive assessment of the developing Xenopus cardiovascular system using optical coherence tomography. Proc Natl Acad Sci U S A. 1997;94:4256–4261. doi: 10.1073/pnas.94.9.4256. [DOI] [PMC free article] [PubMed] [Google Scholar]
- 27.Choma MA, Izatt SD, Wessells RJ, Bodmer R, Izatt JA. Images in cardiovascular medicine: in vivo imaging of the adult Drosophila melanogaster heart with realtime optical coherence tomography. Circulation. 2006;114:e35–36. doi: 10.1161/CIRCULATIONAHA.105.593541. [DOI] [PubMed] [Google Scholar]
- 28.Manner J, Thrane L, Norozi K, Yelbuz TM. High-resolution in vivo imaging of the cross-sectional deformations of contracting embryonic heart loops using optical coherence tomography. Dev Dyn. 2008;237:953–961. doi: 10.1002/dvdy.21483. [DOI] [PubMed] [Google Scholar]
- 29.White RM, Sessa A, Burke C, Bowman T, LeBlanc J, Ceol C, Bourque C, Dovey M, Goessling W, Burns CE, Zon LI. Transparent adult zebrafish as a tool for in vivo transplantation analysis. Cell Stem Cell. 2008;2:183–189. doi: 10.1016/j.stem.2007.11.002. [DOI] [PMC free article] [PubMed] [Google Scholar]
- 30.Mably JD, Mohideen MA, Burns CG, Chen JN, Fishman MC. heart of glass regulates the concentric growth of the heart in zebrafish. Curr Biol. 2003;13:2138–2147. doi: 10.1016/j.cub.2003.11.055. [DOI] [PubMed] [Google Scholar]
- 31.Brutsaert DL. Cardiac dysfunction in heart failure: the cardiologist’s love affair with time. Prog Cardiovasc Dis. 2006;49:157–181. doi: 10.1016/j.pcad.2006.08.010. [DOI] [PubMed] [Google Scholar]
- 32.Westerfield M. A guide for the laboratory use of zebrafish (Danio rerio) 4. Univ. of Oregon Press; Eugene, Oregon: 2000. The zebrafish book. [Google Scholar]
- 33.Ocorr K, Fink M, Cammarato A, Bernstein S, Bodmer R. Semi-automated Optical Heartbeat Analysis of small hearts. J Vis Exp. 2009:31. doi: 10.3791/1435. [DOI] [PMC free article] [PubMed] [Google Scholar]
- 34.Fink M, Callol-Massot C, Chu A, Ruiz-Lozano P, Izpisua Belmonte JC, Giles W, Bodmer R, Ocorr K. A new method for detection and quantification of heartbeat parameters in Drosophila, zebrafish, and embryonic mouse hearts. Biotechniques. 2009;46:101–113. doi: 10.2144/000113078. [DOI] [PMC free article] [PubMed] [Google Scholar]