Abstract
Scope
MicroRNA (miRNA) profiles are altered in chronic conditions such as cardiovascular disease, diabetes, neurological disorders, and cancer. A systems biology approach was used to examine, for the first time, miRNAs altered in rat colon tumors induced by 2-amino-1-methyl-6-phenylimidazo[4,5-b]pyridine (PhIP), a heterocyclic amine carcinogen from cooked meat.
Methods and Results
Among the most highly dysregulated miRNAs were those belonging to the let-7 family. Subsequent computational modeling and target validation identified c-Myc and miRNA-binding proteins Lin28A/Lin28B (Lin28) as key players, along with Sox2, Nanog and Oct-3/4. These targets of altered miRNAs in colon cancers have been implicated in tumor recurrence and reduced patient survival, in addition to their role as pluripotency factors. In parallel with these findings, the tumor-suppressive effects of dietary spinach given post-initiation correlated with elevated levels of let-7 family members and partial normalization of c-myc, Sox2, Nanog, Oct-3/4, HmgA2, Dnmt3b and P53 expression.
Conclusion
We conclude that the let-7/c-Myc/Lin28 axis is dysregulated in heterocyclic amine-induced colon carcinogenesis, and that the tumor suppressive effects of dietary spinach are associated with partial normalization of this pathway.
Keywords: MicroRNAs, epigenetics, pluripotent factors, colon cancer, chemoprevention
1 Introduction
MicroRNAs (miRNA/miR) are small, non-coding RNAs that act at the post-transcriptional level to degrade or repress translation from target mRNAs [1, 2]. They are implicated in several human pathologies, including cancer, and are influenced by lifestyle factors such as cigarette smoke exposure and the intake of dietary chemopreventive agents [2–8]. A recent study, for example, found that resveratrol protects against prostate carcinogenesis via the downregulation of oncogenic miRNAs and upregulation of tumor suppressor miRNAs [8]. MicroRNA changes also contribute to colon carcinogenesis [9, 10]; however, the interrelationships between specific dietary carcinogens, chemopreventive agents, altered miRNAs, and downstream signaling pathways are complex and in need of clarification.
Thus, the current investigation focused on colon carcinogenesis induced by a heterocyclic amine from cooked meat [4, 11–13], and the chemopreventive actions of dietary spinach [14]. Profiling of the miRNAs altered in 2-amino-1-methyl-6-phenylimidazo[4,5-b]pyridine (PhIP)-induced rat colon tumors led to an examination of the let-7/c-Myc/Lin28 axis. The latter axis has been implicated in the etiology of human cancers [15–18], and has a crucial role in regulating key networks in induced pluripotent and cancer stem cells [19].
2 Materials and Methods
2.1 Carcinogenicity bioassay
The preclinical study was approved by the Institutional Animal Care and Use Committee (ACUP 3168). Details of the PhIP dosing protocol were reported elsewhere [20–22]. Briefly, male F344 rats, 3–4 wks of age, were purchased from the National Cancer Institute and housed in a ventilated, temperature-controlled room at 25°C with a 12 h light–dark cycle. After acclimatization to basal AIN-93G diet for 3 days, rats were treated by oral gavage with PhIP (40 mg/kg body weight, 40 rats per group), every day for 2 weeks. Rats were then switched to a high-fat diet (HF) for 4 weeks, during which time no PhIP was administered. PhIP/HF cycling was repeated three times (Supporting Information Fig. S1), after which rats were given standard AIN-93M diet, or AIN-93M diet containing freeze-dried baby spinach incorporated at 10% wt/wt, as reported previously [14]. Additional groups were treated in an identical manner, but given vehicle rather than PhIP by oral gavage (n = 12 rats per group). The study was terminated at the end of 52 weeks. Tumors were enumerated in the colon and in other target organs. For miRNA analyses, colon tumors and normal-looking colonic mucosa samples were flash-frozen in liquid nitrogen and stored at −80°C.
2.2 MicroRNA extraction
Tumors and colonic mucosa samples, in triplicate, were homogenized on ice and extracted using the miRNeasy kit (Qiagen, Valencia, CA, USA). RNA quality and integrity was evaluated from the absorbance at 260 and 280 nm (260/280 ratio >1.9).
2.3 MicroRNA microarrays
Microarray analyses were performed by LC Sciences (Houston, TX). The assay started from 2 μg total RNA (quantified by 260nm/280nm ratio followed by bioanalyzer), 3′-extended with a poly(A) tail using poly(A) polymerase. An oligonucleotide tag was ligated to the poly(A) tail for fluorescent dye staining. Hybridization was performed overnight on a μParaflo microfluidic chip using a micro-circulation pump (Atactic Technologies, Houston, TX). On the microfluidic chip, each detection probe consisted of a chemically modified nucleotide coding segment complementary to 679 unique mature rat target miRNAs (from miRBase version 17, http://miRBase.org), and a polyethylene glycol spacer segment to extend the coding segment away from the substrate. Hybridization used 100 ml 6xSSPE buffer (0.9 M NaCl, 60 mM Na2HPO4, 6 mM EDTA, pH 6.8) containing 25% formamide at 34°C. After hybridization, tag-conjugated Cy3-dye was circulated through the microfluidic chip for dye staining. Fluorescence images were collected using a GenePix 4000B scanner (Molecular Devices, Sunnyvale, CA) and digitized using Array-Pro image analysis software (Media Cybernetics, Bethesda, MD). Data were analyzed by first subtracting the background and then normalizing the signal using a locally-weighted regression filter. Cluster plots were generated using software from The Institute for Genomic Research.
2.4 Analyses of miRNA expression
For each miRNA within a treatment group, expression data of five replicates were generated and compared using volcano plot analysis. The latter defined both fold-variation and statistical significance based on analysis of variance (ANOVA), followed by Benjamini-Hochberg correction using ArrayStar software (DNASTAR, Inc., Madison, WI, USA). Multivariate analyses were performed using Statgraphics software (Statpoint Technologies, Inc., Warrenton, VA, USA) for pair-wise testing among groups. Scatter plots were evaluated by simple linear regression analysis. Global miRNA expression profiles among the experimental groups were compared by hierarchical cluster analyses using ArrayStar software. A difference with P<0.05 was considered statistically significant.
2.5 Biological network analyses
MicroRNAs and their putative target mRNAs were examined via MetaCore pathway analysis (GeneGo Inc., St Joseph, MI, USA). For pathway enrichment analysis, P values were calculated using the formula for hypergeometric distribution, reflecting the probability for a pathway to arise by chance. Pathway maps were prioritized based on statistical significance. Two key comparisons were the carcinogen effects (colon tumors in positive controls versus normal-looking colonic mucosa) and the chemopreventive effects (colon tumors in positive controls versus colon tumors for PhIP+ spinach treatment).
2.6 miRNA quantification
Quantitative real-time polymerase chain reaction (qPCR) analyses used the Qiagen miScript kit according to the manufacturer’s instructions. Primer sequences are listed in Supporting Information Table S1. RNA (~1 μg) from rat colon tumor or normal colonic mucosa was reverse-transcribed, followed by qPCR in a 20-μl reaction containing miScript Universal primer, miRNA specific-miScript primers, SYBR green mix, and template cDNA. Reactions were performed in triplicate and fluorescence intensities were acquired using a LightCycler 480 II (Roche Applied Science, Indianapolis, IN, USA). Relative miRNA expression was quantified by determining the point at which the fluorescence accumulation entered the exponential phase (Ct), and the Ct ratio of the target was normalized to small nuclear RNA U6B (RNU6B).
2.7 mRNA expression
Target mRNAs were quantified by qPCR and normalized to glyceraldehyde-3-phosphate dehydrogenase (Gapdh), as reported previously [20–22]. Briefly, 1 μg total RNA was reverse-transcribed using SuperScript III First Strand Synthesis Supermix Kit (Invitrogen, Eugene, OR, USA), and qPCR was conducted in a 20-μl reaction containing cDNAs, SYBR Green I dye, and gene-specific primers (Supporting Information Table S2). Experiments were conducted in a Roche Light Cycler 480 II, and the Ct ratio of the target gene to Gapdh was calculated. Three separate experiments were performed in triplicate for each sample, and the results were expressed as mean ± SE.
2.8 Immunoblotting
Lin28B and p53 were examined using the immunoblotting methodology reported elsewhere, with β-actin as loading control [23]. Primary antibodies were rabbit polyclonal Lin28B lot # GR47954-3 (Abcam, Cambridge, MA, USA) at 1:800 dilution, and rabbit polyclonal p53 SC-126 (Santa Cruz Biotechnology, Santa Cruz, CA, USA) at 1:500 dilution.
2.9 Statistics
Tumor incidence data were compared by logistic regression, as reported previously [20], whereas group comparisons (mean ± SE) were based on one-way and two-way ANOVA (Graphpad Prism 5 software). In the figures, statistical significance was shown at the *P<0.05 level.
3 Results
3.1 Dietary spinach suppresses PhIP-induced tumorigenesis in the rat
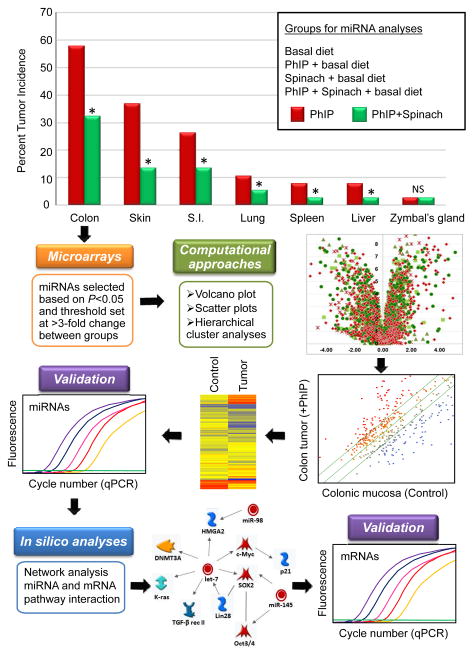
Fig. 1 presents results from the carcinogenicity bioassay, along with a synopsis of the miRNA analyses. Tumor incidences were as follows; colon (58%), skin (38%), small intestine (27%), lung (10%), spleen (8%), liver (8%), and Zymbal’s gland (2%). Spinach, given post-initiation in the diet during experimental weeks 18–52, inhibited tumorigenesis in all target organs, except Zymbal’s gland (P >0.05). In the colon, tumor incidence was lowered from 58% to 32% after spinach treatment (Fig. 1, P<0.05). No tumors were detected in vehicle-treated rats given the basal diet or spinach-containing diet in weeks 18–52 (data bars not shown).
Figure 1.
Suppression of PhIP-induced tumorigenesis by dietary spinach, and scheme for miRNA analyses. The carcinogen PhIP was administered to male F344 rats by oral gavage in three cycles, as reported (20–22). During the post-initiation phase starting at week 18, rats were switched to AIN-93M diet, or to AIN-93M diet containing freeze-dried baby spinach incorporated at 10% wt/wt. The study was terminated at 1 year. Tumors were enumerated in the colon and in other target organs. For miRNA analyses, colon tumors and normal-looking colonic mucosa samples were flash-frozen in liquid nitrogen and stored at −80°C. Microarrays containing 679 miRNAs from the rat miRBase (V.17) generated data that was subjected to various computational approaches, miRNA validation, in silico pathway analysis, and mRNA validation.
3.2 Microarray analyses define a ‘PhIP miRNA signature’ in rat colon tumors
Microarrays containing 679 miRNAs from the rat miRBase (V.17) were used to profile PhIP-induced colon tumors and normal colonic mucosa, and the data were subjected to sequential computational approaches, target validation, and in silico network analyses (see arrows, Fig. 1). MicroRNAs were first ranked in normal colonic mucosa from male F344 rats given neither PhIP nor spinach (Supporting Information Table S3). This was designated as the ‘control profile’ against which all other groups were compared, setting limits (selection criteria) of P<0.05 and a 3-fold change in expression in either direction.
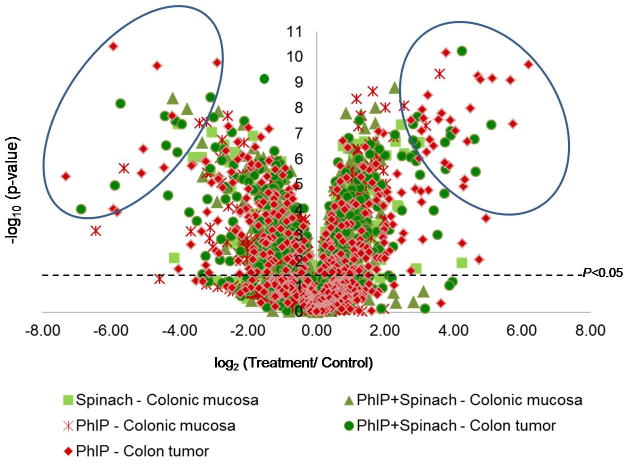
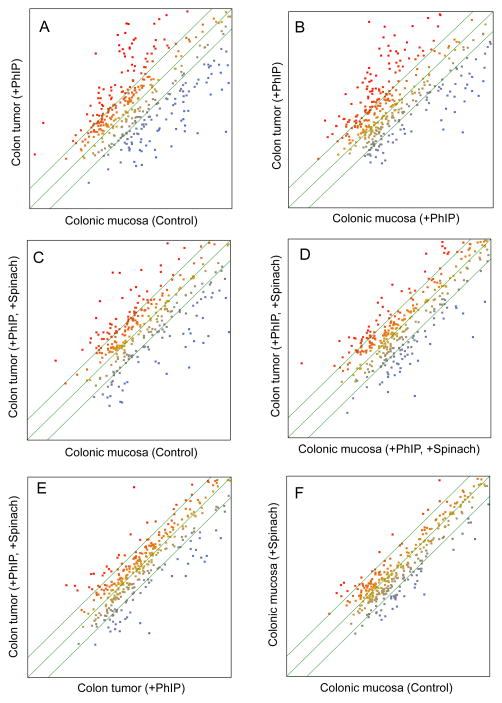
The volcano plot identified miRNAs expressed at significantly increased or decreased levels in each treatment group compared with the control profile (Fig. 2, data-points above the P<0.05 line), with circled regions indicating the most highly altered miRNAs. Multivariate analyses examined pairwise relationships (Fig. 3), the scatter above or below the diagonal axis signifying miRNAs that differed significantly between treatment groups. As expected, miRNAs were increased or decreased in colon tumors compared with control colonic mucosa (Fig. 3A), or compared with colonic mucosa from rats given PhIP (Fig. 3B). Based on the stipulated selection criteria, 21 miRNAs (5.5%) were higher and 51 miRNAs (13.4%) were lower in tumors versus control colonic mucosa. In the PhIP+spinach arm of the study (Figs. 3C,D), 14 miRNAs (4.0%) were higher and 23 miRNAs (6.6%) were lower in colon tumors versus colonic mucosa. Colon tumors from PhIP+spinach-treated rats were compared with colon tumors from rats given PhIP and no spinach (Fig. 3E); 15 miRNAs (4.2%) were increased and 29 miRNAs (8.1%) were decreased, respectively. The strongest correlation was for normal colonic mucosa versus colonic mucosa from rats given spinach and no PhIP (Fig. 3F, r2=0.82). Thus, spinach treatment did not alter markedly the control profile of miRNAs.
Figure 2.
Volcano plot showing fold variation and statistical significance of miRNA profiles among the treatment groups, compared to the control miRNA profile in rat colonic mucosa from rats given neither PhIP nor spinach (see Supporting information Table 3).
Figure 3.
Scatter plot analyses comparing miRNA expression intensities in rat colon tumors and colonic mucosa, using species-specific miRBase (Version 17.0). Color scale indicates intensity of miRNA expression, ranging from blue (lowest) to red (highest). For reasons of clarity, the term “miRNA expression in…” was omitted from each axis label; x- and y-axes scales ranged from 1 to 10, plotted on a logarithmic scale.
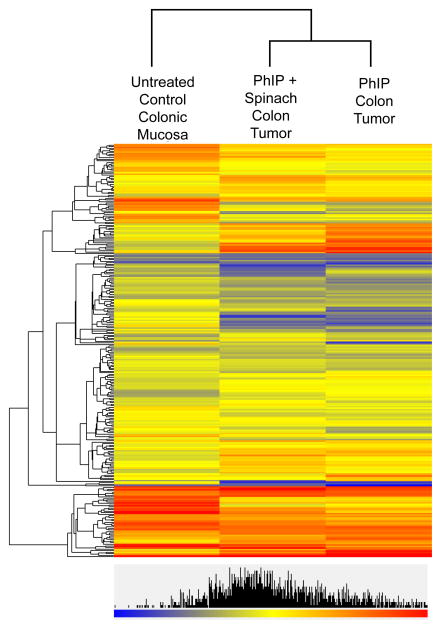
Unsupervised hierarchical cluster analysis (Fig. 4) revealed similar, though non-identical, miRNA patterns for PhIP-induced colon tumors and colon tumors from PhIP+spinach treatment, and these were grouped separately from the control colonic mucosa profile. After eliminating miRNAs with fluorescence signal intensity <500 units, several members of the let-7 family were identified as being significantly decreased in colon tumors relative to control colonic mucosa, whereas miR-126, miR-145, and miR-21 were increased in the tumors. These miRNAs were selected for further validation.
Figure 4.
Hierarchical cluster analysis of miRNA expression profiles in rat colon. Unsupervised miRNA selection with P<0.05 (Arraystar software). Rows correspond to individual miRNA expression values; columns indicate treatment groups.
Preliminary qPCR assays established that RNU6B was a suitable endogenous control, exhibiting a similar expression pattern in the various treatment groups (data not shown). Subsequent qPCR experiments confirmed that miR-126, miR-145 and miR-21 were increased in PhIP-induced colon tumors, whereas let-7a, let-7b, let-7c, let-7d, let-7e, let-7f, let-7i, miR-98, mir-29c and miR-215 were decreased (Fig. 5, data bars in red). In the chemoprevention arm of the study, a statistically significant increase in miR-145 expression was observed in colon tumors from rats given PhIP+spinach compared with tumors from rats given PhIP alone (Fig. 5, green versus red data bar labeled miR-145, P<0.05). Several miRNAs that were decreased in PhIP-induced colon tumors were partially ‘normalized’ following spinach treatment, including miR-215, miR-29c, and let-7 family members let-7a, let-7d, let-7e, and miR-98 (P<0.05).
Figure 5.

Relative expression of miRNAs altered in PhIP-induced colon tumors, validated by qPCR and normalized to RNU6B.
3.3. In silico analyses predict key targets of PhIP signature miRNAs
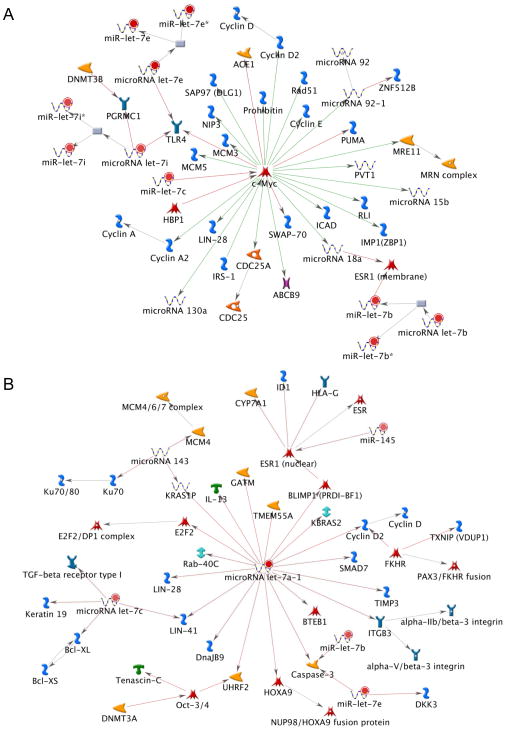
Metacore pathway analysis was used to predict direct targets of miRNAs altered in PhIP-induced colon tumors, along with ‘neighbor-of-neighbor’ interactions. The latter interactions involve predicted ‘downstream’ changes that might occur following the initial effects of miRNAs on their primary targets [24]. A major node with c-Myc at the center and LIN-28 downstream (Fig. 6A) included multiple let-7 family members (let-7b, let-7c, let-7e, and let-7i). A second node centered on let-7a also had LIN-28 as a target, and neighbor-of-neighbor interactions involving let-7b, let-7c and let-7e (Fig. 6B).
Figure 6.
Predicted targets of miRNAs altered in PhIP-induced colon tumors. (A) Metacore analysis identified a major node involving multiple let-7 family members, c-Myc, and LIN-28; (B) a second node centered on let-7a included LIN-28 as a target, and let-7b, let-7c, and let-7e in the neighbor interactions. Color intensity indicates the degree of upregulation (red) or downregulation (green); shapes represent functional class of gene products; grey nodes represent potential targets that are not curated.
From the Metacore analyses, transcription factor targets were ranked according to g-score, which reflects the likelihood of a candidate being co-regulated with the various genes under investigation. Using this approach, c-Myc and p53 were identified as the top targets of miRNAs in colon tumors from the PhIP and PhIP+spinach arms of the study (Tables 1 and 2). Other transcription factors of note were Esr1, Sip1, Elk-1, Foxo3A, Oct-3/4, and Sox2. Interestingly, the latter two transcription factors and c-Myc (plus Klf4, not ranked by g-score) represent ‘defined factors’ for inducing pluripotent stem (iPS) cells [25].
Table 1.
Top-ranked transcription factor targets of microRNAs in PhIP-induced colon tumors (Metacore Pathway Analysis)
| Key network objects | Total nodes | Seed nodes | p-value | g-score |
|---|---|---|---|---|
| c-Myc | 8 | 7 | 1.25e-25 | 153.18 |
| p53 | 5 | 4 | 1.50e-14 | 110.71 |
| EGR1 | 4 | 3 | 5.75e-11 | 92.83 |
| ESR1 | 4 | 3 | 5.75e-11 | 92.83 |
| YY1 | 3 | 2 | 1.91e-07 | 71.46 |
| SOX2 | 3 | 2 | 1.91e-07 | 71.46 |
| Oct-3/4 | 3 | 2 | 1.91e-07 | 71.46 |
| n-Myc | 3 | 2 | 1.91e-07 | 71.46 |
| MAFG | 3 | 2 | 1.91e-07 | 71.46 |
| RelA | 3 | 2 | 1.91e-07 | 71.46 |
| NFE2L1 | 3 | 2 | 1.91e-07 | 71.46 |
| SP1 | 3 | 2 | 1.91e-07 | 71.46 |
| SIP1 | 3 | 2 | 1.91e-07 | 71.46 |
| MITF | 2 | 1 | 5.22e-04 | 43.75 |
| FOXO3A | 2 | 1 | 5.22e-04 | 43.75 |
| NF-κB | 2 | 1 | 5.22e-04 | 43.75 |
| RREB1 | 2 | 1 | 5.22e-04 | 43.75 |
| Elk-1 | 2 | 1 | 5.22e-04 | 43.75 |
| TCF7L2 (TCF4) | 2 | 1 | 5.22e-04 | 43.75 |
| c-Jun | 2 | 1 | 5.22e-04 | 43.75 |
Table 2.
Top-ranked transcription factor targets of microRNAs in colon tumors from rats given PhIP+spinach (Metacore Pathway Analysis)
| Key network objects | Total nodes | Seed nodes | p-value | g-score |
|---|---|---|---|---|
| c-Myc | 6 | 5 | 2.30e-18 | 130.77 |
| p53 | 6 | 5 | 2.30e-18 | 130.77 |
| TBP | 4 | 3 | 4.60e-11 | 96.09 |
| ESR1 | 4 | 3 | 4.60e-11 | 96.09 |
| TCF8 | 4 | 3 | 4.60e-11 | 96.09 |
| Oct-3/4 | 4 | 3 | 4.60e-11 | 96.09 |
| SOX5 | 3 | 2 | 1.65e-07 | 73.97 |
| Androgen receptor | 3 | 2 | 1.65e-07 | 73.97 |
| SIP1 | 3 | 2 | 1.65e-07 | 73.97 |
| NRSF | 3 | 2 | 1.65e-07 | 73.97 |
| SOX6 | 3 | 2 | 1.65e-07 | 73.97 |
| AML1 (RUNX1) | 3 | 2 | 1.65e-07 | 73.97 |
| c-Rel | 3 | 2 | 1.65e-07 | 73.97 |
| SOX2 | 3 | 2 | 1.65e-07 | 73.97 |
| FKHR | 3 | 2 | 1.65e-07 | 73.97 |
| RREB1 | 2 | 1 | 4.87e-04 | 45.29 |
| C/EBPα | 2 | 1 | 4.87e-04 | 45.29 |
| Elk-1 | 2 | 1 | 4.87e-04 | 45.29 |
| MITF | 2 | 1 | 4.87e-04 | 45.29 |
| FOXO3A | 2 | 1 | 4.87e-04 | 45.29 |
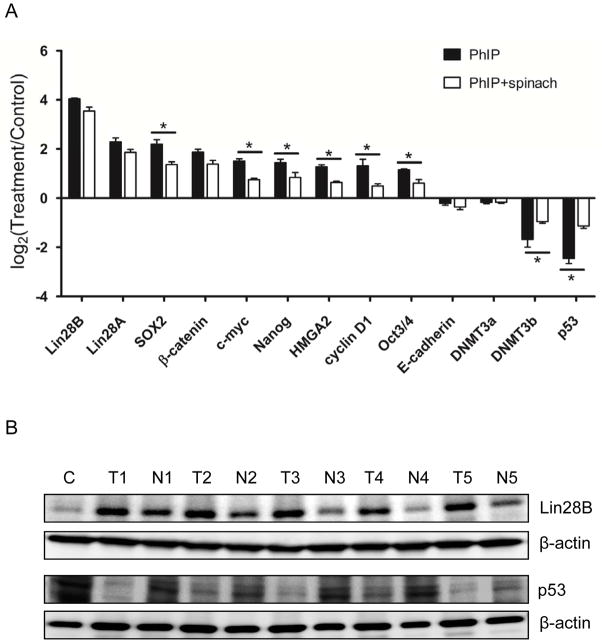
To validate the predicted targets of miRNAs in PhIP-induced colon tumors, Gapdh was first confirmed as a suitable control, exhibiting similar expression in the various treatment groups (qPCR data not shown). Among the targets investigated, Lin28A, Lin28B, and Sox2 were the most significantly increased factors in PhIP-induced colon tumors (Fig. 7A). Other targets increased in colon tumors were β-catenin, c-Myc, Nanog, HMGA2, cyclin D1 and Oct-3/4. The two most significantly downregulated targets were DNMT3b and p53. In the PhIP+spinach arm of the study, several of these factors were partially ‘normalized’, including c-Myc, Sox2, Nanog, and Oct-3/4 (Fig. 7A, green versus red bars, P<0.05). Immunoblotting experiments confirmed a significant increase of Lin-28B and significant decrease of p53 in PhIP-induced colon tumors compared with matched normal-looking control colonic mucosa (Fig. 7B).
Figure 7.
Validation of mRNA targets in PhIP-induced colon tumors. (A) Relative mRNA expression normalized to Gapdh (qPCR data); (B) Immunoblotting of Lin28B and p53 in PhIP-induced colon tumors; β-actin, loading control. C, control colonic mucosa from rats given neither PhIP nor spinach; T, PhIP-induced colon tumor; N, matched normal-looking colonic mucosa.
4 Discussion
Ubagai et al. [26] reported on the efficient induction of large intestine tumors in the rat by PhIP/HF cycling, which greatly reduced the amount of carcinogen administered compared with the original protocol that provided 400 p.p.m. PhIP in the diet for 52 weeks [27]. We modified the former protocol by administering PhIP via oral gavage, and by following the PhIP/HF cycling with standard AIN-93M diet rather than HF diet until 52 weeks (Supporting Information Fig S1). The modified protocol revealed additional target organs for tumorigenesis, such as the lung and liver, and a high incidence of colon tumors. As in prior studies of tea and its individual constituents [20–22], spinach had no effect on colon tumor multiplicity (colon tumors/colon tumor-bearing animal, data not shown), but reduced significantly the overall colon tumor incidence (Fig 1). Because some rats still had colon tumors in the PhIP+spinach group, a follow-up investigation might be warranted on alternative mechanisms not identified in this study, or involving early stages such as preneoplastic lesions and microadenomas, which were not examined here.
To our knowledge, this is the first report to detail the miRNA changes in rat colon tumors induced by a cooked meat carcinogen, and the chemopreventive effects of dietary spinach. Starting with microarrays containing 679 miRNAs from the rat miRBase (V.17), the key findings were as follows: (1) several members of the let-7 family were reduced significantly in PhIP-induced colon tumors, and this situation was reversed, at least in part, after spinach treatment post-initiation; (2) spinach ingestion also partially recovered miR-215, the most highly decreased miRNA in PhIP-induced colon tumors; (3) increased miRNAs in the colon tumors included miR-21, miR-126, and miR-145; (4) pathway analysis and validation highlighted critical roles for Lin28A/Lin28B, c-Myc, Sox2, Oct-3/4, Nanog, HMGA2, p53, and Dnmt3a/b.
Previous studies in vivo noted changes in miRNA profiles after treatment with various mutagens and carcinogens [28–31]. For example, in the azoxymethane rat colon carcinogenesis model [31], altered miRNAs were linked to canonical oncogenic signaling pathways. The present investigation is the first to demonstrate that a heterocyclic amine carcinogen, found commonly in the human diet, induces colon tumors with a signature loss of let-7 family members and miR-215, which was partially reversed by the chemopreventive actions of dietary spinach.
Several members of the let-7 family are located in close proximity to chromosomal regions commonly deleted in human cancer [32], and in some tumors an orchestrated downregulation of multiple let-7 miRNAs has been noted [33]. Let-7 family members mediate the suppression of downstream oncogenic targets, such as K-ras, cyclin D1, and HMGA2, known to promote epithelial-to-mesenchymal transition [34]. In addition to let-7 members, PhIP-induced colon tumors had marked loss in the expression of miR-215, which is considered a tumor suppressor candidate in human colon cancer that targets thymidylate synthetase and dihydrofolate reductase, and regulates p53 and p21 levels [35].
Interestingly, the RNA-binding proteins Lin28A and Lin28B, which were increased in PhIP-induced colon tumors, bind to terminal loops of precursor let-7 miRNAs, disrupting their processing machinery and inhibiting mature miRNA formation [34]. There is evidence to suggest that Lin28A and Lin28B regulate cellular activities through distinct mechanisms due to their differential subcellular localization [33]. Overexpression of Lin28 has been reported in cancers of the ovary, breast, and colon [33–37].
Recently, Lin28 was used in conjunction with Nanog, Oct-3/4, and SOX2 to reprogram human fibroblasts to pluripotency, suggesting that miRNA processing contributes to the reprogramming of somatic cells to an embryonic state [38]. Lin28 may be sufficient to reprogram human somatic cells to pluripotency [36], and substitutes for c-Myc during iPS cell formation [39], whereas Nanog and SOX2 are implicated in tumor development [40–42]. These factors were increased in PhIP-induced colon tumors, and were partially normalized in the spinach chemoprevention arm, with the notable exception of Lin28, which remained strongly elevated (Fig. 7). It is tempting to speculate that these factors are involved in the stem cell niche of colonic crypts and become dysregulated upon PhIP treatment.
Finally, there is growing evidence for a convergence of epigenetic mechanisms in colorectal cancer, involving gene silencing through miRNA alterations, histone modifications, and DNA hypermethylation [43]. Aberrant DNA hypermethylation of the DNMT3B gene was reported recently in human colon cancer cell lines and primary tumors, and correlated with de novo loss of the protein [44]. PhIP-induced colon tumors also had markedly reduced expression levels of Dnmt3b, which were partially reversed by dietary spinach intake (Fig. 7). In silico modeling (data not shown) identified several targets of Dnmt3b, including tissue inhibitor of metalloproteinases-1 (TIMP-1), which has been associated with increased tumor invasion and reduced patient survival in colorectal cancer [45]. TIMP-1 and other targets of Dnmt3b have not been studied in heterocyclic amine-induced tumorigenesis. Given that PhIP is a multi-organ carcinogen, it will be of great interest to define the miRNA signatures in other major target organs, and the involvement of the Let-7/c-Myc/Lin28 axis.
In summary, we describe here the first comprehensive screening of miRNAs altered in rat colon tumors induced by a widely consumed dietary carcinogen, PhIP [46–48]. A systems biology approach coupled with computational modeling and target validation identified key roles for the let-7 family, Lin28A/Lin28B, and factors such as c-Myc, Sox2, Oct-3/4, and Nanog. Dysregulation of these factors was partially reversed in rats consuming dietary spinach during the post-initiation period. Although the precise mechanisms await further study, the current investigation provides further support for research at the interface of epigenetics, diet, and cancer prevention.
Supplementary Material
Acknowledgments
This study was supported by NIH grants CA090890, CA122959, CA90176, P30 ES00210, and an EHSC Pilot Project Grant awarded to M.A.P. DNASTAR software was used under license from the Center for Genome Research and Biocomputing at Oregon State University. We thank Dr. Clifford Pereira (Department of Statistics, Oregon State University) for helpful discussions.
Abbreviations
- ANOVA
analysis of variance
- miRNA/miR
microRNA
- PhIP
2-amino-1-methyl-6-phenylimidazo[4,5-b]pyridine
- qPCR
quantitative real-time polymerase chain reaction
Footnotes
Conflict of Interest
There is no conflict of interest in this manuscript.
References
- 1.Esteller M. Nat Rev Genet. 2011;12:861–874. doi: 10.1038/nrg3074. [DOI] [PubMed] [Google Scholar]
- 2.Parasramka MA, Ho E, Williams DE, Dashwood RH. Mol Carcinog. 2012;51:213–230. doi: 10.1002/mc.20822. [DOI] [PMC free article] [PubMed] [Google Scholar]
- 3.Koturbash I, Zemp FJ, Pogribny I, Kovalchuk O. Mutat Res. 2011;722:94–105. doi: 10.1016/j.mrgentox.2010.05.006. [DOI] [PubMed] [Google Scholar]
- 4.Ferguson LR. Environ Mol Mutagen. 2010;51:909–918. doi: 10.1002/em.20594. [DOI] [PubMed] [Google Scholar]
- 5.McKay JA, Mathers JC. Acta Physiol (Oxf) 2011;202:103–118. doi: 10.1111/j.1748-1716.2011.02278.x. [DOI] [PubMed] [Google Scholar]
- 6.Izzotti A, Larghero P, Longobardi M, Cartiglia C, et al. Mutat Res. 2011;717:9–16. doi: 10.1016/j.mrfmmm.2010.12.008. [DOI] [PubMed] [Google Scholar]
- 7.Izzotti A, Larghero P, Balansky R, Pfeffer U, et al. Mutat Res. 2011;717:17–24. doi: 10.1016/j.mrfmmm.2010.10.003. [DOI] [PubMed] [Google Scholar]
- 8.Dhar S, Hicks C, Levenson AS. Mol Nutr Food Res. 2011;55:1219–1229. doi: 10.1002/mnfr.201100141. [DOI] [PubMed] [Google Scholar]
- 9.Schetter AJ, Harris CC. Semin Oncol. 2011;38:734–742. doi: 10.1053/j.seminoncol.2011.08.009. [DOI] [PMC free article] [PubMed] [Google Scholar]
- 10.Tsuchiya N, Nakagama H. Mutat Res. 2010;693:94–100. doi: 10.1016/j.mrfmmm.2010.09.001. [DOI] [PubMed] [Google Scholar]
- 11.Turesky RJ. Mol Nutr Food Res. 2005;49:101–117. doi: 10.1002/mnfr.200400076. [DOI] [PubMed] [Google Scholar]
- 12.Turesky RJ, Le Marchand L. Chem Res Toxicol. 2011;24:1169–1214. doi: 10.1021/tx200135s. [DOI] [PMC free article] [PubMed] [Google Scholar]
- 13.Santarelli RL, Pierre F, Corpet DE. Nutr Cancer. 2008;60:131–144. doi: 10.1080/01635580701684872. [DOI] [PMC free article] [PubMed] [Google Scholar]
- 14.Castro DJ, Lohr CV, Fischer KA, Waters KM, et al. Carcinogenesis. 2009;30:315–320. doi: 10.1093/carcin/bgn280. [DOI] [PMC free article] [PubMed] [Google Scholar]
- 15.Nadiminty N, Tummala R, Lou W, Zhu Y, et al. J Biol Chem. 2012;287:1527–1537. doi: 10.1074/jbc.M111.278705. [DOI] [PMC free article] [PubMed] [Google Scholar]
- 16.Helland A, Anglesio MS, George J, Cowin PA, et al. PLoS One. 2011;6:e18064. doi: 10.1371/journal.pone.0018064. [DOI] [PMC free article] [PubMed] [Google Scholar]
- 17.Viswanathan SR, Powers JT, Einhorn W, Hoshida Y, et al. Nat Genet. 2009;41:843–848. doi: 10.1038/ng.392. [DOI] [PMC free article] [PubMed] [Google Scholar]
- 18.Dangi-Garimella S, Yun J, Eves EM, Newman M, et al. EMBO J. 2009;28:347–358. doi: 10.1038/emboj.2008.294. [DOI] [PMC free article] [PubMed] [Google Scholar]
- 19.Gunaratne PH. Curr Stem Cell Res Ther. 2009;4:168–177. doi: 10.2174/157488809789057400. [DOI] [PubMed] [Google Scholar]
- 20.Wang R, Dashwood WM, Lohr CV, Fischer KA, et al. Carcinogenesis. 2008;29:834–839. doi: 10.1093/carcin/bgn051. [DOI] [PMC free article] [PubMed] [Google Scholar]
- 21.Wang R, Dashwood WM, Lohr CV, Fischer KA, et al. Cancer Sci. 2008;99:1754–1759. doi: 10.1111/j.1349-7006.2008.00887.x. [DOI] [PMC free article] [PubMed] [Google Scholar]
- 22.Wang R, Dashwood WM, Nian H, Lohr CV, et al. Int J Cancer. 2011;128:2581–2590. doi: 10.1002/ijc.25610. [DOI] [PMC free article] [PubMed] [Google Scholar]
- 23.Rajendran P, Delage B, Dashwood WM, Yu TW, et al. Mol Cancer. 2011;10:68. doi: 10.1186/1476-4598-10-68. [DOI] [PMC free article] [PubMed] [Google Scholar]
- 24.Garzon R, Marcucci G, Croce CM. Nat Rev Drug Discov. 2010;9:775–789. doi: 10.1038/nrd3179. [DOI] [PMC free article] [PubMed] [Google Scholar]
- 25.Takahashi K, Yamanaka S. Cell. 2006;126:663–676. doi: 10.1016/j.cell.2006.07.024. [DOI] [PubMed] [Google Scholar]
- 26.Ubagai T, Ochiai M, Kawamori T, Imai H, et al. Carcinogenesis. 2002;23:197–200. doi: 10.1093/carcin/23.1.197. [DOI] [PubMed] [Google Scholar]
- 27.Ito N, Hasegawa R, Sano M, Tamano S, et al. Carcinogenesis. 1991;12:1503–1506. doi: 10.1093/carcin/12.8.1503. [DOI] [PubMed] [Google Scholar]
- 28.Izzotti A, Calin GA, Arrigo P, Steele VE, et al. FASEB J. 2009;23:806–812. doi: 10.1096/fj.08-121384. [DOI] [PMC free article] [PubMed] [Google Scholar]
- 29.Malik AI, Williams A, Lemieux CL, White PA, Yauk CL. Environ Mol Mutagen. 2012;53:10–21. doi: 10.1002/em.20668. [DOI] [PMC free article] [PubMed] [Google Scholar]
- 30.Chen D, Li Z, Chen T. J Appl Toxicol. 2011;31:496–498. doi: 10.1002/jat.1640. [DOI] [PubMed] [Google Scholar]
- 31.Shah MS, Schwartz SL, Zhao C, Davidson LA, et al. Physiol Genomics. 2011;43:640–654. doi: 10.1152/physiolgenomics.00213.2010. [DOI] [PMC free article] [PubMed] [Google Scholar]
- 32.Calin GA, Sevignani C, Dumitru CD, Hyslop T, et al. Proc Natl Acad Sci U S A. 2004;101:2999–3004. doi: 10.1073/pnas.0307323101. [DOI] [PMC free article] [PubMed] [Google Scholar]
- 33.Piskounova E, Polytarchou C, Thornton JE, LaPierre RJ, et al. Cell. 2011;147:1066–1079. doi: 10.1016/j.cell.2011.10.039. [DOI] [PMC free article] [PubMed] [Google Scholar]
- 34.Viswanathan SR, Daley GQ. Cell. 2010;140:445–449. doi: 10.1016/j.cell.2010.02.007. [DOI] [PubMed] [Google Scholar]
- 35.Karaayvaz M, Pal T, Song B, Zhang C, et al. Clin Colorectal Cancer. 2011;10:340–347. doi: 10.1016/j.clcc.2011.06.002. [DOI] [PMC free article] [PubMed] [Google Scholar]
- 36.Nam Y, Chen C, Gregory RI, Chou JJ, Sliz P. Cell. 2011;147:1080–1091. doi: 10.1016/j.cell.2011.10.020. [DOI] [PMC free article] [PubMed] [Google Scholar]
- 37.King CE, Cuatrecasas M, Castells A, Sepulveda AR, et al. Cancer Res. 2011;71:4260–4268. doi: 10.1158/0008-5472.CAN-10-4637. [DOI] [PMC free article] [PubMed] [Google Scholar]
- 38.Viswanathan SR, Daley GQ, Gregory RI. Science. 2008;320:97–100. doi: 10.1126/science.1154040. [DOI] [PMC free article] [PubMed] [Google Scholar]
- 39.Yu J, Vodyanik MA, Smuga-Otto K, Antosiewicz-Bourget J, et al. Science. 2007;318:1917–1920. doi: 10.1126/science.1151526. [DOI] [PubMed] [Google Scholar]
- 40.Jeter CR, Badeaux M, Choy G, Chandra D, et al. Stem Cells. 2009;27:993–1005. doi: 10.1002/stem.29. [DOI] [PMC free article] [PubMed] [Google Scholar]
- 41.Silva J, Nichols J, Theunissen TW, Guo G, et al. Cell. 2009;138:722–737. doi: 10.1016/j.cell.2009.07.039. [DOI] [PMC free article] [PubMed] [Google Scholar]
- 42.Saiki Y, Ishimaru S, Mimori K, Takatsuno Y, et al. Ann Surg Oncol. 2009;16:2638–2644. doi: 10.1245/s10434-009-0567-5. [DOI] [PubMed] [Google Scholar]
- 43.Migheli F, Migliore L. Clin Genet. 2012 doi: 10.1111/j.1399-0004.2011.01829.x. [DOI] [PubMed] [Google Scholar]
- 44.Huidobro C, Urdinguio RG, Rodriguez RM, Mangas C, et al. Eur J Cancer. 2012 doi: 10.1007/s00109-011-0837-0. [DOI] [PubMed] [Google Scholar]
- 45.Offenberg H, Brunner N, Mansilla F, Orntoft Torben F, Birkenkamp-Demtroder K. Mol Oncol. 2008;2:233–240. doi: 10.1016/j.molonc.2008.06.003. [DOI] [PMC free article] [PubMed] [Google Scholar]
- 46.Teunissen SF, Rosing H, Schinkel AH, Schellens JH, Beijnen JH. J Chromatogr B Analyt Technol Biomed Life Sci. 2010;878:3199–3216. doi: 10.1016/j.jchromb.2010.10.018. [DOI] [PubMed] [Google Scholar]
- 47.Carthew P, DiNovi M, Woodrow Setzer R. Food Chem Toxicol. 2010;48(Suppl 1):S98–105. doi: 10.1016/j.fct.2009.10.035. [DOI] [PubMed] [Google Scholar]
- 48.Ferguson LR, Philpott M. Annu Rev Nutr. 2008;28:313–329. doi: 10.1146/annurev.nutr.28.061807.155449. [DOI] [PubMed] [Google Scholar]
Associated Data
This section collects any data citations, data availability statements, or supplementary materials included in this article.


