

A systematic characterization of root system architecture and quantification of multiple root traits describes changes in overall root plasticity in response to nutrient deficiencies.
Abstract
Plant roots show a particularly high variation in their morphological response to different nutrient deficiencies. Although such changes often determine the nutrient efficiency or stress tolerance of plants, it is surprising that a comprehensive and comparative analysis of root morphological responses to different nutrient deficiencies has not yet been conducted. Since one reason for this is an inherent difficulty in obtaining nutrient-deficient conditions in agar culture, we first identified conditions appropriate for producing nutrient-deficient plants on agar plates. Based on a careful selection of agar specifically for each nutrient being considered, we grew Arabidopsis (Arabidopsis thaliana) plants at four levels of deficiency for 12 nutrients and quantified seven root traits. In combination with measurements of biomass and elemental concentrations, we observed that the nutritional status and type of nutrient determined the extent and type of changes in root system architecture (RSA). The independent regulation of individual root traits further pointed to a differential sensitivity of root tissues to nutrient limitations. To capture the variation in RSA under different nutrient supplies, we used principal component analysis and developed a root plasticity chart representing the overall modulations in RSA under a given treatment. This systematic comparison of RSA responses to nutrient deficiencies provides a comprehensive view of the overall changes in root plasticity induced by the deficiency of single nutrients and provides a solid basis for the identification of nutrient-sensitive steps in the root developmental program.
Plant survival and performance are highly dependent on the plant’s ability to efficiently explore the soil in the search for water and minerals. Thus, root growth and architecture are extremely relevant for the plant’s adaptation to the growth medium, as they determine the soil volume that a plant is able to explore at a given time. Root system architecture (RSA) represents the spatial arrangement of roots of different ages and orders (Lynch, 1995; Osmont et al., 2007) and is determined by genetic factors and the integration of environmental cues (Malamy, 2005). The genetic component determines the fundamental morphology and blueprint of a plant’s root system, whereas environmental cues shape root architecture by modifying the intrinsic genetic program. The existence of this additional level of regulation allows plants to display a high level of root plasticity, which reflects the shape, three-dimensional distribution, branching pattern, and age of the primary and postembryonically generated roots (Pacheco-Villalobos and Hardtke, 2012). The dynamic modulation of RSA is based on the intrinsic developmental nature of the different components of the root system. In fact, the primary root (PR) is established during embryogenesis, while the lateral roots (LRs) that originate from the PR develop postembryonically (Osmont et al., 2007; Péret et al., 2009). These highly dynamic changes in the overall RSA throughout time finally determine root plasticity and allow plants to efficiently adapt to environmental constraints.
Nutrient availability can exert a profound impact on RSA by altering the number, length, angle, and diameter of roots and root hairs (for review, see Forde and Lorenzo, 2001; López-Bucio et al., 2003; Malamy, 2005; Osmont et al., 2007). In fact, plants can respond to the heterogenous availability of resources by allocating roots where the most favorable conditions are found (Zhang and Forde, 1998; Linkohr et al., 2002; Remans et al., 2006; Lima et al., 2010; Giehl et al., 2012). When grown under limited phosphorus (P) availability, roots exhibit a shallower architecture that results from the inhibition of PR elongation and the concomitant increase in LR formation (Williamson et al., 2001; López-Bucio et al., 2002; Sanchez-Calderon et al., 2005). Such an architectural rearrangement of the root is thought to improve the plant’s ability to forage P from the usually P-enriched topsoil horizon (Lynch and Brown, 2001; Rubio et al., 2003; Zhu et al., 2005). In contrast to low P, reduced nitrogen (N) availability stimulates PR and particularly LR elongation but not LR initiation (Linkohr et al., 2002; López-Bucio et al., 2003). However, it is noteworthy that under severe N shortage, LR formation is almost completely absent (Krouk et al., 2010), suggesting that plants require a certain level of N to sustain an active foraging strategy. These examples indicate that the availability of different nutrients can evoke distinct effects on RSA that depend upon which nutrient is supplied and the concentration of the supplied nutrient.
Unfortunately, for the majority of the nutrients, a more detailed analysis of the architectural modifications under deficient conditions is still missing. In fact, most studies describe the effect of nutrient deficiencies on root growth and development only in terms of root biomass or total root length (Hermans and Verbruggen, 2005; Hermans et al., 2006; Richard-Molard et al., 2008; Jung et al., 2009; Cailliatte et al., 2010). Thus, important features of the root system are not comprehensible from these rather basic measurements. The characterization of RSA in more detail appears justified due to the positive correlations found between single root characteristics and plant yield, especially when the supply of water or mineral resources was limited (Landi et al., 2002; Tuberosa et al., 2002; Manschadi et al., 2006; Kirkegaard et al., 2007; Steele et al., 2007). Although a large number of studies have been conducted on the root development of grasses (Hochholdinger and Tuberosa, 2009; Iyer-Pascuzzi et al., 2010; Pacheco-Villalobos and Hardtke, 2012), our understanding of the molecular players involved in the regulation of root growth and development has benefited most from studies of the reference plant Arabidopsis (Arabidopsis thaliana) grown under controlled conditions to minimize variability. However, imposing consistent nutrient deficiencies presents an experimental challenge as long as plants are grown on agar medium, which is the method of choice to preserve the spatial arrangement of the root system and access a larger number of root traits.
A major drawback of agar and agarose media is their inherent nutrient load, such that traces of nutrient contamination must often be made unavailable to plants, for example by adding chelating agents to lower the free activities of micronutrients (Bell et al., 1991; Yang et al., 1994; Rengel, 1999). Additionally, in many cases, symptoms of deficiency are only observed in mutants impaired in the uptake of the nutrient in question (Tomatsu et al., 2007; Mills et al., 2008; Assunção et al., 2010). In general, gelling agents may contribute considerable amounts of nutrients (Debergh, 1983; Scholten and Pierik, 1998), hampering the occurrence of deficiency for specific nutrients (Jain et al., 2009). Thus, it becomes crucial to select the most suitable gelling agent when particular nutrient deficiencies are to be obtained. This is particularly relevant as strategies depending upon the use of gelling media are being developed to overcome the bottleneck that often limits RSA traits from being characterized in high-throughput phenotyping studies (Iyer-Pascuzzi et al., 2010; Clark et al., 2011).
In our approach to compare RSA under different nutrient deficiencies in Arabidopsis plants grown on solid medium, we first identified the most appropriate conditions for producing nutrient-deficient plants on agar plates. Once identified, these conditions allowed us to characterize the effects of 12 deficiencies at four intensity levels on the RSA by measuring seven root traits. These measurements, in combination with biomass and elemental concentrations, allowed us to determine the nutrient-specific effects on particular parameters of the RSA and thus to describe the root plasticity of Arabidopsis and analyze the underlying traits under different nutrient deficiencies.
RESULTS
The Choice of Gelling Agent Is Critical in Obtaining Nutrient-Deficient Plants
A number of gelling agents were tested for their suitability as a substrate on which to obtain plants deficient in several nutrients. An analysis of the elemental concentration within various types of agar, agarose, and gel media revealed a large variation in the levels of nutrients contained within the different gelling agents (Table I). Indeed, the variation in elemental concentrations ranged from approximately 4-fold (e.g. copper [Cu]) to 2,000-fold (e.g. potassium [K]) depending upon the element. Washing Difco agar five times with demineralized water reduced the concentration of some elements (boron [B] and P) by up to 4-fold, although for most elements the effect was minimal (data not shown). There was also some variation between batches of gelling agents, but this variation was less than 2-fold in the agents tested (data not shown). Typically, agaroses contained fewer elements than agar or gel; however, there was no single gelling agent that could be uniformly classified as containing the least contamination of all elements. Additionally, Arabidopsis seedlings grew poorly or inconsistently on the Sigma B agar and all of the agaroses tested (data not shown). The cause of the poor growth was not investigated further.
Table I. Elemental concentrations in a 1% agar/agarose solution.
All values are in µm. Shown are means (n = 3–4 measurements from the same batch). Different letters indicate significant differences among means in the column (P < 0.05; Tukey test). Boldface values indicate agar that was selected to study RSA responses to the deficiency of the nutrient in question. Al, Aluminum; Na; sodium.
| Element |
Al |
B |
Ca |
Cu |
Fe |
K |
Mg |
Mn |
Mo |
N |
Na |
P |
S |
Zn |
|
|---|---|---|---|---|---|---|---|---|---|---|---|---|---|---|---|
| 1/2 MS concentration | 0 | 50 | 1,500 | 0.05 | 75 | 10,025a | 750 | 50 | 0.5 | 11,400 | 0a | 625 | 750a | 15 | |
| Agar | Difco | 2.2 ab | 130 ab | 380 c | 0.22 ab | 2.1 abc | 730 ab | 170 ab | 0.13 e | 0 ns | 1,610 ab | 2,270 b | 5.9 abc | 1,840 a | 0.12 ab |
| Duchefa A | 1.8 ab | 83 ab | 340 d | 0.07 ab | 2.4 abc | 110 abc | 140 ab | 0.10 f | 0.012 ns | 1,320 b | 2,770 a | 12 abc | 1,620 b | 0.02 b | |
| Duchefa B | 3.6 ab | 150 a | 510 b | 0.07 ab | 1.9 abc | 440 abc | 390 a | 0.46 c | 0 ns | 1,510 ab | 2,070 c | 29 abc | 1,820 a | 0.18 ab | |
| Roth | 1.7 ab | 0 b | 84 g | 0.04 ab | 9.4 abc | 170 abc | 25 ab | 0.07 g | 0 ns | 280 c | 1,080 d | 18 abc | 690 e | 0.13 ab | |
| Sigma A | 45 a | 0 b | 550 a | 0.08 ab | 11 ab | 27,860 a | 320 ab | 1.10 b | 0 ns | 1,830 a | 2,050 c | 300 a | 1,090 d | 0.12 ab | |
| Sigma B | 3.1 ab | 40 ab | 510 b | 0.46 a | 4.1 abc | 69 abc | 56 ab | 0.25 d | 0 ns | 180 c | 870 e | 25 abc | 1,270 c | 0.41 ab | |
| Sigma C | 24 ab | 41 ab | 150 f | 0.31 ab | 21 a | 290 abc | 210 ab | 1.70 a | 0.005 ns | 1,510 ab | 2,800 a | 110 ab | 1,130 d | 0.57 a | |
| Agarose | Applichem | 0.5 b | 25 ab | 7 h | 0 b | 0.5 bc | 68 abc | 1 b | 0 h | 0 ns | 0 c | 610 f | 0.5 c | 46 f | 0.01 b |
| Serva | 4.3 ab | 0 b | 190 e | 0 b | 0.3 c | 22 bc | 60 ab | 0 h | 0 ns | 0 c | 76 g | 6.4 abc | 58 f | 0.10 ab | |
| Sigma D | 0.6 b | 46 ab | 11 h | 0 b | 0.9 abc | 14 c | 2 b | 0.01 h | 0 ns | 310 c | 780 e | 1.8 bc | 66 f | 0.03 ab | |
Not considering that contained within the MES buffer (pH adjusted with KOH or NaOH).
Gelling agents that enabled healthy plant growth were then specifically chosen for each nutrient based on the elemental concentration within the agent (Table I). Generally, the gelling agent with a lower concentration of the nutrient in question was selected. However, there were some instances where a greater visible response of the shoot or roots to nutrient deficiency, and thereby most likely a greater degree of nutrient deficiency, was achieved by using an agent that did not have the lowest concentration (Table I). This may be because the concentration of nutrients available to the plant is lower than what was measured, probably due to some of the nutrients being bound in forms that plants were unable to acquire. Indeed, calcium (Ca) was the only nutrient whereby a gelling agent (Sigma A) was selected that contained substantially more nutrient than the other gelling agents. In this case, much of the Ca is probably bound within the gelling matrix, resulting in a lower plant-available Ca concentration. In general, we observed a similar dependence of the root morphology under nutrient deficiency on the type of gelling agent to that described by Jain et al. (2009), which was most likely related to nutrient levels in the agar medium. Consequently, we decided to monitor changes in root traits by comparing adequately supplied plants with plants grown not only in the complete absence of a nutrient but at three levels of deficiency. The parallel determination of nutrient concentrations in the shoot allowed nutrient supplies to be set to ensure nutrient deficiency at the lowest supply. This approach allowed us to observe the progression in change of root traits under nutrient deficiency.
The Response of the RSA to the Deficiency of Macronutrients
P
With decreasing P supply, P concentrations in shoots decreased steadily from 14.0 to 1.1 mg g−1 (Table II) and thus gradually into severe P deficiency (optimal P concentrations in plants range from 3 to 5 mg g−1; Marschner, 2012). Additionally, K and magnesium (Mg) concentrations in shoots decreased significantly, in particular under the most severe P deficiency (Supplemental Table S1). This is in agreement with a previous report showing that K concentrations decrease significantly in shoots of P-deficient plants (Misson et al., 2005). The fresh weight of the shoot decreased by 40% at moderate P deficiency (50 µm) and by 90% at severe P deficiency (0 µm). By contrast, the fresh weight of the root decreased significantly only at severe P deficiency (70% reduction at 0 µm; Table II). The root-to-shoot ratio thereby increased with decreasing P supply.
Table II. Dry weight, root-to-shoot ratio, and elemental concentrations of shoots and roots of plants grown on varying concentrations of nutrients.
Different letters indicate significant differences among means for each nutrient either in shoots or roots (P < 0.05; Tukey test). n.a., Not assessed, as there was too little root material; ns, not significant.
| Nutrient | Treatment | Fresh Weight |
Root:Shoot Ratio | Nutrient Concentration |
||
|---|---|---|---|---|---|---|
| Shoot | Root | Shoot | Root | |||
| µm added | mg plant−1 | mg g−1 | ||||
| P | 625 | 12.4 a | 2.7 a | 0.22 | 14.0 a | 13.0 a |
| 100 | 8.8 ab | 2.2 a | 0.25 | 9.8 b | 7.9 ab | |
| 50 | 7.1 b | 1.9 ab | 0.27 | 5.5 c | 7.0 b | |
| 6 µma | 0 | 1.3 b | 0.8 b | 0.61 | 1.1 d | 2.9 b |
| N | 11,400 | 10.0 ab | 2.6 a | 0.26 | 72 a | 48 a |
| 550 | 10.7 a | 3.2 a | 0.30 | 66 b | 45 a | |
| 275 | 6.2 bc | 2.3 ab | 0.37 | 48 c | 39 b | |
| 1,610 µm a | 110 | 3.1 c | 1.3 b | 0.43 | 29 d | n.a. |
| Ca | 1,500 | 12.2 c (0.73 b)b | 3.9 c (0.41 ns) | 0.32 (0.56) | 4.1 a | 2.6 ns |
| 500 | 15.9 b (0.90 ab) | 6.4 b (0.57 ns) | 0.40 (0.63) | 3.2 ab | 2.1 ns | |
| 100 | 18.9 a (1.10 a) | 8.2 a (0.52 ns) | 0.43 (0.48) | 1.5 bc | 1.9 ns | |
| 550 µma | 0 | 19.5 a (1.03 a) | 7.2 ab (0.50 ns) | 0.37 (0.49) | 1.2 c | 1.7 ns |
| K | 10,025 | 13.7 a | 3.6 a | 0.27 | 97 a | 75 a |
| 1,600 | 14.3 a | 3.3 a | 0.23 | 49 ab | 44 b | |
| 250 | 12.9 ab | 2.8 a | 0.21 | 41 b | 41 b | |
| 110 µma | 0 | 5.2 b | 1.4 b | 0.27 | 7 c | 13 b |
| Mg | 750 | 13.1 a | 4.1 a | 0.31 | 3.1 a | 1.2 a |
| 100 | 10.1 b | 2.8 b | 0.28 | 1.3 b | 0.5 b | |
| 50 | 6.3 c | 2.0 c | 0.33 | 0.9 c | 0.4 bc | |
| 25 µma | 0 | 1.8 d | 0.6 d | 0.31 | 0.4 d | 0.3 c |
| S | 750 | 11.4 a | 5.7 a | 0.50 | 10.0 a | 5.9 a |
| 50 | 11.3 a | 6.3 a | 0.56 | 8.0 b | 4.4 b | |
| 25 | 10.3 a | 6.0 a | 0.58 | 5.7 c | 3.9 c | |
| 690 µma | 0 | 6.8 b | 4.1 b | 0.60 | 3.7 d | 2.9 d |
| Fe | 75 | 9.6 ns | 2.4 a | 0.25 | 0.12 a | 4.0 ns |
| 10 | 9.4 ns | 2.6 a | 0.28 | 0.07 ab | 1.4 ns | |
| 5 | 9.1 ns | 2.4 a | 0.26 | 0.07 ab | 0.4 ns | |
| 2 µma | 0 | 1.6 ns | 0.3 b | 0.19 | 0.01 b | 0.2 ns |
| µg g−1 | ||||||
| Mn | 50 | 12.8 ab | 3.7 a | 0.29 | 310 a | 190 a |
| 1 | 13.0 a | 3.5 a | 0.27 | 24 ab | 11 ab | |
| 0.5 | 11.4 b | 3.1 a | 0.27 | 17 b | 8.9 b | |
| 130 nma | 0 | 6.8 c | 1.8 b | 0.27 | 10 b | 6.4 b |
| B | 50 | 12.2 ns | 4.3 a | 0.35 | 38 a | 30 a |
| 1 | 12.0 ns | 3.8 ab | 0.32 | 16 ab | 18 b | |
| 0.4 | 11.8 ns | 3.5 ab | 0.30 | 13 bc | 17 b | |
| 0 µma | 0 | 10.3 ns | 2.8 b | 0.27 | 10 c | 20 b |
The baseline concentration of the nutrient contained within the agar used for the experiment. bValues in parentheses are dry weights.
The deficiency of P produced a root system that was shallower but more highly branched (Fig. 1A). Such an effect of low P on RSA has already been reported (Williamson et al., 2001; López-Bucio et al., 2002, 2003; Pérez-Torres et al., 2008). However, our detailed RSA analysis also revealed that low P supply not only inhibited PR length but also decreased the length of the LR formation zone in the PR (LR FZPR) relative to the length of the whole PR (Fig. 1C). The decrease in the PR length was accompanied by an increase in the density of first-order lateral roots (1° LRs) at moderate P deficiency (50 µm P), but this also decreased upon the more severe deficiency achieved at 0 µm P (Fig. 1D). It is noteworthy that, throughout this study, LR densities are reported as the number of visible LRs divided by the length of the branching zone (BZ). According to Dubrovsky and Forde (2012), the estimation of LR density within only the primary root BZ (BZPR) is a more appropriate measurement, especially when the proportion of the PR that is branching is altered, as was the case under reduced P supplies (Fig. 1C).
Figure 1.

The effect of P deficiency on root morphology. A, Seedlings subjected to differing P supplies. B, Total root length. C, PR length consisting of the BZPR (darker gray) and LR FZPR (lighter gray). D, 1° LR density. E, Average 1° LR length. F, 2° LR density. G, Average 2° LR length. The numbers within the LR FZPR bar of C indicate the length of the LR FZPR as a percentage of the total PR length. Seedlings were cultivated for 5 d with no P added and then grown on the P treatments indicated for a further 13 d. Bars show means ± se (n = 21–29). [See online article for color version of this figure.]
Similar to the PR, the average 1° LR length also decreased with decreasing P supply (Fig. 1E) and was accompanied by an increase in the density of second-order lateral roots (2° LRs) that tended to increase even under severe P deficiency (0 µm; Fig. 1F). Interestingly, the average 2° LR length was barely affected by P deficiency (Fig. 1G), suggesting that the elongation of these roots is less sensitive to P deficiency than the other two orders of roots. The total root length decreased with increasing P deficiency (Fig. 1B) and was most correlated with the PR length (Pearson’s r = 0.905, P = 2 × 10−37).
N
The concentration of N in shoots decreased by 33% from the full supply to the 275 µm treatment and by 61% from the full supply to the 110 µm treatment, yielding finally N-deficient plants with less than 3% N (Table II), which is below the usual 4.0% to 5.5% N required by plants (Bergmann, 1992). Plants grown on 110 µm added N had a reduced shoot and root weight relative to the full N supply. However, as the biomass of the root decreased comparatively less than the shoot, the root-to-shoot ratio gradually increased under decreasing N supply from 0.26 at the full supply to 0.43 at 110 µm N (Table II).
N deficiency stimulated the growth of a more exploratory root system with longer LRs (Fig. 2A). Although similar observations have also been reported by López-Bucio et al. (2003), RSA modifications under N limitation have not yet been characterized in detail. Average 1° LR length was significantly stimulated under the moderate N deficiencies obtained at 550 and 275 µm N (74% and 31%, respectively, relative to the full supply) and returned to the same level as the full supply at 110 µm N (Fig. 2E). By contrast, PR length remained stable at the moderate N deficiency at which LRs positively responded (550 and 275 µm) and decreased under more severe N deficiency (Fig. 2C). Although the length of the PR decreased at the lowest N supply, the proportion of the PR occupied by the LR FZPR increased from around 30% at greater N supplies to 39% at 110 µm N, while the density of 1° LRs remained stable (Fig. 2, C and D). The total root length increased under moderate N deficiency by 48% (550 µm) and decreased under the most severe N deficiency by 42% (110 µm; Fig. 2B). This correlated most positively with the PR length (Pearson’s r = 0.912, P = 1 × 10−43) and average LR length (Pearson’s r = 0.882, P = 4 × 10⁻³⁴).
Figure 2.

The effect of N deficiency on root morphology. A, Seedlings subjected to differing N supplies. B, Total root length. C, PR length consisting of the BZPR (darker gray) and LR FZPR (lighter gray). D, 1° LR density. E, Average 1° LR length. F, 2° LR density. G, Average 2° LR length. The numbers within the LR FZPR bar of C indicate the length of the LR FZPR as a percentage of the total PR length. Seedlings were cultivated for 4 d on 165 µm added N and then grown on the N treatments indicated for a further 14 d. Bars show means ± se (n.s. denotes not significant; n = 17–30). [See online article for color version of this figure.]
Ca
The selection of an adequate gelling agent enabled us to decrease shoot Ca concentrations from 4.1 to 1.2 mg g−1 (Table II) and thus from typical sufficiency to deficiency levels (Marschner, 2012). With increasing Ca deficiency, the fresh weight of shoots and roots increased by 60% and 85%, respectively (Table II). However, withholding Ca from the nutrient mix decreased the solidity of the gelling medium in a step-wise fashion (data not shown). This was the only instance among all the experiments where changing the nutrient solution visibly affected the gelling medium. Through the decreased solidity of the growth medium, it appeared that plants became more moist. An additional determination of the dry weight still indicated that shoot weight increased with Ca deficiency. The root dry weight did not change significantly, resulting in a decrease in the root-to-shoot ratio at lower Ca supplies (Table II).
The deficiency of Ca produced a very shallow and highly branched root system (Fig. 3A). The PR was severely inhibited when less than 100 µm Ca was added and moderately inhibited at 500 µm Ca supply (Fig. 3C). The length of the LR FZPR also decreased with lower Ca supplies, as did the proportion of the PR consisting of the LR FZPR, reducing from 34% in the full supply to 23% when no Ca was added (Fig. 3C). The decrease in the length of PRs was accompanied by an increase in the density of 1° LRs (Fig. 3D). However, in contrast to PRs, 1° LR length was not inhibited but rather marginally stimulated at 100 µm added Ca (Fig. 3E), indicating that LRs are less sensitive to low Ca than PRs. It is noteworthy that the 2° LR density and average length were unaffected by the Ca supply (Fig. 3, F and G). Remarkably, despite the effects on the PR and 1° LR density, the total root length was maintained at all concentrations of Ca supplied to plants (Fig. 3B). In order to rule out that the RSA modifications observed under limited Ca supply were not due to the altered solidity of the gelling agent, Ca-supplied plants were grown under lower concentrations of agar. Although low agar concentrations also reduced the solidity of the medium, the RSA of plants was not negatively affected, even when only 0.2% agar was used (data not shown). Thus, the RSA effects observed under low Ca are not primarily a consequence of the nonspecific effects of agar solidity.
Figure 3.

The effect of Ca deficiency on root morphology. A, Seedlings subjected to differing Ca supplies. B, Total root length. C, PR length consisting of the BZPR (darker gray) and LR FZPR (lighter gray). D, 1° LR density. E, Average 1° LR length. F, 2° LR density. G, Average 2° LR length. The numbers within the LR FZPR bar of C indicate the length of the LR FZPR as a percentage of the total PR length. Seedlings were cultivated for 7 d with no Ca added and then grown on the Ca treatments indicated for a further 10 d. Bars show means ± se (n.s. denotes not significant; n = 14–24). [See online article for color version of this figure.]
K
Shoot and root biomass significantly decreased by around 60% at only the lowest concentration of K supplied, and the root-to-shoot ratio remained stable across different levels of K deficiency (Table II). The K concentration in shoots was significantly reduced in both the 250 and 0 µm treatments, while in roots, a significant reduction was observed in all treatments where K supply was reduced. The critical concentration of K required for optimal plant growth is around 20 to 50 mg g−1 dry weight (Marschner, 2012). Therefore, the plants grown in 0 µm K, with a shoot K concentration of 7 mg g−1 dry weight, suffered K deficiency, while those in the 250 and 1,600 µm K treatment suffered mild K deficiency (Table II).
The deficiency of K produced a root system that became shorter (Fig. 4A). The PR length decreased at even moderate K deficiency (1,600 µm) by 23% and decreased further to 40% at the lowest K treatment (0 µm; Fig. 4C). Despite the decrease in PR length, the 1° LR density only tended to, but did not significantly increase, as K deficiency became more severe (Fig. 4D). The average length of 1° LRs significantly decreased in only the two lowest K supplies by up to 42% (Fig. 4E). The decrease in the elongation of 1° LRs was accompanied by an increase in the density of 2° LRs, although this effect was significant in only the 0 µm K treatment (Fig. 4F). Total root length decreased with more severe K deficiency, reaching just 45% of the maximum length when K was excluded from the medium (Fig. 4B). This decrease correlated most with the average length of 1° LRs (Pearson’s r = 0.890, P = 8 × 10⁻³³) and the length of the PR (Pearson’s r = 0.756, P = 3 × 10⁻²¹).
Figure 4.

The effect of K deficiency on root morphology. A, Seedlings subjected to differing K supplies. B, Total root length. C, PR length consisting of the BZPR (darker gray) and LR FZPR (lighter gray). D, 1° LR density. E, Average 1° LR length. F, 2° LR density. G, Average 2° LR length. The numbers within the LR FZPR bar of C indicate the length of the LR FZPR as a percentage of the total PR length. Seedlings were cultivated for 7 d on 60 µm added K and then grown on the K treatments indicated for a further 12 d. Bars show means ± se (n.s. denotes not significant; n = 25–30). [See online article for color version of this figure.]
Mg
The biomass of shoots and roots decreased with each reduction in Mg supply by up to 14% in shoots and 15% in roots when no Mg was added to the medium (Table II). A reduction in the amount of Mg supplied in the growth medium from 750 to 0 µm resulted in a decrease in the Mg concentration from 3.1 to 0.4 mg g−1 dry weight in shoots and 1.2 to 0.3 mg g−1 dry weight in roots (Table II). The level of deficiency obtained spanned the critical concentration range of 1.5 to 3.5 mg g−1 Mg typically required for plant growth (Hermans and Verbruggen, 2005; Marschner, 2012), indicating that plants supplied with less Mg experienced Mg deficiency.
The deficiency of Mg generally inhibited plant growth, resulting in a contracted root and smaller shoots (Fig. 5A). The length of the PR, and the average lengths of 1° LRs and 2° LRs, significantly decreased at the two lowest levels of Mg supply, reducing by 56%, 80%, and 99%, respectively, in the 0 µm Mg treatment (Fig. 5, C, E, and G). The density of 1° LRs also decreased at the two lowest Mg treatments (Fig. 5D). However, the density of 2° LRs did not change significantly in any of the treatments (Fig. 5F). The total length of the root system was significantly shorter in the 50 and 0 µm Mg treatments (Fig. 5B). This correlated most with the average 1° LR length (Pearson’s r = 0.910, P = 1 × 10−40) and density (Pearson’s r = 0.890, P = 1 × 10⁻³⁴).
Figure 5.

The effect of Mg deficiency on root morphology. A, Seedlings subjected to differing Mg supplies. B, Total root length. C, PR length consisting of the BZPR (darker gray) and LR FZPR (lighter gray). D, 1° LR density. E, Average 1° LR length. F, 2° LR density. G, Average 2° LR length. The numbers within the LR FZPR bar of C indicate the length of the LR FZPR as a percentage of the total PR length. Seedlings were cultivated for 4 d on 50 µm added Mg and then grown on the Mg treatments indicated for a further 14 d. Bars show means ± se (n.s. denotes not significant; n = 24–27, except that the bars marked with asterisks had only three 2° LRs). [See online article for color version of this figure.]
Sulfur
The withdrawal of sulfur (S) from the growth medium reduced the shoot biomass by up to 40% and the root biomass by up to 28% in the case of the 0 µm S treatment, resulting in an increase in the root-to-shoot ratio (Table II). The concentration of S decreased steadily with each reduction in S supply, dropping in shoots from a maximum of 10 mg g−1 dry weight in the full S supply to 3.7 mg g−1 dry weight in the treatment in which S was withheld (Table II). In roots, the relative reduction in S concentration was less, decreasing from 5.9 to 2.9 mg g−1 dry weight. The levels of deficiency achieved in the lowest S treatments were at or below the minimum of 1 to 5 mg g−1 dry weight required for optimal growth (Marschner, 2012), demonstrating that a level of S deficiency was achieved that is limiting for plant growth. In addition, as the added concentrations of S were decreased, the concentrations of molybdenum (Mo), especially in shoots, increased significantly (Supplemental Table S1). Such a response has been reported before (Alhendawi et al., 2005) and most likely reflects a poor selectivity of some S transporters over Mo. Surprisingly, although shoots were negatively affected by reducing S supply, the deficiency of S had relatively little influence on the morphology of roots (Fig. 6A). The length of the PR increased slightly, albeit significantly only at the two lowest S supplies, by up to 12% (Fig. 6C). There was a slight decrease in the density of 1° LRs with a significant increase in the average length of 1° LRs (Fig. 6E). There were no significant differences in these two traits between the full S supply and the two lowest treatments, nor was there any difference in the density or average length of 2° LRs between any of the S treatments (Fig. 6, F and G). Due to a relatively minor effect on each of the individual components of the RSA, the total root length was barely affected by S deficiency.
Figure 6.

The effect of S deficiency on root morphology. A, Seedlings subjected to differing S supplies. B, Total root length. C, PR length consisting of the BZPR (darker gray) and LR FZPR (lighter gray). D, 1° LR density. E, Average 1° LR length. F, 2° LR density. G, Average 2° LR length. The numbers within the LR FZPR bar of C indicate the length of the LR FZPR as a percentage of the total PR length. Seedlings were cultivated for 6 d with no S added and then grown on the S treatments indicated for a further 11 d. Bars show means ± se (n.s. denotes not significant; n = 19–26). [See online article for color version of this figure.]
There have been conflicting reports on the effect of S deficiency on RSA. It is often stated that S deficiency increases LR density and decreases the length of the LR FZPR such that LRs form closer to the tip of the PR (Kutz et al., 2002; López-Bucio et al., 2003). However, Dan et al. (2007) found, as we did, that PR length slightly increased and 1° LR density decreased under S deficiency. Similar to the results presented here, Kutz et al. (2002) also found a reduction in the shoot weight of plants grown under S deficiency. Differences in the RSA between the study of Kutz et al. (2002) and that of Dan et al. (2007) and here may arise from the use of a different nutrient mixture or, in the case of Kutz et al. (2002), from the growth of plants for 6 weeks on small agar plates that, under our conditions, usually results in a range of negative growth effects on plants. Additionally, the study of Kutz et al. (2002) did not quantify components of the RSA.
The Response of the RSA to the Deficiency of Micronutrients
Iron
A decrease in the iron (Fe) supplied to plants had no effect on the shoot and root biomass of plants at the first three levels of Fe supply; however, in the most severe treatment, the shoot and root biomass decreased significantly by 83% and 88%, respectively (Table II). The concentration of Fe in shoots decreased from 120 µg g−1 dry weight in the full supply (75 µm) of Fe to 70 µg g−1 dry weight in the 10 and 5 µm treatments and further to 10 µg g−1 dry weight in the 0 µm treatment (Table II). Because plants require between 50 and 150 µg g−1 dry weight of Fe for growth (Marschner, 2012), the 10 and 5 µm treatments most likely reflected mild Fe deficiency and the 0 µm treatment reflected a severe deficiency of Fe. Additionally, the concentrations of manganese (Mn) and zinc (Zn) increased under Fe deficiency (Supplemental Table S1), which was most likely associated with the poor substrate selectivity of the Fe deficiency-induced Fe transporter IRON-REGULATED TRANSPORTER1 (IRT1) (Vert et al., 2002). A mild deficiency of Fe increased root elongation; however, severe Fe deficiency caused stunting of roots and shoots (Fig. 7A). The length of the PR increased by 15% to 17% under moderate Fe deficiency (5 and 10 µm Fe, respectively) and drastically decreased by 56% in the severe Fe deficiency achieved when Fe was withheld from the medium (Fig. 7C). The LR FZPR responded similarly to moderate deficiency as the PR length but decreased again under severe Fe deficiency to the same length as in plants grown under full Fe supply. However, in the latter case, the LR FZPR occupied a large proportion (61%) of the length of the PR. While plants grown on 10 µm added Fe showed an increase in PR length, the 1° LR density was not different from that of plants grown on full Fe (Fig. 7D). At 5 µm Fe, the 1° LR density decreased by 19%, and this extended to 69% in 0 µm Fe. While the average 1° LR length tended to increase under moderate Fe deficiency, the difference was not significant (Fig. 7E). However, under severe Fe deficiency, the length decreased by 71% relative to full Fe supply. Despite differences in the individual components of the RSA, the total root length did not change when plants were exposed to moderate Fe deficiency but drastically reduced under conditions of severe Fe deficiency (Fig. 7B).
Figure 7.

The effect of Fe deficiency on root morphology. A, Seedlings subjected to differing Fe supplies. B, Total root length. C, PR length consisting of the BZPR (darker gray) and LR FZPR (lighter gray). D, 1° LR density. E, Average 1° LR length. F, 2° LR density. G, Average 2° LR length. The numbers within the LR FZPR bar of C indicate the length of the LR FZPR as a percentage of the total PR length. Seedlings were cultivated for 4 d with no Fe added and then grown on the Fe treatments indicated for a further 12 d. Bars show means ± se (n.s. denotes not significant; n = 19–30, except that the bars indicated with asterisks had only two 2° LRs). [See online article for color version of this figure.]
Mn
Mn deficiency significantly reduced the biomass of shoots and roots by 47% and 51%, respectively, when Mn was withheld from the medium (Table II). While the concentration of Mn in shoots and roots decreased with each reduction in Mn supply, only the 0.5 and 0 µm Mn treatments contained plants with significantly lower Mn than the full 50 µm Mn supply. With regard to the critical concentration of Mn required for plant growth (10–20 µg g−1 dry weight; Bergmann, 1992; Cailliatte et al., 2010; Marschner, 2012), plants suffered from Mn deficiency, particularly in the two lowest Mn treatments. Mn deficiency produced plants with a contracted root system (Fig. 8A). This arose from a reduction in the length of the PR that was present at all treatments in which the supply of Mn was reduced (Fig. 8C). In turn, the density of 1° LRs increased by 10% in the 1 and 0.5 µm treatments while decreasing by 9% in the 0 µm Mn treatment relative to the full Mn supply (Fig. 8D). The average 1° LR length did not respond to moderate Mn deficiency but suffered a 22% decrease in the lowest Mn treatment (Fig. 8E). While the density of 2° LRs did not significantly respond to Mn deficiency, the average 2° LR length decreased by 40% in the 0 µm treatment (Fig. 8, F and G). The total root length declined significantly in the 0.5 and 0 µm Mn treatments (Fig. 8B). Components of the RSA were relatively poorly correlated with total root length, as the best correlation was with the average length of 1° LRs (Pearson’s r = 0.751, P = 9 × 10⁻¹⁸).
Figure 8.

The effect of Mn deficiency on root morphology. A, Seedlings subjected to differing Mn supplies. B, Total root length. C, PR length consisting of the BZPR (darker gray) and LR FZPR (lighter gray). D, 1° LR density. E, Average 1° LR length. F, 2° LR density. G, Average 2° LR length. The numbers within the LR FZPR bar of C indicate the length of the LR FZPR as a percentage of the total PR length. Seedlings were cultivated for 4 d with no Mn added and then grown on the Mn treatments indicated for a further 13 d. Bars show means ± se (n.s. denotes not significant; n = 16–28). [See online article for color version of this figure.]
B
B deficiency is particularly difficult to achieve when using typical laboratory practices for producing growth medium due to B contamination arising from borosilicate glassware. Additionally, the use of some autoclavable, plastic vessels (e.g. polypropylene) caused severe stunting of plants (data not shown), possibly due to the release of toxic compounds from the plastic during the autoclaving process. The use of polytetrafluoroethylene (PTFE) vessels (Carl Roth) and Sigma A agar were required to obtain B deficiency in this study.
Root biomass decreased by 35% when B was withheld from the medium; however, there was no change in the shoot biomass in any of the B treatments (Table II). The root-to-shoot ratio, therefore, decreased with decreasing B supply. The concentration of B decreased in shoots by a maximum of 74% from 38 µg g−1 dry weight in the full B treatment to 10 µg g−1 dry weight in the zero B treatment (Table II), which is below the levels reported for B-deficient Arabidopsis plants in another study (Takano et al., 2006). The concentration also significantly decreased in roots in each of the treatments in which B was withdrawn; however, the reduction was not as great as in shoots. B deficiency produced a shallower root system with greater LR growth (Fig. 9A). The length of the PR significantly decreased in all B deficiency treatments, by up to 39% in the case of the 0 µm B treatment (Fig. 9C). The decreasing PR length was accompanied by an increase in the density of 1° LRs, although the increase reached a maximum of just 27% in the case of the 0 μm treatment (Fig. 9D). The length of 1° LRs and 2° LRs did not respond to the deficiency of B (Fig. 9, E and G), nor did the density of 2° LRs (Fig. 9F). Total root length decreased in each of the treatments where B was withheld; however, this weakly correlated with PR length (Pearson’s r = 0.662, P = 8 × 10⁻¹⁴), suggesting that further root traits made a substantial contribution to the reduction of the root system as a whole (Fig. 9B).
Figure 9.

The effect of B deficiency on root morphology. A, Seedlings subjected to differing B supplies. B, Total root length. C, PR length consisting of the BZPR (darker gray) and LR FZPR (lighter gray). D, 1° LR density. E, Average 1° LR length. F, 2° LR density. G, Average 2° LR length. The numbers within the LR FZPR bar of C indicate the length of the LR FZPR as a percentage of the total PR length. Seedlings were cultivated for 7 d with no B added and then grown on the B treatments indicated for a further 12 d. Bars show means ± se (n.s. denotes not significant; n = 23–26). [See online article for color version of this figure.]
Zn
Zn deficiency was difficult to obtain in any of the agar media tested when plants were grown for 2 weeks on 12-cm agar plates. However, growth on 23-cm agar plates for almost 4 weeks produced larger plants that showed differences in root growth when Zn was withheld from the medium (Supplemental Fig. S1). Although there was no difference in shoot or root biomass, the concentration of Zn decreased in shoots and roots by 81% and 94%, respectively (Supplemental Table S2). The Zn concentration of 22 µg g−1 dry weight obtained in shoots in the 0 µm Zn treatment approached the critical level of 15 to 20 µg g−1 dry weight of Zn required for optimal growth in plants (Bergmann, 1992; Marschner, 2012). Therefore, a mild level of Zn deficiency was achieved in this study (Supplemental Table S1). Zn deficiency produced a more highly branched root system (Supplemental Fig. S1A). Although the length of the PR was unaffected by Zn deficiency (Supplemental Fig. S1C), the density of 1° LRs increased by 21% (Supplemental Fig. S1D). Additionally, despite the absence of an effect on PR length, the lengths of both 1° LRs and 2° LRs were decreased upon Zn deficiency by 19% and 22%, respectively (Supplemental Fig. S1, E and G). The density of 2° LRs was unaffected by Zn deficiency (Supplemental Fig. S1F).
Remaining Micronutrients
Because plants require only extremely low amounts of nickel and Mo (Marschner, 2012), the occurrence of a deficiency of these nutrients is not common and is difficult to simulate in the laboratory, especially in relatively young plants. Thus, in this study, no attempt was made to induce nickel or Mo deficiency in agar medium. The withdrawal of the two remaining micronutrients, Cu and chlorine (Cl), only produced minor effects. The withdrawal of Cu from the growth medium did not produce any changes in the shoot or root biomass; however, the concentration of Cu in shoots and roots tended to decrease even though this was not statistically significant (Supplemental Table S2). Therefore, we acknowledge that the level of Cu deficiency obtained in this study was indeed minor when considering that the critical level of Cu required by plants is between 1 and 5 µg g−1 dry weight (Marschner, 2012). Cu deficiency decreased the length of 1° LRs by a maximum of 29% in the 1 nm treatment (Supplemental Fig. S2E). In addition, while the length of PRs did not respond to Cu deficiency, the density of 1° LRs increased by up to 11% in the case of the 1 nm treatment (Supplemental Fig. S2, C and D). 2° LRs were unaffected by Cu deficiency (Supplemental Fig. S2, F and G).
The withdrawal of Cl from the medium did not affect shoot and root biomass. Due to the technical limitations of inductively coupled plasma optical emission spectroscopy, it was not possible to measure Cl concentrations. We acknowledge that in our agar growth system we were barely able to obtain evidence of Cl deficiency. There was hardly any effect of the removal of Cl from the growth medium on plant growth, probably because of the marginal level of Cl deficiency obtained (Supplemental Fig. S3). The PR was the only component of plant growth that was affected by a reduction in Cl supply, decreasing by just 9%; similarly, the length of the LR FZPR decreased by 15% (Supplemental Fig. S3C). These data may suggest that the PR is the root trait most sensitive to a reduction in Cl supply.
Development of a Quantitative Score for Overall Changes in RSA
The results from this work clearly indicate that nutrient deficiencies impose highly distinct modifications on the overall RSA of Arabidopsis plants (Figs. 1–9). Root traits that were independent of each other were used in a principal component analysis (PCA) to capture the major trends of variation in RSA traits in response to nutrient deficiencies from all experiments represented in Figures 1 to 9. Component score plots for principal component PC1 versus PC2 and PC3 showed that, in particular, the variation represented by PC1 strongly differentiated RSA changes under Ca deficiency from those under Mg or Fe deficiency, while the variation in RSA under P and N deficiency was better resolved along the axis of PC2 (Fig. 10, A and B). The first three principal components explained 72.9% of the observed variation in RSA traits, while the six principal components accounted for 100% of the variation.
Figure 10.

PCA of the modifications in RSA in response to nutrient deficiencies. PCA was based on PR length, average 1° LR length, 1° LR density, average 2° LR length, 2° LR density, and the ratio between BZPR and PR length under the supply of different concentrations of P, N, Ca, K, Mg, S, Fe, Mn, and B. A, PC1 versus PC2. B, PC2 versus PC3. C, Correlation coefficients (r2) obtained for correlations between the variation within individual root traits and the variation within each principal component.
We then performed Pearson correlation analysis of the six principal components with the individual traits to determine to what extent each principal component is loaded by each root trait. This analysis revealed that the two traits 1° LR density and the proportion of BZPR to PR length contributed mainly to PC1, whereas PR length and the average 1° LR length contributed mainly to PC2 (Fig. 10C). By contrast, PC3 predominantly accounted for variations in 2° LR density. Thus, 1° LR density and the length of the BZPR (which represents the extent to which LR emergence events occurred in the PR; Dubrovsky and Forde, 2012) should be most discriminating between the Ca and the Mg or Fe treatments. Indeed, 1° LR densities showed an opposite progression, with deficiency of Ca relative to Mg or Fe (Figs. 3D, 5D, and 7D). By contrast, PC2 better discriminated RSA variations under Ca deficiency from those under N deficiency (Fig. 10A), which were mainly attributed to measures of PR and 1° LR length (Fig. 10C) and in agreement with the diverging progression of these traits with increasing deficiency levels (Figs. 2, C and E, and 3, C and E). Taken together, the transformation of single RSA values into complex principal component values allowed nutrient treatments to be differentiated on the basis of their overall variation in RSA in a more balanced manner than by the direct comparison of individual root traits.
To visualize the plasticity in RSA under a progressing nutrient deficiency, we integrated the variation represented by the six individual principal component scores into one multilevel pie chart. A detailed description of the calculation of these pie charts is given in “Materials and Methods.” Briefly, single portions of the pie chart represent the percentage of the experimental variation explained by each of the principal components. The mean component score of each treatment is graphed on the axis of the pie chart, with the zero point representing the component score of the average of the control treatments (i.e. treatments supplemented with the one-half-strength Murashige and Skoog [1/2 MS] medium concentration of the nutrient in question) from all experiments. The farther a treatment falls from the zero point, the greater the difference between this treatment and the average of the control treatments within each principal component. Since the sign (+/−) of principal component scores is arbitrary, positive as well as negative variations indicate the extent of variation between a treatment and its control (Fig. 11A). Hence, the area enclosed by each treatment across all principal components corresponds to the total RSA plasticity within each of the treatments relative to the control treatments. It was then possible to obtain a single value that integrates the combinatorial information of all RSA changes in a quantitative weighed manner to indicate the total degree of RSA plasticity (Fig. 11). As the deviation of RSA within all treatment series was considered in an equivalent fashion, the extent of root plasticity was ranked in the following order: Ca > P > K > Fe > Mn > Mg > N > B > S, from those with the largest total plasticity observed across all treatments to the deficiencies displaying the least plasticity (Fig. 11, B–J). While it is true that the absolute degree of plasticity is somewhat dependent upon the concentration of the nutrients selected, our graphical representation still allowed the independent consideration of the modulation of RSA traits under intermediate or severe deficiency levels.
Figure 11.

The plasticity of the RSA to nutrient deficiencies. A PCA was undertaken on independent root traits, and the mean component scores for each of the treatments in all six principal components are represented. A, The eigenvalues for each principal component are indicated within each portion of the pie, as is the maximum observable component score for each principal component (represented by the dashed line). The pie chart is divided such that the radial magnitude of each portion is proportional to the experimental variation explained in that principal component (i.e. the eigenvalue). The mean component score for each treatment is graphed along the axis of the chart, with positive scores shaded yellow, negative scores shaded blue, and the zero point representing the mean component score of the 1/2 MS control treatments from all experiments. B to J, Plasticity charts are shown for Ca (B), P (C), K (D), Fe (E), Mn (F), Mg (G), N (H), B (I), and S (J). The area enclosed by each treatment represents the total RSA change relative to the mean of the controls and is expressed as a value adjacent to the legend in each panel in arbitrary units (a.u.2).
DISCUSSION
Changes in Root Plasticity under Nutritional Constraints
The degree of plasticity in response to nutrient availability reveals not only the extent to which underlying developmental processes that control root growth can be altered but also the degree to which environmental factors can be sensed and translated into morphological changes. To quantitatively estimate and graphically depict the extent of root plasticity changes in one view, we have developed a novel visualization tool in the form of a plasticity chart. On the one hand, this tool produces a value that indicates the overall change in plasticity observed in response to each treatment. Such a value represents a combination of both the responsiveness of multivariate root traits and the degree to which each stimulus is sensed and translated into RSA changes, giving a final readout of root plasticity. On the other hand, the plasticity graph also reveals the individual levels of development that are affected in challenging environments, in our case nutrient deficiency, by indicating which developmental processes are most likely to be responding to each treatment. For example, differences in PR length (represented predominantly within PC2 in our plasticity graphs) will mainly refer to differences in PR cell elongation or differentiation of the PR meristem. By contrast, differences in PC1 correlate most with differences in the density of 1° LRs, a trait most likely controlled by the developmental processes of LR initiation and emergence.
Recently, an innovative and rapid approach has been presented to measure RSA by placing user-defined root landmarks on a two-dimensional grid over a scanned root image (Ristova et al., 2013). Although this so-called “RootScape” method waived the separate detection of individual root traits for the sake of high throughput, PCA transformation of root data allowed variations in the spatial configuration of roots to be assigned to specific influential traits. Validating this approach by the analysis of Arabidopsis mutants defective in hormone signaling suggested a particularly large influence of root traits related to PR length on root plasticity, with auxin strongly modifying root size (Ristova et al., 2013). Here, we have followed a similar approach in data transformation, also yielding PCA plots that allowed the effects of nutrient treatments on integrated root traits to be differentiated along PCA components (Fig. 10, A and B) and a deduction of their most influential root traits (Fig. 10C). As our approach utilizes an exact measurement of the independent root traits, it is highly suited to the in-depth characterization of the RSA and the unique developmental changes that evoke the different root responses observed. Indeed, the use of plasticity charts provides a unique opportunity to calculate the total degree of plasticity in response to the deficiency of nutrients. However, such graphs can be more widely applied, particularly when complex traits are characterized by several individual measures taken from large numbers of plants in screening or phenotyping approaches. It is possible to represent the variation for many traits in a relatively small number of data points within the plasticity graph. Plasticity charts can condense the number of data points, particularly in studies involving modern root phenotyping techniques such as those of Ingram et al. (2012), Clark et al. (2011), or Iyer-Pascuzzi et al. (2010) that measured between 16 and 27 root traits in a number of genotypes.
The Effect of Nutrient Availability on Root Length
Our detailed characterization of RSA modifications in Arabidopsis under the limited supply of various nutrients indicated that root elongation was distinctively affected by nutrient supplies. PR length was significantly decreased when plants were grown under low P, Ca, K, Mn, and B (Figs. 1C, 3C, 4C, 8C, and 9C), whereas it was slightly stimulated under intermediate supplies of N and Fe (Figs. 2C and 7C). In the case of S, we observed that even though S concentrations in roots and shoots and the shoot weight were markedly decreased as S supply was decreased (Table II), PR length remained largely unaffected (Fig. 6C). In addition to PR length, LR length was also affected by nutrient deficiencies. Whereas 1° LR length was significantly decreased under P, K, and Mg deficiency, for example (Figs. 1E, 4E, and 5E), 2° LR length was strongly reduced by Mg deficiency (Fig. 5G) and slightly by P deficiency (Fig. 1G). These observations clearly indicate that the availability of different nutrients can distinctively affect the elongation of the PR and LRs and even distinctively within different orders of LRs. Another intriguing observation from this work was the fact that the elongation of PRs and 1° LRs can be uncoupled. This observation was especially obvious in Ca-deficient plants, which had their PRs strongly inhibited, whereas the average length of 1° LRs remained relatively unaffected (Fig. 3, C and E). These observations add new evidence to the yet poorly characterized relationship between the mechanisms that coordinate not only the growth and development of roots of different orders but also their differential interaction with the environment.
The distinct effects of nutrients on PR elongation likely originate from diverse factors. One main factor is related to the different physiological effects that nutrients may have in plants. For instance, the inhibition of PR elongation under low P has been associated with reduced cell elongation and the loss of cell division activity in the PR apical meristem (Sanchez-Calderon et al., 2005; Ticconi et al., 2009). Current studies have suggested that this effect is, at least in part, associated with increased Fe accumulation in root meristems when plants are grown under low P (Hirsch et al., 2006; Ward et al., 2008; Zheng et al., 2009). In agreement with a possible Fe-induced repression of the PR under low P, it has been shown that PR elongation can be restored by lowering the Fe concentrations in the P-deficient medium (Ward et al., 2008; Ticconi et al., 2009). Despite being essential for plant growth and development, an overload of Fe can produce highly reactive hydroxyl radicals that have toxic effects in cells (Graf et al., 1984). As a consequence, excessive Fe accumulation may impair cell division in the root apical meristem, although this assumption has not yet been experimentally demonstrated. In addition, the inverse relationship between root Fe and PR elongation may also help to explain why PR length was significantly increased when intermediate Fe concentrations were supplied to plants (Fig. 7C). However, it is noteworthy that under advanced Fe limitation, root growth is repressed altogether, due to an insufficient coverage of the Fe demand of the plant.
Another factor relates to the fact that some nutrients may directly limit the function of a particular developmental process. In the case of Ca, we observed a remarkable decrease in PR length when low Ca concentrations were supplied to plants (Fig. 3C). Ca is important for cell elongation. In root hairs and pollen tubes, intracellular Ca2+ gradients increase steeply toward the apex (Pierson et al., 1996; Wymer et al., 1997). This tip-focused gradient of Ca2+ aids in the deposition of cell wall components in the cell apex, giving rise to the polarity of cell extension. Thus, the supply of insufficient amounts of Ca to plants may have resulted in impaired cell elongation and, hence, in reduced PR elongation. Interestingly, early studies using 45Ca indicated that Ca is not translocated to root tips (Marschner and Richter, 1974), a defect that is likely associated with the limited mobility of Ca in the phloem (Jeschke and Pate, 1991). Thus, root meristems are highly sensitive to Ca deficiency. In the same study of Marschner and Richter (1974), it was observed that 45Ca could still be translocated into younger LRs of maize (Zea mays) and bean (Phaseolus vulgaris) as long as they still acted as sinks for nutrients. This observation may help to explain the seemingly opposing effect that low Ca availability had on the length of PRs and 1° LRs (Fig. 3, C and E). However, it still remains to be investigated if the LRs actually act as a stronger sink than the PR in Arabidopsis grown on Ca deficiency. Similarly to Ca, the inhibition of PR elongation under low B (Fig. 9C) also relates to decreased cell elongation (Takano et al., 2006), since most B in plants is associated with cell wall pectins (Hu et al., 1996) and B starvation results in cell wall malformations (Brown et al., 2002).
The Effect of Nutrient Availability on LR Formation
In Arabidopsis and most other dicotyledonous plants, the PR can branch repeatedly to produce LRs, which in turn can also undergo higher order branching. In developmental terms, LRs differ from PRs because they originate postembryonically from parental roots (Osmont et al., 2007; Péret et al., 2009). The total number of LRs that is produced depends not only on genetic but also on environmental factors. Importantly, the postembryonic behavior of LRs is an essential component of the root system’s plasticity, since it allows plants to react to fluctuations in external factors, such as nutrient availability. This fact was also reinforced in our study, where a multivariate analysis revealed that 1° LR density (a proxy for the developmental processes of LR initiation and emergence) correlated most with the variation in PC1 and, therefore, made a particularly strong contribution to the total plastic response of roots to different nutrient deficiencies (Fig. 10).
The deficiencies of P, Ca, Mn, and B evoked an increase in 1° LR density (Figs. 1D, 3D, 8D, and 9D), whereas the limitation of Mg and Fe resulted in decreased 1° LR density (Figs. 5D and 7D), although in some cases these responses were only transient. Other nutrients, such as N and K, did not affect 1° LR density (Figs. 2D and 4D). Although the increased 1° LR density was usually associated with short PRs, our results indicate that an inhibition of PR elongation does not always result in an induction of LR formation. Indeed, whereas PR elongation was repressed by K deficiency, 1° LR density remained largely unchanged under these conditions (Fig. 4, C and D), and under Mg deficiency, 1° LR density even decreased with PR repression (Fig. 5, C and D). It is noteworthy that we estimated LR density by dividing the number of emerged LRs by the length of the branching zone (a region that extends from the shoot base to the most root-ward emerged LR), as recently proposed by Dubrovsky and Forde (2012). This method allows a more accurate description of the effects that treatments have on the emergence of LRs. It has been reported previously that the induction of root branching under low P supply occurs before any change in PR elongation is detected (Pérez-Torres et al., 2008). Thus, these results strongly indicate that the processes underlying the induction of root branching can also be uncoupled from the elongation of the parental root.
It is unlikely that nutrients directly control root branching. Instead, it is more plausible that nutrient signals are integrated into developmental programs in order to induce changes in RSA. The formation of LRs is a complex and highly coordinated process that depends on the interplay of hormones, where auxin acts as a central component (Fukaki and Tasaka, 2009; Péret et al., 2009). In fact, nutrient supplies can strongly affect phytohormone gradients, as demonstrated by Fe triggering AUXIN INFLUX CARRIER1 (AUX1)-mediated auxin accumulation in LR tips and subsequent LR elongation (Giehl et al., 2012). Indeed, the deficiency of many nutrients has been reported to affect the levels of one or more hormones in plants (for review, see Rubio et al., 2009). However, for most nutrients, it is not yet known the extent to which and at which developmental steps these hormonal changes impact on RSA. As also shown in this work (Fig. 1D), P deficiency induces the production of LRs (Williamson et al., 2001; López-Bucio et al., 2002, 2003; Sanchez-Calderon et al., 2005). This induction has been shown to be associated with a P deficiency-induced expression of the auxin receptor TRANSPORT INHIBITOR RESPONSE1 (TIR1) in pericycle cells that results in increased sensitivity of roots to auxin (Pérez-Torres et al., 2008). As a consequence, the initiation and emergence of LRs is significantly enhanced in P-deficient roots. Together with such examples, our work reinforces that nutrients induce distinct RSA modifications that may either be coupled or uncoupled, demonstrating further how root plasticity is generated. The challenge now is to identify how the nutrient signals are sensed and integrated into developmental decisions that ultimately shape the RSA according to the nutrients’ availability.
A Detailed Protocol for Obtaining Nutrient-Deficient Solid Medium
We present here a comprehensive characterization of RSA modifications induced by the limitation of different nutrients. Until now, a detailed examination of the effects of nutrient deficiencies on RSA has been fragmented or totally absent. In fact, only P, N, and, very recently, K deficiency-induced modifications of RSA were more exhaustively assessed in Arabidopsis (Linkohr et al., 2002; Sanchez-Calderon et al., 2005; Kellermeier et al., 2013). In other cases, although the effects of nutrient deficiencies on root development have been reported (for review, see López-Bucio et al., 2003; Nibau et al., 2008), these effects were either restricted to root hair formation (e.g. Fe; Schmidt and Schikora, 2001) or extrapolated from studies that did not directly assess RSA modifications (e.g. S; Kutz et al., 2002). One apparent reason for the poor characterization of RSA under nutrient deficiencies relates to difficulties in obtaining consistent deficiency for most nutrients in solid medium. Thus, a study in which RSA is assessed under conditions that are comparable and that produce consistent deficiency is timely and important in order to advance our understanding of how environmental cues shape RSA. In this regard, our study should pave the way for characterizing the RSA modifications in response to nutrients.
We have carefully selected the most appropriate gelling agents to obtain nutrient deficiency in Arabidopsis plants grown on semisolid medium. Agar selection proved to be critical for successfully imposing consistent nutrient deficiency, as mineral analyses revealed that some agars exhibited remarkable differences in nutrient concentrations (Table I). Our study should help researchers who need to characterize phenotypical modifications in response to nutrient deficiencies in genetically diverse plants, for example when comparing mutants with wild-type plants or when assessing natural genetic variability. In this regard, this work provides a valuable reference on which researchers can orient themselves when studying the effect of nutrient deficiencies. In addition, since the characterization of RSA was accompanied by the mineral analyses of shoots and roots from different deficiency levels, this study provides an additional guide to the critical concentrations required to induce phenotypical alterations in Arabidopsis.
In conclusion, based on a careful selection of agar media, this study represents, to our knowledge, the first systematic comparison of RSA responses to multiple nutrient deficiencies. With regard to the almost complete coverage of nutrient treatments, our study provides a comprehensive view of the overall changes in root plasticity induced by the deficiency of single nutrients. Newly developed root plasticity charts help to visualize the influence of each nutrient on the type and extent of changes in root traits and whether individual root traits respond in a coupled or uncoupled fashion. These examples provide a solid basis for the identification of nutrient-responsive processes in the root developmental program and for plant factors determining the differential sensitivity of root tissues to nutritional constraints.
MATERIALS AND METHODS
Plant Growth Conditions
Seeds of Arabidopsis (Arabidopsis thaliana) ecotype Columbia-0 were surface sterilized in 70% (v/v) ethanol and 0.05% (v/v) Triton X-100. Seedlings were first germinated on agar plates containing 0.5% (w/v) Suc and 1% (w/v) agar before seedlings of similar sizes were transferred to treatments containing identical Suc and agar concentrations. The following agar and agarose were used: Applichem (Agarose low EEO, A2114; Applichem), Difco (Difco agar, 214541; Becton Dickinson), Duchefa A (Microagar, M1002; Duchefa Biochemie), Duchefa B (Phytoagar, P1003; Duchefa Biochemie), Roth (Agar-agar, 2266.2; Carl Roth), Serva (Agarose, 11380; Serva), Sigma A (Phytagel, P8169; Sigma-Aldrich), Sigma B (Agar, A7921; Sigma-Aldrich), Sigma C (Fluka agar, 05040; Sigma-Aldrich), and Sigma D (Agarose, A9539; Sigma-Aldrich). The stock solutions for the B experiment were stored in polypropylene flasks, and the growth media were prepared in plastic labware and autoclaved in PTFE flasks (Carl Roth). The nutrient composition of the modified 1/2 MS medium (Murashige and Skoog, 1962) and the germination and treatment periods are indicated in Supplemental Table S3. Five plants were grown on each of the six replicate 12- × 12-cm (or 23- × 23-cm for Zn) vertically oriented plastic plates sealed with Leukopor tape (Smith & Nephew), or in the case of Mg and S experiments, Parafilm M (Pechiney Plastic Packaging) in a randomized block design within a growth cabinet (Percival Scientific) with 22°C day and 19°C night temperatures and a 10-h light period with a light intensity of 120 µmol photons m−2 s−1.
Analysis of RSA
At the end of the treatment period, plates within each block were scanned together using an Epson Expression 10000XL scanner (Seiko Epson) in color at 600 dots per inch resolution and lit from the front. Plants in which growth was inhibited due to damage during transfer were excluded from analyses, taking care not to bias the sample population in the process. Shoots were removed and weighed, and the roots were separated such that roots were clearly distinguishable from one another on the agar, then again scanned in grayscale at 300 dots per inch resolution and lit from the back. Roots were removed from the agar, and the roots and shoots were dried at 65°C. The contrast of the image was adjusted, and marks were removed from the image using Adobe Photoshop CS4 or 5.0 version LE (Adobe Systems), thereby allowing for a better quantification of roots. A total of seven RSA traits were measured using WinRhizo Pro version 2007d or version 2009c (Regent Instruments) for each plant: PR length, 1° LR number, 1° LR length, 2° LR number, 2° LR length, BZPR length, and BZ1°LR length. The remaining root traits were calculated from these measured traits. Total root length was calculated for each plant by summing the PR, 1° LR, and 2° LR lengths. The average 1° LR (or 2° LR) length was calculated by dividing the 1° LR (or 2° LR) length by the number of 1° LRs (or 2° LRs). The density of 1° LRs (or 2° LRs) was calculated by dividing the number of 1° LRs (or 2° LRs) by the length of the BZPR (or BZ1°LR). The shoot and root fresh weight was recorded, and the root-to-shoot ratio was calculated from these weights.
Tests of statistical significance were undertaken using a one-way ANOVA (P < 0.05) with pairwise comparisons made using a Tukey test. An ANOVA on ranks was undertaken for data not normally distributed or not having equal variance followed by a pairwise comparison made using a Tukey test or Dunn’s method. Data in bars or rows that were determined not to be significantly different are denoted by shared lowercase letters in the figures and tables. Correlations were determined using the Pearson product moment correlation. Statistical tests were undertaken using SigmaPlot version 11.0 (Systat Software).
Elemental Analysis
The dried shoots and roots were weighed into PTFE digestion tubes and digested in HNO3 under pressure using a microwave digester (Ultraclave 4; MLS). Elemental analysis was undertaken using inductively coupled plasma optical emission spectroscopy (iCAP 6500 dual OES spectrometer; Thermo Fischer Scientific). Samples (200–300 mg) of the different gelling agents used in this study were dried at 65°C, digested, and measured as for the plant samples. For the N analysis, the plants were freeze dried and ground using a ball mill before 1 mg of material was taken for analysis. The N concentrations were determined using an elemental analyzer (Euro-EA; HEKAtech).
Calculation and Visualization of RSA Plasticity
RSA plasticity was calculated on independent root traits from all treatments except Cl, Cu, and Zn. The Zn experiment was excluded because the age of plants was vastly different from the other experiments, and the Cl and Cu experiments were excluded because the extent of the deficiency phenotype obtained in these experiments was relatively small. The global mean and sd of the 1/2 MS control treatments from across all experiments was calculated for each root trait. Data were then normalized using a sd normalization procedure (Kantardzic, 2002) relative to the 1/2 MS control treatment within each experiment and scaled to the global mean of the 1/2 MS controls from across all experiments. The new normalized values (x) were calculated using the following algorithm:
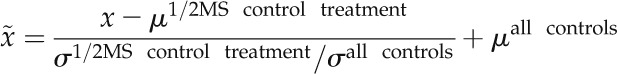 |
where µ1/2MS control treatment and σ1/2MS control treatment are the observed mean and sd of the 1/2 MS control treatment in any given experiment and µall controls and σall controls are the global mean and sd calculated from the 1/2 MS control treatments from across all experiments.
The normalized root traits were subjected to correlation analysis and PCA using the R package ADE-4 (Thioulouse et al., 1997). A PCA canonical graph of the six components of the PCA was prepared, showing how the sum of squared correlations is maximized for the root traits of the data set.
The variation explained within the PCA was expressed as a multilevel pie chart divided into n portions (where n is the number of principal components) with the relative radial size of each portion representing the eigenvalue of each respective principal component. The average component scores of the control treatments from all experiments were set as the center point of the pie chart, and a blank center was included to allow better resolution of values approaching zero.
The mean component score of each treatment was then plotted as the distance along the axis, with positive component scores shaded yellow and negative component scores shaded blue. The mean component scores were plotted on a square root scale to allow the area enclosed by the score in the chart to accurately represent the magnitude of the component score. The total RSA response was determined by calculating the area enclosed by the mean component scores of each treatment across all principal components, resulting in a response value of arbitrary units squared. The greater this value, the greater is the difference between the RSA of the treatment and the RSA of the mean of the controls. This allows the total change in all measured root traits to be represented in a single response value. In the legend of Figure 11, the outer dashed line represents the largest response of the RSA observed for each of the principal components and indicates the largest response obtainable in our experimental system for all of the root traits. The nutrients were then ranked based on the total RSA response value observed across all treatments as an indication of the nutrient deficiency that induces the greatest level of RSA plasticity.
Supplemental Data
The following materials are available in the online version of this article.
Supplemental Figure S1. The effect of Zn deficiency on root morphology.
Supplemental Figure S2. The effect of Cu deficiency on root morphology.
Supplemental Figure S3. The effect of Cl deficiency on root morphology.
Supplemental Table S1. The weight, shoot-to-root ratio, and elemental concentration of shoots and roots of plants grown on varying concentrations of nutrients.
Supplemental Table S2. The weight, shoot-to-root ratio, and elemental concentration of shoots and roots of plants grown on Zn, Cu, and Cl deficiency.
Supplemental Table S3. Description of experimental treatments.
Acknowledgments
We thank Elis Fraust and Lisa Unrath for assistance in the growth and harvest of plants, Susanne Reiner for the elemental analysis, and Barbara Kettig for the N measurements.
Glossary
- RSA
root system architecture
- PR
primary root
- LR
lateral root
- P
phosphorus
- N
nitrogen
- Cu
copper
- K
potassium
- B
boron
- Ca
calcium
- Mg
magnesium
- LR FZPR
lateral root formation zone in the primary root
- 1° LR
first-order lateral root
- 2° LR
second-order lateral root
- S
sulfur
- Mo
molybdenum
- Fe
iron
- Mn
manganese
- Zn
zinc
- Cl
chlorine
- PCA
principal component analysis
- 1/2 MS
one-half-strength Murashige and Skoog
References
- Alhendawi RA, Kirkby EA, Pilbeam DJ. (2005) Evidence that sulfur deficiency enhances molybdenum transport in xylem sap of tomato plants. J Plant Nutr 28: 1347–1353 [Google Scholar]
- Assunção AGL, Herrero E, Lin YF, Huettel B, Talukdar S, Smaczniak C, Immink RGH, van Eldik M, Fiers M, Schat H, et al. (2010) Arabidopsis thaliana transcription factors bZIP19 and bZIP23 regulate the adaptation to zinc deficiency. Proc Natl Acad Sci USA 107: 10296–10301 [DOI] [PMC free article] [PubMed] [Google Scholar]
- Bell PF, Chaney RL, Angle JS. (1991) Determination of the copper2+ activity required by maize using chelator-buffered nutrient solutions. Soil Sci Soc Am J 55: 1366–1374 [Google Scholar]
- Bergmann W 1992. Nutritional Disorders in Plants: Development, Visual and Analytical Diagnosis. Gustav Fisher, Jena, Germany [Google Scholar]
- Brown PH, Bellaloui N, Wimmer MA, Bassil ES, Ruiz J, Hu H, Pfeffer H, Dannel F, Romheld V. (2002) Boron in plant biology. Plant Biol 4: 205–223 [Google Scholar]
- Cailliatte R, Schikora A, Briat JF, Mari S, Curie C. (2010) High-affinity manganese uptake by the metal transporter NRAMP1 is essential for Arabidopsis growth in low manganese conditions. Plant Cell 22: 904–917 [DOI] [PMC free article] [PubMed] [Google Scholar]
- Clark RT, MacCurdy RB, Jung JK, Shaff JE, McCouch SR, Aneshansley DJ, Kochian LV. (2011) Three-dimensional root phenotyping with a novel imaging and software platform. Plant Physiol 156: 455–465 [DOI] [PMC free article] [PubMed] [Google Scholar]
- Dan H, Yang GH, Zheng ZL. (2007) A negative regulatory role for auxin in sulphate deficiency response in Arabidopsis thaliana. Plant Mol Biol 63: 221–235 [DOI] [PMC free article] [PubMed] [Google Scholar]
- Debergh PC. (1983) Effects of agar brand and concentration on the tissue-culture medium. Physiol Plant 59: 270–276 [Google Scholar]
- Dubrovsky JG, Forde BG. (2012) Quantitative analysis of lateral root development: pitfalls and how to avoid them. Plant Cell 24: 4–14 [DOI] [PMC free article] [PubMed] [Google Scholar]
- Forde B, Lorenzo H. (2001) The nutritional control of root development. Plant Soil 232: 51–68 [Google Scholar]
- Fukaki H, Tasaka M. (2009) Hormone interactions during lateral root formation. Plant Mol Biol 69: 437–449 [DOI] [PubMed] [Google Scholar]
- Giehl RF, Lima JE, von Wirén N. (2012) Localized iron supply triggers lateral root elongation in Arabidopsis by altering the AUX1-mediated auxin distribution. Plant Cell 24: 33–49 [DOI] [PMC free article] [PubMed] [Google Scholar]
- Graf E, Mahoney JR, Bryant RG, Eaton JW. (1984) Iron-catalyzed hydroxyl radical formation: stringent requirement for free iron coordination site. J Biol Chem 259: 3620–3624 [PubMed] [Google Scholar]
- Hermans C, Hammond JP, White PJ, Verbruggen N. (2006) How do plants respond to nutrient shortage by biomass allocation? Trends Plant Sci 11: 610–617 [DOI] [PubMed] [Google Scholar]
- Hermans C, Verbruggen N. (2005) Physiological characterization of Mg deficiency in Arabidopsis thaliana. J Exp Bot 56: 2153–2161 [DOI] [PubMed] [Google Scholar]
- Hirsch J, Marin E, Floriani M, Chiarenza S, Richaud P, Nussaume L, Thibaud MC. (2006) Phosphate deficiency promotes modification of iron distribution in Arabidopsis plants. Biochimie 88: 1767–1771 [DOI] [PubMed] [Google Scholar]
- Hochholdinger F, Tuberosa R. (2009) Genetic and genomic dissection of maize root development and architecture. Curr Opin Plant Biol 12: 172–177 [DOI] [PubMed] [Google Scholar]
- Hu HN, Brown PH, Labavitch JM. (1996) Species variability in boron requirement is correlated with cell wall pectin. J Exp Bot 47: 227–232 [Google Scholar]
- Ingram PA, Zhu J, Shariff A, Davis IW, Benfey PN, Elich T. (2012) High-throughput imaging and analysis of root system architecture in Brachypodium distachyon under differential nutrient availability. Philos Trans R Soc Lond B Biol Sci 367: 1559–1569 [DOI] [PMC free article] [PubMed] [Google Scholar]
- Iyer-Pascuzzi AS, Symonova O, Mileyko Y, Hao YL, Belcher H, Harer J, Weitz JS, Benfey PN. (2010) Imaging and analysis platform for automatic phenotyping and trait ranking of plant root systems. Plant Physiol 152: 1148–1157 [DOI] [PMC free article] [PubMed] [Google Scholar]
- Jain A, Poling MD, Smith AP, Nagarajan VK, Lahner B, Meagher RB, Raghothama KG. (2009) Variations in the composition of gelling agents affect morphophysiological and molecular responses to deficiencies of phosphate and other nutrients. Plant Physiol 150: 1033–1049 [DOI] [PMC free article] [PubMed] [Google Scholar]
- Jeschke WD, Pate JS. (1991) Cation and chloride partitioning through xylem and phloem within the whole plant of Ricinus communis L under conditions of salt stress. J Exp Bot 42: 1105–1116 [Google Scholar]
- Jung JY, Shin R, Schachtman DP. (2009) Ethylene mediates response and tolerance to potassium deprivation in Arabidopsis. Plant Cell 21: 607–621 [DOI] [PMC free article] [PubMed] [Google Scholar]
- Kantardzic M. (2002) Data Mining: Concepts, Models, Methods, and Algorithms. IEEE Press and John Wiley, Hoboken, NJ [Google Scholar]
- Kellermeier F, Chardon F, Amtmann A. (2013) Natural variation of Arabidopsis root architecture reveals complementing adaptive strategies to potassium starvation. Plant Physiol 161: 1421–1432 [DOI] [PMC free article] [PubMed] [Google Scholar]
- Kirkegaard JA, Lilley JM, Howe GN, Graham JM. (2007) Impact of subsoil water use on wheat yield. Aust J Agric Res 58: 303–315 [Google Scholar]
- Krouk G, Lacombe B, Bielach A, Perrine-Walker F, Malinska K, Mounier E, Hoyerova K, Tillard P, Leon S, Ljung K, et al. (2010) Nitrate-regulated auxin transport by NRT1.1 defines a mechanism for nutrient sensing in plants. Dev Cell 18: 927–937 [DOI] [PubMed] [Google Scholar]
- Kutz A, Müller A, Hennig P, Kaiser WM, Piotrowski M, Weiler EW. (2002) A role for nitrilase 3 in the regulation of root morphology in sulphur-starving Arabidopsis thaliana. Plant J 30: 95–106 [DOI] [PubMed] [Google Scholar]
- Landi P, Sanguineti MC, Darrah LL, Giuliani MM, Salvi S, Conti S, Tuberosa R. (2002) Detection of QTLs for vertical root pulling resistance in maize and overlap with QTLs for root traits in hydroponics and for grain yield under different water regimes. Maydica 47: 233–243 [Google Scholar]
- Lima JE, Kojima S, Takahashi H, von Wirén N. (2010) Ammonium triggers lateral root branching in Arabidopsis in an AMMONIUM TRANSPORTER1;3-dependent manner. Plant Cell 22: 3621–3633 [DOI] [PMC free article] [PubMed] [Google Scholar]
- Linkohr BI, Williamson LC, Fitter AH, Leyser HMO. (2002) Nitrate and phosphate availability and distribution have different effects on root system architecture of Arabidopsis. Plant J 29: 751–760 [DOI] [PubMed] [Google Scholar]
- López-Bucio J, Cruz-Ramírez A, Herrera-Estrella L. (2003) The role of nutrient availability in regulating root architecture. Curr Opin Plant Biol 6: 280–287 [DOI] [PubMed] [Google Scholar]
- López-Bucio J, Hernández-Abreu E, Sánchez-Calderón L, Nieto-Jacobo MF, Simpson J, Herrera-Estrella L. (2002) Phosphate availability alters architecture and causes changes in hormone sensitivity in the Arabidopsis root system. Plant Physiol 129: 244–256 [DOI] [PMC free article] [PubMed] [Google Scholar]
- Lynch J. (1995) Root architecture and plant productivity. Plant Physiol 109: 7–13 [DOI] [PMC free article] [PubMed] [Google Scholar]
- Lynch JP, Brown KM. (2001) Topsoil foraging: an architectural adaptation of plants to low phosphorus availability. Plant Soil 237: 225–237 [Google Scholar]
- Malamy JE. (2005) Intrinsic and environmental response pathways that regulate root system architecture. Plant Cell Environ 28: 67–77 [DOI] [PubMed] [Google Scholar]
- Manschadi AM, Christopher J, de Voil P, Hammer GL. (2006) The role of root architectural traits in adaptation of wheat to water-limited environments. Funct Plant Biol 33: 823–837 [DOI] [PubMed] [Google Scholar]
- Marschner H, Richter C. (1974) Calcium-transport in roots of maize and bean seedlings. Plant Soil 40: 193–210 [Google Scholar]
- Marschner P (2012) Marschner’s Mineral Nutrition of Higher Plants. Academic Press, San Diego [Google Scholar]
- Mills RF, Doherty ML, López-Marqués RL, Weimar T, Dupree P, Palmgren MG, Pittman JK, Williams LE. (2008) ECA3, a Golgi-localized P2A-type ATPase, plays a crucial role in manganese nutrition in Arabidopsis. Plant Physiol 146: 116–128 [DOI] [PMC free article] [PubMed] [Google Scholar]
- Misson J, Raghothama KG, Jain A, Jouhet J, Block MA, Bligny R, Ortet P, Creff A, Somerville S, Rolland N, et al. (2005) A genome-wide transcriptional analysis using Arabidopsis thaliana Affymetrix gene chips determined plant responses to phosphate deprivation. Proc Natl Acad Sci USA 102: 11934–11939 [DOI] [PMC free article] [PubMed] [Google Scholar]
- Murashige T, Skoog F. (1962) A revised medium for rapid growth and bioassays with tobacco tissue cultures. Physiol Plant 15: 473–497 [Google Scholar]
- Nibau C, Gibbs DJ, Coates JC. (2008) Branching out in new directions: the control of root architecture by lateral root formation. New Phytol 179: 595–614 [DOI] [PubMed] [Google Scholar]
- Osmont KS, Sibout R, Hardtke CS. (2007) Hidden branches: developments in root system architecture. Annu Rev Plant Biol 58: 93–113 [DOI] [PubMed] [Google Scholar]
- Pacheco-Villalobos D, Hardtke CS. (2012) Natural genetic variation of root system architecture from Arabidopsis to Brachypodium: towards adaptive value. Philos Trans R Soc Lond B Biol Sci 367: 1552–1558 [DOI] [PMC free article] [PubMed] [Google Scholar]
- Péret B, De Rybel B, Casimiro I, Benková E, Swarup R, Laplaze L, Beeckman T, Bennett MJ. (2009) Arabidopsis lateral root development: an emerging story. Trends Plant Sci 14: 399–408 [DOI] [PubMed] [Google Scholar]
- Pérez-Torres CA, López-Bucio J, Cruz-Ramírez A, Ibarra-Laclette E, Dharmasiri S, Estelle M, Herrera-Estrella L. (2008) Phosphate availability alters lateral root development in Arabidopsis by modulating auxin sensitivity via a mechanism involving the TIR1 auxin receptor. Plant Cell 20: 3258–3272 [DOI] [PMC free article] [PubMed] [Google Scholar]
- Pierson ES, Miller DD, Callaham DA, van Aken J, Hackett G, Hepler PK. (1996) Tip-localized calcium entry fluctuates during pollen tube growth. Dev Biol 174: 160–173 [DOI] [PubMed] [Google Scholar]
- Remans T, Nacry P, Pervent M, Filleur S, Diatloff E, Mounier E, Tillard P, Forde BG, Gojon A. (2006) The Arabidopsis NRT1.1 transporter participates in the signaling pathway triggering root colonization of nitrate-rich patches. Proc Natl Acad Sci USA 103: 19206–19211 [DOI] [PMC free article] [PubMed] [Google Scholar]
- Rengel Z. (1999) Zinc deficiency in wheat genotypes grown in conventional and chelator-buffered nutrient solutions. Plant Sci 143: 221–230 [Google Scholar]
- Richard-Molard C, Krapp A, Brun F, Ney B, Daniel-Vedele F, Chaillou S. (2008) Plant response to nitrate starvation is determined by N storage capacity matched by nitrate uptake capacity in two Arabidopsis genotypes. J Exp Bot 59: 779–791 [DOI] [PubMed] [Google Scholar]
- Ristova D, Rosas U, Krouk G, Ruffel S, Birnbaum KD, Coruzzi GM. (2013) RootScape: a landmark-based system for rapid screening of root architecture in Arabidopsis. Plant Physiol 161: 1086–1096 [DOI] [PMC free article] [PubMed] [Google Scholar]
- Rubio G, Liao H, Yan XL, Lynch JP. (2003) Topsoil foraging and its role in plant competitiveness for phosphorus in common bean. Crop Sci 43: 598–607 [Google Scholar]
- Rubio V, Bustos R, Irigoyen ML, Cardona-López X, Rojas-Triana M, Paz-Ares J. (2009) Plant hormones and nutrient signaling. Plant Mol Biol 69: 361–373 [DOI] [PubMed] [Google Scholar]
- Sánchez-Calderón L, López-Bucio J, Chacón-López A, Cruz-Ramírez A, Nieto-Jacobo F, Dubrovsky JG, Herrera-Estrella L. (2005) Phosphate starvation induces a determinate developmental program in the roots of Arabidopsis thaliana. Plant Cell Physiol 46: 174–184 [DOI] [PubMed] [Google Scholar]
- Schmidt W, Schikora A. (2001) Different pathways are involved in phosphate and iron stress-induced alterations of root epidermal cell development. Plant Physiol 125: 2078–2084 [DOI] [PMC free article] [PubMed] [Google Scholar]
- Scholten HJ, Pierik RLM. (1998) Agar as a gelling agent: chemical and physical analysis. Plant Cell Rep 17: 230–235 [DOI] [PubMed] [Google Scholar]
- Steele KA, Virk DS, Kumar R, Prasad SC, Witcombe JR. (2007) Field evaluation of upland rice lines selected for QTLs controlling root traits. Field Crops Res 101: 180–186 [Google Scholar]
- Takano J, Wada M, Ludewig U, Schaaf G, von Wirén N, Fujiwara T. (2006) The Arabidopsis major intrinsic protein NIP5;1 is essential for efficient boron uptake and plant development under boron limitation. Plant Cell 18: 1498–1509 [DOI] [PMC free article] [PubMed] [Google Scholar]
- Thioulouse J, Chessel D, Doledec S, Olivier JM. (1997) ADE-4: a multivariate analysis and graphical display software. Stat Comput 7: 75–83 [Google Scholar]
- Ticconi CA, Lucero RD, Sakhonwasee S, Adamson AW, Creff A, Nussaume L, Desnos T, Abel S. (2009) ER-resident proteins PDR2 and LPR1 mediate the developmental response of root meristems to phosphate availability. Proc Natl Acad Sci USA 106: 14174–14179 [DOI] [PMC free article] [PubMed] [Google Scholar]
- Tomatsu H, Takano J, Takahashi H, Watanabe-Takahashi A, Shibagaki N, Fujiwara T. (2007) An Arabidopsis thaliana high-affinity molybdate transporter required for efficient uptake of molybdate from soil. Proc Natl Acad Sci USA 104: 18807–18812 [DOI] [PMC free article] [PubMed] [Google Scholar]
- Tuberosa R, Sanguineti MC, Landi P, Giuliani MM, Salvi S, Conti S. (2002) Identification of QTLs for root characteristics in maize grown in hydroponics and analysis of their overlap with QTLs for grain yield in the field at two water regimes. Plant Mol Biol 48: 697–712 [DOI] [PubMed] [Google Scholar]
- Vert G, Grotz N, Dédaldéchamp F, Gaymard F, Guerinot ML, Briat JF, Curie C. (2002) IRT1, an Arabidopsis transporter essential for iron uptake from the soil and for plant growth. Plant Cell 14: 1223–1233 [DOI] [PMC free article] [PubMed] [Google Scholar]
- Ward JT, Lahner B, Yakubova E, Salt DE, Raghothama KG. (2008) The effect of iron on the primary root elongation of Arabidopsis during phosphate deficiency. Plant Physiol 147: 1181–1191 [DOI] [PMC free article] [PubMed] [Google Scholar]
- Williamson LC, Ribrioux SPCP, Fitter AH, Leyser HMO. (2001) Phosphate availability regulates root system architecture in Arabidopsis. Plant Physiol 126: 875–882 [DOI] [PMC free article] [PubMed] [Google Scholar]
- Wymer CL, Bibikova TN, Gilroy S. (1997) Cytoplasmic free calcium distributions during the development of root hairs of Arabidopsis thaliana. Plant J 12: 427–439 [DOI] [PubMed] [Google Scholar]
- Yang X, Römheld V, Marschner H, Chaney RL. (1994) Application of chelator-buffered nutrient solution technique in studies on zinc nutrition in rice plant (Oryza sativa L). Plant Soil 163: 85–94 [Google Scholar]
- Zhang HM, Forde BG. (1998) An Arabidopsis MADS box gene that controls nutrient-induced changes in root architecture. Science 279: 407–409 [DOI] [PubMed] [Google Scholar]
- Zheng LQ, Huang FL, Narsai R, Wu JJ, Giraud E, He F, Cheng LJ, Wang F, Wu P, Whelan J, et al. (2009) Physiological and transcriptome analysis of iron and phosphorus interaction in rice seedlings. Plant Physiol 151: 262–274 [DOI] [PMC free article] [PubMed] [Google Scholar]
- Zhu JM, Kaeppler SM, Lynch JP. (2005) Topsoil foraging and phosphorus acquisition efficiency in maize (Zea mays). Funct Plant Biol 32: 749–762 [DOI] [PubMed] [Google Scholar]