

Abstract
Almost all of the processing that occurs in the various lower auditory nuclei converges upon a common target in the central nucleus of the inferior colliculus (ICc) thus making the ICc the nexus of the auditory system. A variety of new response properties are formed in the ICc through the interactions among the excitatory and inhibitory inputs that converge upon it. Here we review studies that illustrate the dominant role inhibition plays in the ICc. We begin by reviewing studies of tuning curves and show how inhibition shapes the variety of tuning curves in the ICc through sideband inhibition. We then show how inhibition shapes selective response properties for complex signals, focusing on selectivity for the sweep direction of frequency modulations (FM). In the final section we consider results from in vivo whole-cell recordings that show how parameters of the incoming excitation and inhibition interact to shape directional selectivity. We show that post-synaptic potentials (PSPs) evoked by different signals can be similar but evoke markedly different spike-counts. In these cases, spike threshold acts as a non-linear amplifier that converts small differences in PSPs into large differences in spike output. Such differences between the inputs to a cell compared to the outputs from the same cell suggest that highly selective discharge properties can be created by only minor adjustments in the synaptic strengths evoked by one or both signals. These findings also suggest that plasticity of response features may be achieved with far less modifications in circuitry than previously supposed.
1. Introduction
The inferior colliculus occupies a strategic position in the ascending auditory system. Almost all of the processing that occurs in the various lower auditory nuclei converges upon a common target in the central nucleus of the inferior colliculus (ICc) thus making the ICc the nexus of the auditory system (Casseday et al., 2002; Oliver and Huerta, 1992; Pollak and Casseday, 1986). The inputs to the ICc arise from a number of monaural lower nuclei that receive innervation from only one ear and from several binaural lower nuclei whose response properties are influenced by stimuli presented to both ears. The axonal projections from some of those nuclei, such as the dorsal cochlear nucleus (Davis, 2002; Malmierca et al., 2005b; Semple and Aitkin, 1980) and medial superior olive are purely excitatory (Davis, 2002; Glendenning et al.,1992; Semple and Aitkin, 1980). However the innervation from others, the dorsal nucleus of the lateral lemniscus (DNLL) and the columnar division of the ventral nucleus of the lateral lemniscus (VNLLc) are either purely inhibitory or, as in the case of the lateral superior olive (LSO) and intermediate nucleus of the lateral lemniscus (INLL), are a mixture of excitatory and inhibitory projections (Adams and Mugnaini, 1984; Bajo et al., 1999; Glendenning et al., 1992; Malmierca et al., 1998; Riquelme et al., 2001; Vater et al., 1997; Winer et al., 1995). It is also noteworthy that some of the inhibitory projections are glycinergic while others are GABAergic, where the number of inhibitory projections is at least as large, if not larger, than the excitatory projections (Winer et al., 1995).
The net result of these convergences is that a variety of new response properties are either formed de novo in the ICc or response properties that have been formed in lower nuclei are sharpened or further modified in the ICc. The constructions of new response properties or modifications of properties constructed below are due to the interactions among the excitatory and inhibitory inputs to the ICc. The role of inhibition is difficult to overemphasize, as the selective features in the vast majority of ICc cells are either reduced or completely eliminated when inhibition is blocked by the iontophoretic application of receptor blockers (Casseday et al., 2000; Davis et al., 2003; Faingold et al., 1991; Nataraj and Wenstrup, 2005; Palombi and Caspary, 1996; Park and Pollak, 1993b; Sanchez et al., 2007, 2008) or when the inhibitory innervation from a lower source is reversibly inactivated (Burger and Pollak, 2001; Faingold et al., 1993; Malmierca et al., 2005a, 2003).
Here we review studies that illustrate the dominant role inhibition plays in the ICc. We begin by reviewing studies of tuning curves and show how inhibition shapes the variety of tuning curves in the ICc through sideband inhibition. We then show that inhibition shapes selective response properties for complex signals, and in the final section we consider how parameters of the incoming excitation and inhibition interact to shape discharge selectivity in the ICc.
The response feature that we focus on is selectivity for sweep direction of frequency modulations (FM), and how inhibition sculpts that selectivity. We focus on directional selectivity since FMs are a universal component of animal communication signals (Bohn et al., 2008, 2009; Doupe and Kuhl, 1999; Holy and Guo, 2005; Portfors et al., 2009; Ryan, 1983; Wang et al., 1995), including human speech, and preferences for FM sweep direction are a selective feature commonly seen in the mammalian auditory system (Fuzessery, 1994; Nelken and Versnel, 2000; Poon et al., 1991; Razak and Fuzessery, 2006; Zhang et al., 2003). Additionally, directional preferences for FM are an emergent property of the ICc and have been the subject of numerous studies that have provided insights into the mechanisms underlying its generation (Andoni et al., 2007; Felsheim and Ostwald, 1996; Fuzessery and Hall, 1996; Gaese et al., 2006; Gittelman et al., 2009; Poon and Chiu, 2000; Poon et al., 1991; Suga, 1968).
There are two principal mechanisms that have been proposed in previous studies to explain response preferences in the ICc for FM direction, as illustrated in Fig. 1. Both incorporate differences between the timing of inputs evoked by the preferred and null FMs (Brimijoin and O'Neill, 2005; Casseday et al., 2002; Covey and Casseday, 1999; Fuzessery, 1994; Poon et al., 1991; Suga, 1968; Suga, 1973; Suga and Schlegel, 1973; Yue et al., 2007). Further, both assume that the excitatory and inhibitory inputs to the IC are non-directional, and thus the preferred and null FMs evoke equally strong excitations and that both FMs evoke equally strong inhibitions. One hypothesis posits a timing asymmetry between excitation and inhibition, where the preferred FM activates excitation first, whereas the null FM activates inhibition first. When excitation arrives first, it is initially unopposed by inhibition and thus evokes discharges. When inhibition arrives first or is coincident with the excitation, the inhibition acts to reduce or even completely cancel the excitation thereby suppressing discharges. The second hypothesis posits that directionality is generated by the relative coincidence in the arrival of excitatory (or inhibitory) inputs. More coincident excitatory arrivals generate a higher amplitude EPSP, whereas less coincident arrivals generate a longer response of lower amplitude. Thus, compared to the null, the preferred FM would evoke more coincident excitatory inputs, and/or less coincident inhibitory inputs. The two hypotheses outlined above are not mutually exclusive. There is however, considerable evidence to support the hypothesis of timing asymmetries of excitation and inhibition (Andoni et al., 2007; Fuzessery and Hall, 1996; Fuzessery et al., 2006; Koch and Grothe, 1998), whereas the second, coincidence model, is based either on a theoretical possibility or on Rall's model of synaptic integration along dendrites (Rall, 1969), in a manner similar to the proposal for FM directionality in octopus cells in the cochlear nucleus (Golding et al., 1995).
Fig. 1.

Schematic illustration of the two major hypotheses for FM directional selectivity. A: asymmetric timing of excitation and inhibition. A downward sweeping FM in this case stimulates the cell's excitatory frequencies first and then stimulates inhibitory region on the low frequency flank of the excitatory region. Excitation (red EPSPs) is evoked first, and since excitation occurs before inhibition (blue IPSP), the excitation evokes a suprathreshold EPSP that generates spikes. An upward sweeping FM first enters the inhibitory region (blue) and evokes inhibition that suppresses the following excitation, resulting in a subthreshold PSP. B: Coincidence hypothesis that proposes that the frequencies in an FM sweeping in one direction, downward in this case, evokes a series of excitatory inputs that arrive at the target cell coincidentally. The summation of the inputs that arrive simultaneously evoke a suprathreshold EPSP. In contrast, an FM sweeping in the opposite direction, upward in this case, evokes a series of excitatory inputs with different latencies. The inputs arrive at the target cell at successive times. The summation of the staggered inputs generates a PSP of longer duration but lower amplitude than the downward FM.
Although FM directionality has been studied in a variety of mammals, the majority of studies have been conducted on bats. Bats are hearing specialists and have well developed neural circuits that underlie their acoustic behaviors (Pollak and Casseday, 1986). Their auditory systems, however, are not unique. Indeed, their brainstem auditory systems have the same nuclei, cell types, connections and the same mechanisms for processing information that are possessed by all other mammals (Feng and Vater, 1985; Pecka et al., 2007; Pollak and Casseday, 1986; Pollak et al., 1995; Winer et al., 1995). What distinguishes the auditory systems of bats are not novel mechanisms, but rather that some common structural and mechanistic features are more pronounced in their auditory systems than in other mammals. One pronounced response feature is the high proportion of FM directional cells in their ICc (Andoni et al., 2007; Brimijoin and O'Neill, 2005; Fuzessery and Hall, 1996; Gordon and O'Neill, 1998; Razak and Fuzessery, 2009; Yue et al., 2007) and cortex (O'Neill and Suga, 1982; Razak and Fuzessery, 2008, 2009; Suga, 1965; Suga et al., 1983), a feature clearly related to the extensive use of FMs in their echolocation calls and in the rich repertoire of songs and calls they emit for social communication (Bohn et al., 2008, 2009; Kanwal et al., 1994). Thus, we consider the results from studies of bats generically, in that the features and mechanisms for directional selectivity seen in the ICc of bats may be more prevalent in bats than other mammals, but occur universally in the mammalian auditory system.
2. Sideband inhibition shapes the tuning curves of IC neurons
The dominance of inhibition is well illustrated by sideband inhibition and its influences on the response selectivities of ICc neurons. Tuning curves reveal the frequencies that evoke suprathreshold excitation and in most, although not all, ICc neurons there is also excitation evoked by frequencies that flank the high frequency side of the tuning curve, the low side, or both sides. The flanking excitation, however, is rendered subthreshold by sideband inhibition that is evoked by the same frequencies that evoke excitation. When inhibition is blocked by iontophoretic application of bicuculline and strychnine the excitation that flanks the tuning curve is freed from its inhibitory brake and evokes discharges, thereby causing the tuning curve to expand (LeBeau et al., 2001; Palombi and Caspary, 1996; Xie et al., 2005; Yang et al., 1992).
The sideband excitation that is normally suppressed by inhibition is seen in the various types of tuning curves among the ICc population in bats and other mammals. ICc cells that have V shaped tuning curves, as one example, often display a substantial expansion in their tuning curves when inhibition is blocked (LeBeau et al., 2001; Xie et al., 2005; Yang et al., 1992), as shown in Fig. 2B–D. Even more substantial changes occur in some cells that have tuning curves characterized by an island of excitation bounded by both upper and lower thresholds (Fig. 2E). When inhibition is blocked in many of these cells, the upper threshold feature is eliminated, the range of frequencies that evoke discharges expands and the tuning curves are transformed into a V shaped tuning curve. Finally, the most dramatic changes are seen in null tuned ICc cells that are unresponsive to tones, and thus have no evocable excitatory tuning curves. Blocking inhibition in those cells, however, converts an unresponsive cell into a one with V shaped tuning (Fig. 2F).
Fig. 2.
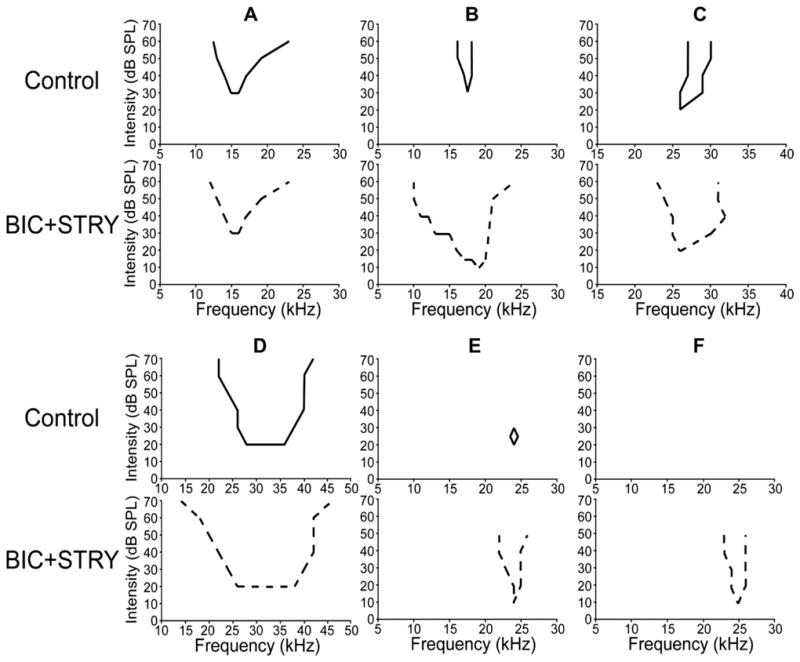
Tuning curves from 6 ICc neurons before and while inhibition was blocked by bicuculline and strychnine. Source: Xie et al. (2005).
3. In vivo whole-cell recordings reveal the full extent of sideband inhibition in ICc cells
The tuning curve expansions seen with extracellular recordings only reveal the sideband inhibition that suppresses sideband excitation. The experiments that blocked inhibition could not reveal any pure sideband inhibition that may have extended beyond the tuning curve after inhibition was blocked because there would be no underlying excitation that would be unmasked by blocking inhibition, and thus the inhibition would be invisible with extracellular recordings.
In a more recent study of the ICc in bats (Xie et al., 2007, 2008), the inhibition evoked by frequencies that flank excitatory tuning curves was directly visualized with in vivo whole-cell recordings. The bandwidths of discharge tuning while inhibition was blocked in the ICc of Mexican free-tailed bats were compared to the bandwidths of synaptic tuning recorded from ICc neurons in the same species. To compare the bandwidths of discharge and synaptic tuning, the range of frequencies that evoked discharges at 50 dB SPL while inhibition was blocked in extracellular recordings was measured and those bandwidths were compared to the range of frequencies that evoked synaptic responses, EPSPs and/or IPSPs, recorded with patch electrodes at 50 dB SPL in other ICc neurons (Fig. 3). With extracellular recordings the average bandwidth that evoked discharges at 50 dB SPL was 7.1 ± 5.4 kHz while inhibition was blocked. In contrast, the average bandwidth of synaptic responses at 50 dB obtained with whole-cell recordings was 17.6 ± 6.6 kHz in cells with similar best frequencies. The synaptic tuning was, on average, 10.5 kHz wider, and more than double the average bandwidth, of the discharge-tuned regions measured while inhibition was blocked. Thus, the synaptic tuning in the majority of ICc cells is not accurately reflected in the expanded discharge tuning upon blocking inhibition since most ICc cells receive inhibitory innervation with a far broader spectral range than the excitatory innervation they receive.
Fig. 3.
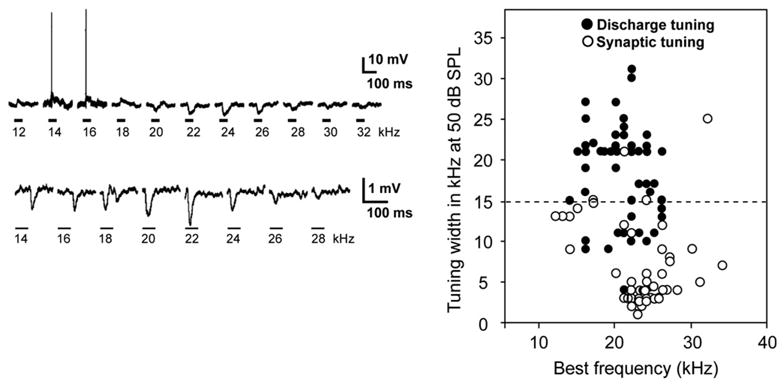
Left panel: Tone-evoked responses from 2 ICc neurons recorded with patch electrodes. The response profile in the top panel was excitation with discharges at 14–16 kHz with an inhibitory region on the high frequency flank of the excitatory frequencies. The tone-evoked profile in the lower panel was dominated by inhibition where all frequencies evoked synaptic responses dominated by IPSPs. Tones were 50 dB SPL in top panel and 60 dB SPL in lower panel. Adapted from Xie et al., 2008. Right panel: Distributions of widths of discharge tuning from ICc cells recorded with extracellular electrodes and synaptic tuning recorded from ICc cells with patch electrodes. Discharge tuning is widths of tuning curves at 50 dB SPL while inhibition was blocked. Synaptic tuning is widths of tuned regions at 50 dB SPL. Notice that the distribution of the best frequencies of the two samples was similar. Average discharge tuning width was 7.1 ± 5.4 kHz. Average synaptic tuning was 17.6 ± 6.0 kHz. Source: Xie et al. (2007).
4. Inhibition shapes response selectivities to complex signals in the ICc
Most ICc neurons express response selectivities for complex signals and those selectivities are largely shaped by inhibition (Andoni et al., 2007; Casseday et al., 2000; Davis et al., 2003; Faingold et al., 1993; Klug et al., 2002; Li and Kelly, 1992; Nataraj and Wenstrup, 2005; Xie et al., 2005). The profound influences of inhibition in the ICc are well illustrated by comparing the selectivities of neurons in the dorsal nucleus of the lateral lemniscus (DNLL) (Bauer et al., 2002) with ICc neurons (Klug et al., 2002) in Mexican free-tailed bats. Responses in both nuclei were evoked by a suite of ten communication and echolocation calls, where each call had a different and unique spectrotemporal structure (Fig. 4). Each signal was broadband, had multiple harmonics and each was presented at an intensity that was at least 20 dB above the neuron's threshold at its best frequency. Selectivity was assessed by the number of calls that evoked discharges in each neuron.
Fig. 4.
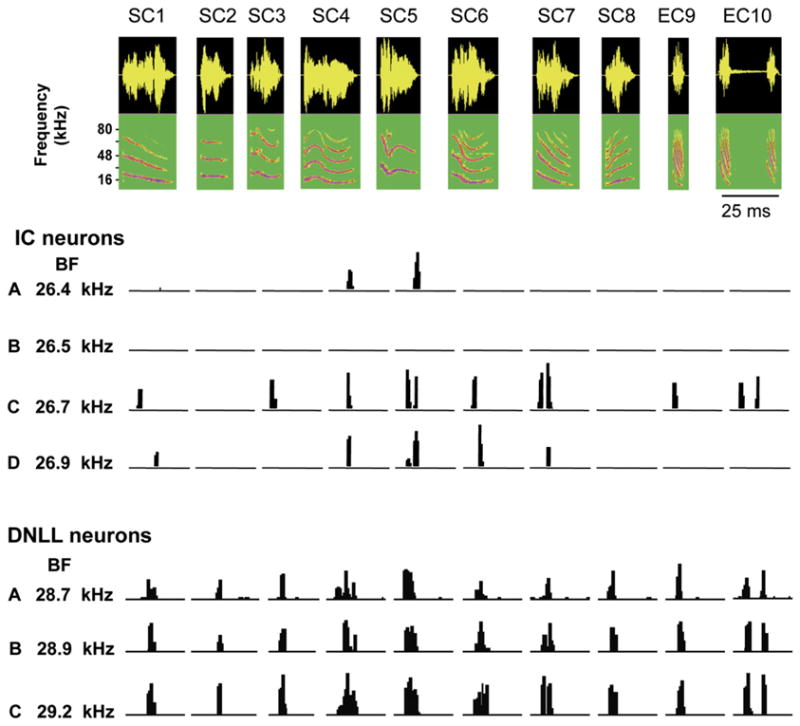
Responses of 4 ICc neurons and 3 DNLL neurons to 10 species-specific calls. Eight of the calls (SC–SC8) are social communication calls and two others (EC9–EC10) are echolocation calls. The 4 ICc cells are isofrequency and all tuned to about 26 kHz and the 3 DNLL cells are all tuned close to 29 kHz. The ICc cells were selective in that each fired to only a subset of the 10 calls although each of the calls had suprathreshold energy that swept through each neuron's excitatory tuning curve. The selectivity was also heterogeneous in that each cell fired to a particular subset of calls that was different from the subset to which the other cells fired. One cell failed to fire to any of the calls. The DNLL cells, in contrast, were unselective and fired to all 10 calls because each of the calls had energy that encroached upon their excitatory tuning curves. Source: Klug et al. (2002), and Bauer et al., 2002.
DNLL neurons have no inhibitory sidebands and blocking inhibition causes no expansion of their tuning curves nor does it change their responsiveness to the suite of calls (Xie et al., 2005). They respond to any signal, regardless of signal complexity, so long as the signal has suprathreshold energy that encroaches upon its excitatory tuning curve. DNLL neurons are therefore unselective. Indeed, the responses of DNLL neurons can be explained entirely by the degree to which the spectral content of a signal sweeps through the neuron's excitatory tuning curve. Consequently, convolving any signal with the cell's excitatory tuned region yields a remarkably high degree of agreement between the responses predicted by the convolutions and the actual response evoked by those signals (Bauer et al., 2002). Since the tuning curves among DNLL neurons are relatively homogeneous, DNLL neurons with the same best frequency respond to a given signal in the same way, as shown for three isofrequency DNLL neurons in Fig. 4.
In marked contrast, most isofrequency ICc cells are selective, in that each cell responds to only some of the calls and fails to respond to others, although all of the calls have suprathreshold energy that encroaches upon each neuron's excitatory tuning curve (Klug et al., 2002; Xie et al., 2005) (Fig. 4). ICc cells are not only selective, but their selectivities are diverse, in that the particular subset of calls that evoke discharges varies from neuron to neuron, even though the neurons are all tuned to the same frequency and all the signals have suprathreshold energy that stimulate their excitatory tuning curves.
The selectivities of ICc neurons are shaped by inhibition (Holmstrom et al., 2007; Klug et al., 2002; Portfors and Felix, 2005; Suta et al., 2003; Xie et al., 2005). Studies on Mexican free-tailed bats showed that when inhibition is blocked by the application of bicuculline and strychnine, selectivity for calls is reduced or completely eliminated, thereby allowing ICc cells to respond to most or all of the calls to which they were unresponsive when inhibition was intact (Klug et al., 2002; Xie et al., 2005). The profound impact of inhibition on the coding of communication calls is illustrated in Fig.5, which shows the responses of 9 neurons to two different calls, SC4 and SC6, that have similar spectrotemporal features. In Fig. 5, each of the 9 neurons had a different best frequency that ranged from 19.4 to 36.3 kHz. The figure illustrates two significant features. The first is that due to the diversity of their response selectivities, only three of the 9 neurons responded to call SC4 and four different neurons responded to call SC6. Thus, each call recruits a different subpopulation of neurons among the ICc population. The second is that the selectivity is eliminated when inhibition is blocked, allowing all 9 neurons to respond to both calls.
Fig. 5.
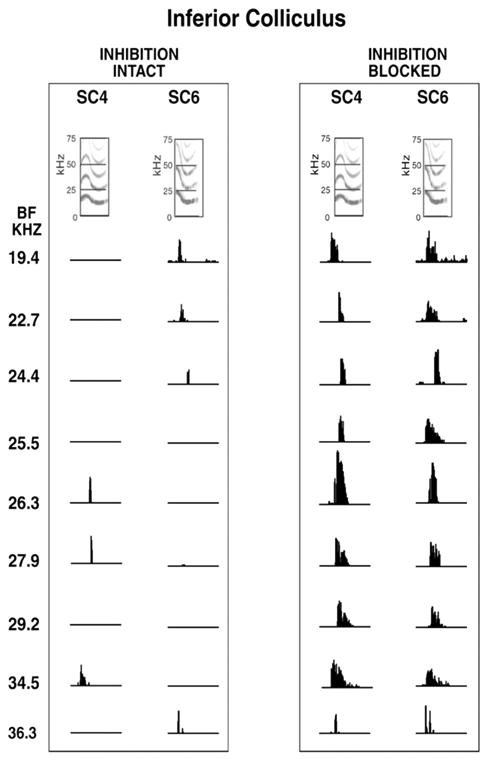
Responses of nine IC neurons to two calls, SC4 and SC6, before and while inhibition were blocked. The BFs of the neurons are arranged from low to high, which corresponds to the tonotopic organization of the IC. Note that the calls had similar spectrotemporal features but evoked different responses among the “population”. Before inhibition was blocked, the selectivities of the neurons were different. Three neurons that responded to call SC4 did not respond to SC6, and the four neurons that responded to SC6 did not respond to SC4. Blocking inhibition eliminated selectivities and now all neurons responded to both signals.
5. The importance of sideband inhibition is revealed by spectrotemporal receptive fields
The marked changes in selectivity for calls when inhibition is blocked shows that inhibition shapes response selectivity but does not show exactly how inhibition operates to shape those selectivities. Presumably, the inhibitory features that shaped the selectivities were the structures of each neuron's sideband inhibition, which when eliminated allowed ICc neurons to respond in a manner as unselectively as DNLL neurons. Specifically, it must be the timing and magnitude of inhibition relative to excitation that underlies selectivity, but exactly how those features are expressed in each ICc cell and how they differ among ICc cells to create the diverse selectivities among isofrequency cells is unclear.
To obtain a more detailed picture of both the excitatory and inhibitory fields in ICc cells, a large number of complex signals called moving ripples were presented and spectrotemporal receptive fields (STRFs) were generated by a process analogous to spike-triggered averaging of the signals that preceded each spike (Andoni et al., 2007; Klein et al., 2000). The STRF derived from one ICc cell is shown in both 2-D and 3-D forms in Fig. 6. The idea is that each ripple stimulus contains a broad spectra, and thus whenever the neuron fires some frequencies will be present in a random fashion, thereby generating the green background color in the 2-D and the green baseline in the 3-D STRF in Fig. 6. However, frequencies that are always present prior to a discharge sum and thereby form the red region in the 2-D and the peak in the 3-D STRF. Frequencies that are rarely or never present prior to a discharge form the blue region in the 2-D and the valleys or nadirs in the 3-D STRF. The frequencies represented in the peak and red colors were significantly different from the background and are presumed to be excitatory whereas the frequencies in the nadirs and blue colors were also significantly different from background and are presumed to be inhibitory. Given these assumptions, the STRF provides a picture of relative magnitudes and temporal relationships of excitation and inhibition.
Fig. 6.
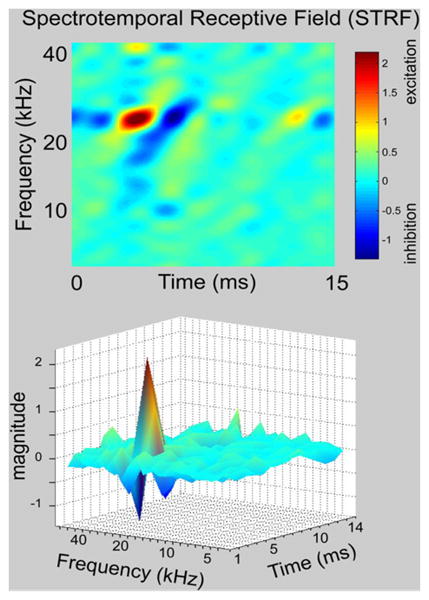
A spectrotemporal receptive field (STRF) recorded from an ICc neuron shown in both 2 dimensional (top panel) and 3 dimensional (bottom panel) views. See text for further explanation. The same STRF is also shown in Figs. 7 and 8.
To see whether the STRF could account for the cell's selectivities for communication calls, the STRF was convolved with a suite of communication calls that yielded a predicted response for each call. The responses predicted by the convolutions were then compared to the responses that were actually evoked by the same calls. In some cells, the responses evoked by the calls were accurately predicted by the convolutions. An example is shown in Fig. 7. The convolutions not only accurately predicted the calls to which the neurons responded and the temporal discharge pattern evoked by each call, they also predicted the calls to which the neurons did not respond. In short, the STRF captured the essential features of the cell and provided a picture of the relative magnitudes and timings of the excitatory and inhibitory inputs to the cell, which in turn predicted how the cell would respond to any stimulus.
Fig. 7.
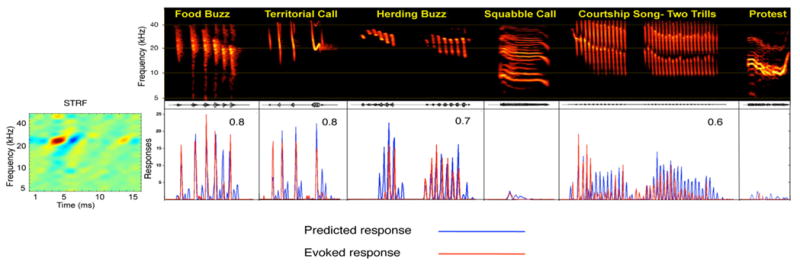
STRF provides accurate predictions of responses to species-specific calls. Spectrograms of each species-specific vocalization are shown in the top, with the evoked response of each IC neuron (red) and the predicted response of its STRF (blue) displayed below each call. Each row shows the predicted and evoked responses of an IC neuron with the STRF on the left. Predicted responses were generated by convolving the STRF with the spectrogram of each call. Correlation between predicted and actual response is shown in top right of each panel. Convolutions predicted the call selectivity of the neuron because they predicted very low response magnitudes for the calls that evoked little or virtually no responses but predicted high response magnitudes for those calls that evoked strong responses. Those calls that evoked little or no responses were used to demonstrate that convolving STRFs with those calls also predicted little or no activity, but no correlation coefficient was computed for those calls. Source: Andoni et al. (2007).
6. STRFs explain FM directional selectivities
STRFs in some cells not only predict the responses to communication calls, they can also explain why those cells expressed selectivities for features of the complex signals to which they responded. One selective feature explained by STRFs is why some neurons respond selectively to frequency modulations that sweep in one direction and respond either poorly or not at all to FMs that sweep in the other direction (Andoni et al., 2007). FMs are important components of communication signals in most animals, including humans, and, as shown previously, are especially prominent in both the echolocation and social communication calls emitted by bats. In Mexican free-tailed bats, many of these signals are FM signals that have starting frequencies of 30–40 kHz and sweep downward about an octave in frequency at velocities ranging from 0 to 250 octaves/s. Consistent with these signal features, the ICc of bats are dominated by FM direction-selective neurons that favor the downward direction (Andoni et al., 2007; Casseday et al., 1997; Fuzessery and Hall, 1996; Razak and Fuzessery, 2006; Suga, 1965; Voytenko and Galazyuk, 2007) and express a range preferences for sweep velocities that correspond to the sweep velocities in the signals they emit (Andoni et al., 2007; Razak and Fuzessery, 2006). This correspondence shows that a substantial portion of the ICc population is tuned to respond to the features in their conspecific vocalizations.
Directional selectivity for downward FM sweeps is strongly influenced by inhibition, since blocking inhibition greatly reduces the directional preferences (Andoni et al., 2007; Fuzessery and Hall, 1996). However, it is not inhibition per se that shapes directional selectivity but rather the important feature is the diagonal orientation, or tilts, of the excitatory and inhibitory fields relative to the spectral and temporal axes, i.e., the degree to which their receptive field is inseparable (Andoni et al., 2007; Depireux et al., 2001). Inseparable receptive fields have different temporal response properties at different frequencies. Preferences for FM sweep direction can be generated by orientation tilts in either the excitatory or inhibitory fields, but tilts in the inhibitory fields produce greater directionality than would be produced by tilts only in the excitatory fields. This is illustrated by the tilts in the inhibitory field of the neuron in Fig. 6. Tilted inhibitory fields enhance directional preferences, or even create them, because signals sweeping in the non-preferred direction simultaneously evoke both excitation and inhibition, thereby suppressing responses to that FM direction, whereas signals sweeping in the preferred direction activate excitation and inhibition at different times, thereby allowing the cell to respond to the preferred FM direction (Fig. 8). Thus the structure of the inhibitory field biases many ICc neurons for downward FM direction-selectivity and thereby shapes their responsiveness to specific features present in their vocalizations.
Fig. 8.
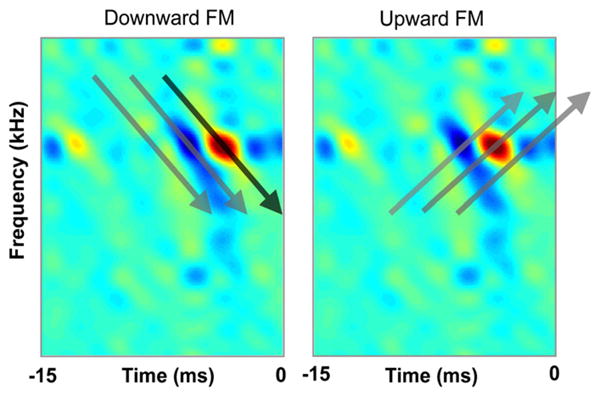
Tilted receptive fields impart directional selectivity for FM sweeps. The STRFs are shown as snapshots taken at three points in time as the STRF is convolved with the downward and upward FM sweeps. The key feature is that at some point in time the downward FM will only sweep through the excitatory portion of the STRF without encroaching upon the inhibitory portion and thereby excite and drive the cell. In contrast, the upward FM will never encroach only upon the excitatory part of the STRF but rather will sweep through both its excitatory and inhibitory portions, which will suppress excitation thereby preventing the neuron from firing. The same STRF as in Figs. 6 and 7 are shown but are flipped in time. STRF adapted from Andoni et al. (2007).
7. Predictive STRFs were found in only a minority of ICc neurons
The STRFs of cells in which the convolutions accurately predicted responses and explained response selectivities present a comprehensive view of the quantitative features of excitation and inhibition in both frequency and time. The cells that yielded predictive STRFs must have linearly added the inhibitions and excitations evoked by the rippled stimuli. Since STRFs reflect the average signal generated by such linear additions, the average representation of the excitatory and inhibitory fields generated by ripple stimuli was appropriate for predicting responses to other complex stimuli, such as the communication calls.
Predictive STRFs, however, were only found in a minority of ICc cells; the STRFs in most cells (66%) provided poor predictions or were non-interpretable (Andoni et al., 2007). The predicted responses assumed a linear relationship between the stimulus and the spiking output of IC neurons, an assumption that may not be applicable to all cells. Those cells with poor predictions apparently had either static or dynamic non-linear response properties that were stronger than the linear response properties extracted by the STRFs generated by ripples. Stated differently, the output of these neurons might depend on the non-linear interaction between multiple places in frequency and time that would not be captured by convolving a signal with the STRFs inhibitory and excitatory regions, even if some response nonlinearities, such as halfwave rectification, were accounted for. Therefore, the “STRFs” computed for those cells could not predict the response to a new complex signal, such as a call, because the interactions of excitation and inhibition would scale differently for the call than the average derived from the ripples. It seems significant in this regard that Brimijoin and O'Neill, 2005 also found that predictions of FM directionality based on the discharge vigor and latencies evoked by a wide range of tone bursts was successful in only about 30% of the neurons they recorded in the IC of mustache bats. In short, while some cells in the IC seem to integrate inputs in a linear fashion such that the response to an FM sweep is simply the sum of the responses to the frequencies that compose the FM, the majority do not, and are markedly non-linear.
8. The limitations of extracellular recordings for evaluating inhibition
The problems with generating STRFs in non-linear cells also pertains to the more general problem of determining detailed features of inhibition with extracellular recordings. Inhibition cannot be directly measured with extracellular electrodes but rather has to be inferred from the suppressive effects of some stimulus manipulation on the discharges evoked by another stimulus. Furthermore, with extracellular recordings there is an uncertainty about whether the observed spike suppression was due to inhibition at the ICc or whether the suppression was inherited from the inhibition that occurred in a lower nucleus. Extracellular recordings used in combination with receptor blockers or with inactivation of a lower nucleus can localize the inhibition to the ICc, and thus overcome one of the limitations of extracellular recordings. However, quantitative features of inhibition cannot be directly observed and must be inferred from changes in driven activity when drugs are applied, as shown previously for tuning curve expansions.
The best way to determine how synaptic events interact to generate emergent properties is to directly measure the excitation and inhibition evoked by those signals. To circumvent the problems encountered with indirect estimations of inhibition from extracellular recordings, the synaptic events evoked by FM signals were directly visualized with intracellular recordings made with patch electrodes from the ICc of awake bats (Gittelman et al., 2009; Xie et al., 2008).
9. Directional features of ICc cells measured with in vivo whole-cell recordings
With patch recordings, as with extracellular recordings, the spike-counts evoked in most ICc cells exhibited a preference for one FM sweep direction over the other (Gittelman et al., 2009; Xie et al., 2007) (Fig. 9). With patch recordings however, both the inputs to the cells, expressed in the amplitudes of EPSPs or IPSPs, and their outputs, their spike-counts, are obtained. The selectivity differences of the inputs can be quantified by computing a PSP directional index (downward EPSP amplitude minus upward amplitude divided by the sum of the two amplitudes). Similarly, the selectivity differences of the outputs, discharges, are quantified by computing a discharge directional index based on spike-counts rather than PSP amplitudes. Thus the directional preferences of the inputs can be quantitatively compared to the directional preferences of the outputs.
Fig. 9.
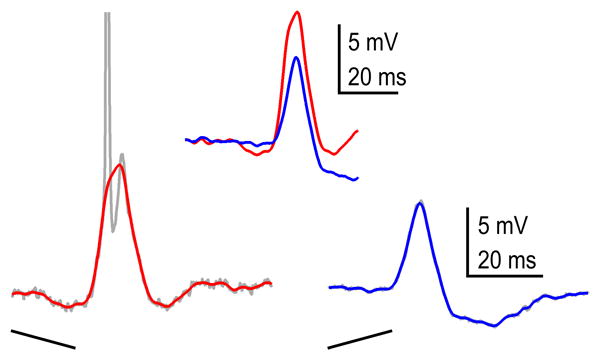
Intracellular responses evoked from an ICc cell to a downward (left response) and an upward sweeping FM signal. The neuron discharged to every presentation (10 spikes/10 stimuli) of the downward (preferred) FM but never fired (0 spikes/10 stimuli) to the null (upward) FM. Thus the directional selectivity of the spiking was perfect (1.0). In contrast, the EPSP evoked by the preferred FM was only slightly larger than the PSP evoked by the null FM and thus the directional selectivity index of the PSPs was small (0.2). Both FM signals were composed of the same frequencies and have the same sweep rates but differed only in the direction of the sweep.
In most ICc cells, the differences in the spike-counts evoked by the two FMs were substantially greater than the differences in the magnitudes of the PSPs evoked by the same signals (Gittelman et al., 2009). The discharge output of the cell in Fig. 9, for example, was perfectly selective for the preferred (downward) FM; it fired to every presentation of the preferred FM and never fired to the null (upward) FM, and thus had a discharge directional index of 1.0. In marked contrast, the EPSP amplitudes evoked by the two signals were similar, and the same cell had a PSP directional index of only 0.2. The disparity in the high spike selectivity compared to the low PSP selectivity is due to the non-linear influence of spike threshold, where the larger PSP evoked by the preferred FM in this cell was above threshold, and evoked a discharge on every presentation, whereas the PSP evoked by the null FM, while only slightly smaller, was a few mV below threshold and failed to evoke spikes. Although the cell in Fig. 9 is an extreme example, it illustrates the general finding that the inputs (PSPs) were less selective than the outputs (spikes). On average, the spike-DSI was more than twice as large as the PSPeDSI among the ICc population.
10. Excitatory and inhibitory conductances can be computed and manipulated
In a subset of cells, the underlying excitatory and inhibitory conductances evoked by preferred and null sweeping FMs were computed from FM responses recorded in current clamp mode, where responses evoked by each FM were recorded at a different level of membrane hyperpolarization (Gittelman et al., 2009). The conductances were then used in a model to compute predicted responses for the preferred and null FMs, as first described by Priebe and Ferster (2005). The computations do not incorporate voltage gated channels and thus the computations only predict the PSP, either the EPSP or IPSP or both, that would be evoked by preferred or null FM. The close agreement between the predicted responses and those actually evoked by the preferred and null FM signals are illustrated by the cell in Fig. 10.The lower panels of Fig. 10 show the excitatory conductances (red) and the inhibitory conductances (blue) that were used to compute the predicted responses.
Fig. 10.
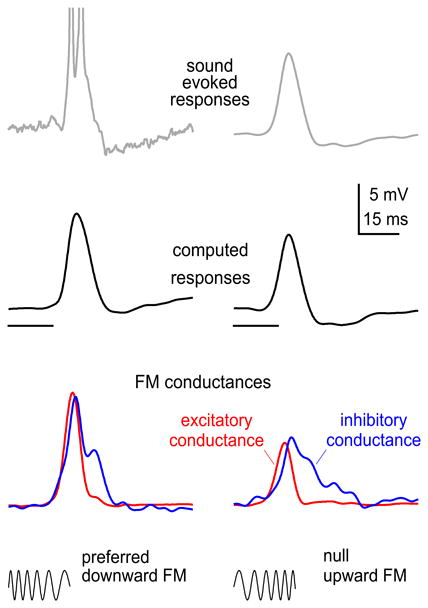
Intracellular responses evoked by a downward and upward FM sweep (top panel). The excitatory and inhibitory conductances evoked by each FM is shown in the lower panel. The predicted PSPs that were computed from the conductances are shown in the middle panel. Notice that the predicted PSPs correspond closely to the sound evoked PSPs. The close correspondence is especially apparent for the sound evoked null PSP since no spikes were evoked by the upward (null) FM.
The conductance waveforms evoked by the preferred and null FMs in Fig.10 have three asymmetries. The first is the asymmetry in the magnitudes (area under the curve) of the excitatory conductances evoked by the two FM signals, where the excitatory conductance evoked by the preferred FM was more than twice as large as the excitatory conductance evoked by the null FM. The second is the asymmetry in the magnitudes of the inhibitory conductances evoked by the two FMs. The third is the asymmetries in the temporal features of the conductances, the latencies and shapes of the waveforms, where temporal features of the preferred excitatory and inhibitory conductances were different from the temporal features of the null excitatory and inhibitory conductances.
Which of the asymmetries is most important for shaping the difference in the preferred and null evoked responses? Since the conductances predict the responses evoked by FM signals, the magnitudes and/or temporal features of the excitatory and inhibitory conductances can be manipulated independently, and the manipulated conductance values can be inserted into the model to compute “new” predicted responses (Gittelman et al., 2009). By comparing the new (manipulated) predicted responses to the sound evoked responses, the relative impact of each conductance feature for shaping the sound evoked responses could be assessed.
11. Input magnitudes are more important than the timing
Differences in conductance magnitudes evoked by the preferred and null FMs made a larger contribution to the sound evoked PSP amplitudes than temporal differences. This was shown in swapping experiments, where the temporal envelopes (latency and shape) of the conductances were preserved but the magnitudes (area under the curve) of the preferred excitatory and inhibitory conductances were scaled (Fig. 11)(Gittelman et al., 2009). The scaling made the preferred excitatory conductance equal to the magnitude of the null excitatory conductance and the magnitude of the preferred inhibitory conductance equal to magnitude of the null inhibitory conductance. These “swapped” conductances had the preferred temporal envelopes, but the null magnitudes. Similarly, the null conductances were scaled to create a swapped conductance with null timings and the preferred magnitudes. Directional preferences in the PSPs computed from the control conductances were compared to the PSPs computed from the swapped conductances. The conductances with the null timing and preferred magnitude always generated a larger depolarization than the pair with the preferred timing and the null magnitude. Directionality follows the magnitude, indicating that magnitude asymmetries play a greater role in determining the directional preference than temporal asymmetries.
Fig. 11.
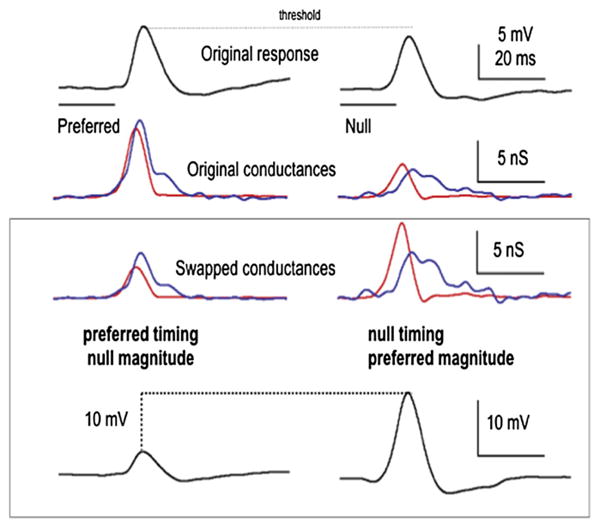
To determine the relative contribution of magnitude asymmetries compared to temporal asymmetries in generating directional selectivity in the PSPs, the conductance waveforms of the preferred and null FMs were swapped. One swapped conductance had the timing (latency and shape) of the preferred FM and the magnitude (area under the curve) of the null FM. The other had the null timing and the preferred magnitude. We swapped magnitudes of both inhibitory and excitatory conductances, and the resulting swapped conductances were then used to compute the predicted PSPs that would be evoked by the swapped conductances. The swapped conductances with the preferred magnitudes evoked a larger PSP compared to those with the null magnitudes, showing that magnitude asymmetries were more important than timing in generating PSP directionality. Source: Gittelman et al., 2009.
12. Excitatory inputs convey directionality and are shaped by inhibition in the ICc
In the cells from which conductances were derived, excitatory conductances evoked by the preferred FM were always larger than the excitatory conductances evoked by the null FMs, as shown in Fig. 12. This disparity shows that the information for directional preferences is already present in the excitatory inputs. Consequently, the EPSPs computed from the excitatory conductances of the preferred FMs were always larger than the EPSPs computed from the excitatory conductances of the null FM. It should be noted, however, that the excitatory drives imparted by both FMs were always suprathreshold; in the absence of inhibition, both signals would have evoked spikes every time they were received at the ear.
Fig. 12.
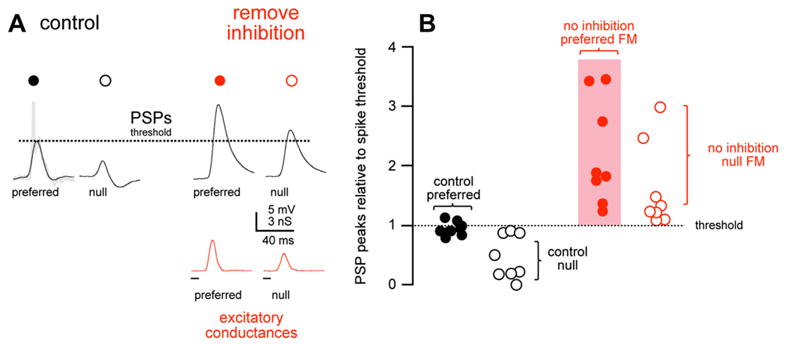
(a) Predicted membrane responses to preferred and null FMs (black lines) computed from both excitatory and inhibitory conductances (control). The response, the PSP and truncated spike, actually evoked by the preferred FM is shown in grey. On the right are the responses computed from only the excitatory conductances (remove inhibition), simulating a condition where inhibition was blocked. With inhibition blocked, both the null and preferred PSPs exceed spike threshold (dashed line). (b) The computed PSP peak amplitudes (peak – rest) normalized to spike threshold (dashed line). The control preferred PSPs (black filled), computed from both the excitatory and inhibitory conductances, were very close to spike threshold, whereas the control null PSPs (black, open) were ≤ spike threshold. With inhibition blocked (red), both the preferred (filled) and null (open) PSPs exceeded spike threshold. Source: Gittelman et al. (2009).
Inhibition sculpted the excitatory responses and thereby generated the final responses in which the discharge selectivity was greater than the selectivity of the PSPs. The general trend is that the inhibitory magnitudes evoked by each signal varied with the excitation such that FMs that generated larger excitatory conductances also generated larger inhibitory conductances, although there were a few exceptions to that general trend.
The way that inhibition shaped the final responses is illustrated by the two cells in Fig. 13. In one cell, inhibition scaled with excitation; the larger excitatory conductance generated by the The way that inhibition shaped the final responses is illustrated by the two cells in Fig. 13. In one cell, inhibition scaled with excitation; the larger excitatory conductance generated by the preferred EPSP is larger than the null EPSP but both were suprathreshold, as in all cells. The effect on the EPSPs of adding inhibitions to the excitations is shown in the bottom panel. The larger inhibition evoked by the preferred FM reduced the EPSP generated by excitation, but since that EPSP was large to begin with, the reduced EPSP amplitude due to the addition of inhibition was still supra-threshold, and thus evoked discharges. The smaller inhibition evoked by the null FM caused a smaller reduction in EPSP amplitude than the preferred response. However, the null EPSP generated by excitation alone was small, and inhibition reduced the null EPSP amplitude to a level just below threshold. The net result is two EPSPs, one evoked by the preferred the other by the null FM, each with similar amplitudes that differed by only a few mVs. Although the EPSPs are marginally different, the preferred is above threshold while the null is just below threshold. Consequently the discharge probability that was evoked by the preferred FM was 1.4 spikes/ stimulus while the discharge probability evoked by the null FM was only 0.3 spikes/stimulus. This again illustrates that spike threshold amplifies a small difference in PSP amplitudes into a large difference in discharge vigor, and the fine tuning of PSP amplitudes by inhibition created the conditions that allowed that amplification to be expressed.
Fig. 13.
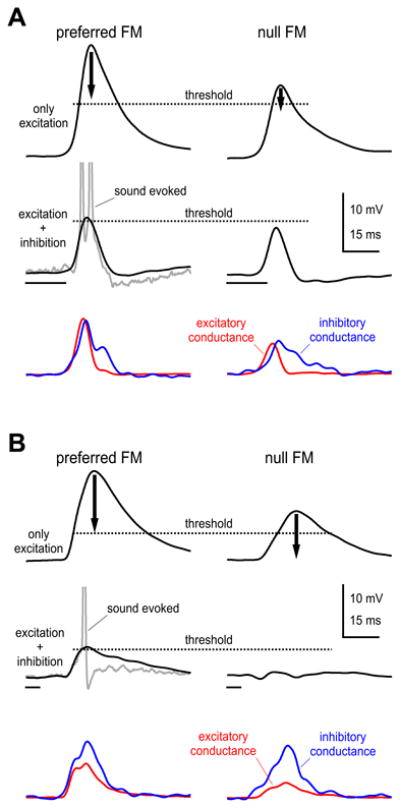
Schematic illustration of how Inhibition shapes responses to preferred and null FM sweeps in two ICc cells. In one cell (A) the preferred inhibitory conductance was larger than the null inhibitory conductance whereas for the cell in B, the inhibitory conductances were equal. Top panels in both A and B show predicted preferred and null EPSPs computed only from the excitatory conductances. The arrows indicate the degree to which the addition of inhibitions suppressed the EPSPs. The predicted responses for the preferred and null FMs computed from both the excitatory and inhibitory conductances are shown below (black lines). The actual sound evoked responses evoked by the preferred FMs are shown in grey. Thresholds were estimated from the change in slope of the sound evoked EPSPs and are shown as dotted lines. See text for further explanation.
The effects of inhibition on the null FM PSP in most cells were slightly stronger than the nuanced effects of inhibition on the cell in Fig. 13A. In the majority of cells, inhibition still scaled with excitation but the null inhibition suppressed the null excitation to a greater degree as shown in Fig. 13A. Thus the preferred EPSPs were above threshold while the null EPSPs were several mVs below threshold, resulting in larger differences in the amplitudes of the preferred and null EPSPs compared to very small difference in Fig. 13A. In a few cells inhibition did not scale with excitation, and the inhibitory conductances evoked by both the preferred and null FMs were equally strong (Fig. 13B).In those cells, as in all the others, the preferred excitatory conductances were substantially larger than the null. However, the net effects of the equal inhibitions were that the preferred EPSPs generated by the excitatory conductance were reduced by inhibition but were still suprathreshold, whereas the equally strong null inhibition completely swamped the smaller null excitation, and generated a small IPSP. In these cases, the spike directional indices, which reflected the difference in spikes evoked by the two FMs, were comparable to the PSP directional indices, which reflected the difference in the PSP amplitudes evoked by the FMs.
13. Summary and concluding thoughts
One of the main features of the mammalian inferior colliculus is that it is the first nucleus in which a wide variety of new response properties are first assembled. The richness and variety of response properties expressed by ICc cells are either shaped or created by the actions of inhibition. Inhibition is the sculptor in the ICc, carving out new response selectivities from a background of less selective excitatory inputs.
The influences of inhibition vary among ICc cells, where inhibition is massive and overwhelming in some ICc cells, e.g., cells with null tuning curves, whereas in others inhibition has more subtle, yet significant influences, e.g., in directionally selective ICc cells where inhibition suppresses null EPSPs to a level barely below threshold. Inhibition shapes a wide variety of basic responses properties, which include first spike latencies (Covey et al., 1996; Park and Pollak, 1993a), temporal discharge patterns (Le Beau et al., 1996; Pollak and Park, 1993), rate-level functions and tuning curves (Faingold et al., 1991; Le Beau et al., 1996; LeBeau et al., 2001; Yang et al., 1992), as well a host of more complex properties. These include not only directional selectivities for FM sweeps (Andoni et al., 2007; Fuzessery and Hall,1996), but duration tuning (Casseday et al., 1994, 2000), the various varieties of combination sensitivities that first emerge in the ICc (Nataraj and Wenstrup, 2005; Wenstrup and Leroy, 2001), and the binaural response properties of excitatory–inhibitory cells that code for sound location (Burger and Pollak, 2001; Faingold et al., 1993; Li and Kelly, 1992; Park and Pollak, 1993b).
14. Inhibition forms selectivities in some cells and sculpts it in others
The emergent properties in the ICc are often formed de novo in the ICc from the interactions of excitation and inhibition. The de novo formations are well illustrated by the formation of FM selectivities by the interactions of excitatory inputs with the tilted inhibitory surrounds of some ICc cells, as was shown in Fig. 8. It is also illustrated by the formation of duration tuning and the excitatory–inhibitory properties in a subset of binaural ICc cells. In all of those cells, blocking inhibition virtually eliminated the emergent property; when inhibition is blocked, duration tuned cells respond non-selectively to tone durations Casseday et al., 1994, directionally selective cells respond equally or almost equally well to upward and downward FMs (Andoni et al., 2007; Fuzessery and Hall, 1996), and some binaural cells excited by one ear and inhibited by the other are transformed into monaural cells whose discharges are uninfluenced by stimulation at the ipsilateral ear that previously had strongly or completely suppressed the contralaterally evoked discharges (Burger and Pollak, 2001; Park and Pollak, 1993b, 1994).
In other ICc cells, the formation of the emergent property is sculpted by inhibition but in more subtle ways. The patch recordings from ICc cells described previously show that inputs to some ICc neurons are themselves directional. This shows that the construction of FM directionality in some ICc cells is accomplished through a two-stage process that requires integrating input magnitudes, rather than de novo construction through the precise timing of excitation and inhibition. In the first stage some degree of directionality is established in one or a few lower nuclei. The lower cells do not have to be strongly directional, but only weakly directional, features consistent with most of the directionally selective cells described in the cochlear nucleus. The summation of firing rates from multiple excitatory projections, some of which may be non-directional and others weakly directional, provides the slight directionality of the excitatory innervation. The inhibitory innervation may also derive from directional and non-directional lower nuclei, or it may be entirely non-directional. The excitatory and inhibitory innervation then sums over time, where small differences in arrival times of excitation and inhibition are relatively unimportant. The excitatory inputs are relatively large, so that unchecked by inhibition, even the null FMs would always evoke suprathreshold EPSPs. In the presence of inhibition, however, the EPSPs evoked by the preferred FM are scaled down such that they peak just above spike threshold whereas the EPSPs evoked by the null are suppressed to levels that are just at or just below threshold levels. Spike threshold then acts as a non-linear amplifier that transforms relatively small differences in PSP magnitudes into large directional preferences in the discharges (Gittelman et al., 2009).
15. Some thoughts on the progressive transformations along the ascending auditory pathway
The disparities between the selectivities of the inputs and those of the outputs has general implications for thinking about the ways by which selective discharge properties are created in the auditory system. Typically, the implicit assumption is that discharge strength scales linearly with PSP amplitude, and thus the degree of discharge selectivity reflects the selectivities of the underlying events, the PSPs that generated the discharges. Traditional thinking about FM directional, as just one example, assumes that a preferred FM that evokes a high firing probability also evokes a strong EPSP, generated by an excitation that precedes, and thus is unopposed by an IPSP that occurs later in time, as (Andoni et al., 2007; Casseday et al., 1997; Fuzessery and Hall, 1996; Poon et al., 1991; Suga, 1968). The assumption for a null FM that fails to evoke spikes is that it evokes the same degree of excitation evoked by the preferred FM, but the excitation is strongly suppressed by an inhibition that occurs either slightly before or coincidentally with the excitation. Hence the assumption is that a strong discharge probability evoked by the preferred FM is due to a comparably strong EPSP while the failure to respond to the null FM is due a small, subthreshold EPSP or an IPSP. Suppression of the null excitation to a lesser degree, either by a weaker inhibition or an inhibition whose timing is not optimal for the suppression of the EPSP, would account for null FMs that evoke some discharges, but with lower probabilities than the preferred. Selectivity, in these cells, is created entirely in the ICc from non-selective inputs and is due to differences only in the timing of inhibition evoked by the preferred compared to the null signal, as illustrated in Fig. 1A. In short, the population in the inferior colliculus is highly heterogeneous. In some IC cells FM directional selectivity is formed in a linear manner due to the differences in the timing of excitation and inhibition as illustrated in Fig. 1A whereas in others timing is far less important because of the non-linear processing of FM sweeps. In those non-linear ICc cells, the magnitudes of the excitation and inhibition evoked by the preferred and null FMs are substantially different, where the preferred FM always evokes a larger excitation than the null, and the final sculpting of directional selectivity is the degree to which inhibition suppresses the preferred excitation relative to the null excitation (e.g., Fig. 13).
In some of the non-linear cells, downward and upward FMs evoke only marginally different PSP amplitudes but evoke perfect or strong discharge selectivity. In these cells, the substantial differences in discharge strengths are not an expression of comparable differences in the PSPs that evoked the discharges. Stated differently, the PSPs evoked by different signals can be similar in amplitudes but the similar PSPs evoke profoundly different spike-counts due to the amplification imparted by spike threshold (e.g., Figs. 9 and 10). Such differences between the inputs to and the outputs from cells also suggest that highly selective discharge properties can be created by only minor adjustments in the synaptic strengths evoked by one or both signals. If minor adjustments of the inputs can create selective discharge properties, then minor adjustments can also change a highly selective neuron into one whose discharge vigor is unselective, or one that is unresponsive to either signal. Minor adjustments can even cause a reversal such that the signal that previously was the preferred now becomes the null, and the signal that was the null becomes preferred. This not only suggests that selective discharge properties can be formed from minor adjustments in synaptic strengths, but it also suggests that plasticity of response features may be achieved with far less modifications in circuitry than previously supposed.
Some thoughts about Jeff and his influence on my career
George D. Pollak
Jeff had a profound influence on both my thinking about the auditory system and the experiments that I conducted during the past 25 years. The original focus of my laboratory was to elucidate the adaptations in the ICc that enabled bats to interpret echoes and thereby substitute their sense of vision with audition and thereby “see the world through their ears”. My studies were at first devoted to recording single units from the ICc, but I also wanted to know what the structural underpinnings were of the responses that my students and I were recording from ICc neurons. In 1982 I started working with John Zook, who in turn introduced me to Jeff Winer. Both John and Jeff introduced me to the world of the comparative connectional anatomy and neuronal architecture of the auditory brainstem.
Jeff was especially influential and I can distill his influence on my thinking with two major insights that he gave me. The first is that the brainstem auditory system of bats is quintessentially mammalian, with the same cell types, synaptic morphology, neurochemistry and connections as in all the other mammals. The differences among the brainstem auditory systems of mammals were primarily one of emphasis and proportion rather than kind. The second insight was the enormity of the inhibitory inputs to the ICc. Indeed, Jeff showed me that the inhibitory projections to the ICc were at least as large, if not larger, than the excitatory projections. These insights profoundly influenced my thinking about the auditory system and my future research directions. I have come to view the processing of acoustic information in bats as a model for mammalian acoustic processing, where many features, both anatomical and physiological, are present in more pronounced forms than in less specialized mammals and inhibition as the dominant force in the ICc that shapes and sculpts highly selective response properties from relatively undifferentiated excitatory inputs. These are themes of this review that I derived, in large part, from my association and collaboration with Jeff.
Acknowledgments
Supported by NIH Grant DC007856.
Abbreviations
- DCN
dorsal cochlear nucleus
- DNLL
dorsal nucleus of the lateral lemniscus
- EPSP
excitatory post-synaptic potential
- FM
frequency modulation
- ICc
central nucleus of the inferior colliculus
- INLL
Intermediate nucleus of the lateral lemniscus
- IPSP
inhibitory post-synaptic potential
- LSO
lateral superior olive
- MSO
medial superior olive
- mV
millivolt
- PSP
post-synaptic potential
- STRF
spec-trotemporal receptive field
- VNLLc
columnar division of the ventral nucleus of the lateral lemniscus
Contributor Information
George D. Pollak, Email: gpollak@mail.utexas.edu.
Ruili Xie, Email: ruili_xie@med.uncedu.
Joshua X. Gittelman, Email: jxg@mail.utexas.edu.
Sari Andoni, Email: andoni@mail.utexas.edu.
Na Li, Email: nalibat@mail.utexas.edu.
References
- Adams JC, Mugnaini E. Dorsal nucleus of the lateral lemniscus: a nucleus of GABAergic projection neurons. Brain Res Bull. 1984;14:585–590. doi: 10.1016/0361-9230(84)90041-8. [DOI] [PubMed] [Google Scholar]
- Andoni S, Li N, Pollak GD. Spectrotemporal receptive fields in the inferior colliculus revealing selectivity for spectral motion in conspecific vocalizations. J Neurosci. 2007;27:4882–4893. doi: 10.1523/JNEUROSCI.4342-06.2007. [DOI] [PMC free article] [PubMed] [Google Scholar]
- Bajo VM, Merchan MA, Malmierca MS, Nodal FR, Bjaalie JG. Topographic organization of the dorsal nucleus of the lateral lemniscus in the cat. J Comp Neurol. 1999;407:349–366. doi: 10.1002/(sici)1096-9861(19990510)407:3<349::aid-cne4>3.0.co;2-5. [DOI] [PubMed] [Google Scholar]
- Bauer EE, Klug A, Pollak GD. Spectral determination of responses to species-specific calls in the dorsal nucleus of the lateral lemniscus. J Neuro-physiol. 2002;88:1955–1967. doi: 10.1152/jn.2002.88.4.1955. [DOI] [PubMed] [Google Scholar]
- Bohn KM, Schmidt-French B, Ma ST, Pollak GD. Syllable acoustics, temporal patterns, and call composition vary with behavioral context in Mexican free-tailed bats. J Acoust Soc Am. 2008;124:1838–1848. doi: 10.1121/1.2953314. [DOI] [PMC free article] [PubMed] [Google Scholar]
- Bohn KM, Schmidt-French B, Schwartz C, Smotherman M, Pollak GD. Versatility and stereotypy of free-tailed bat songs. PLoS One. 2009;4:e6746. doi: 10.1371/journal.pone.0006746. [DOI] [PMC free article] [PubMed] [Google Scholar]
- Brimijoin WO, O'Neill WE. On the prediction of sweep rate and directional selectivity for FM sounds from two-tone interactions in the inferior colliculus. Hear Res. 2005;210:63–79. doi: 10.1016/j.heares.2005.07.005. [DOI] [PMC free article] [PubMed] [Google Scholar]
- Burger RM, Pollak GD. Reversible inactivation of the dorsal nucleus of the lateral lemniscus reveals its role in the processing of multiple sound sources in the inferior colliculus of bats. J Neurosci. 2001;21:4830–4843. doi: 10.1523/JNEUROSCI.21-13-04830.2001. [DOI] [PMC free article] [PubMed] [Google Scholar]
- Casseday JH, Ehrlich D, Covey E. Neural tuning for sound duration: role of inhibitory mechanisms in the inferior colliculus. Science. 1994;264:847–850. doi: 10.1126/science.8171341. [DOI] [PubMed] [Google Scholar]
- Casseday JH, Covey E, Grothe B. Neural selectivity and tuning for sinusoidal frequency modulations in the inferior colliculus of the big brown bat, Eptesicus fuscus. J Neurophysiol. 1997;77:1595–1605. doi: 10.1152/jn.1997.77.3.1595. [DOI] [PubMed] [Google Scholar]
- Casseday JH, Ehrlich D, Covey E. Neural measurement of sound duration: control by excitatory–inhibitory interactions in the inferior colliculus. J Neurophysiol. 2000;84:1475–1487. doi: 10.1152/jn.2000.84.3.1475. [DOI] [PubMed] [Google Scholar]
- Casseday JH, Fremouw T, Covey E. The inferior colliculus: a hub for the central auditory system. In: Oertel D, Popper AN, Fay RR, editors. Integrative Functions in the Mammalian Auditory Pathway. Vol. 15. Springer-Verlag; New York: 2002. pp. 238–318. [Google Scholar]
- Covey E, Casseday JH. Timing in the auditory system of the bat. Annu Rev Physiol. 1999;61:457–476. doi: 10.1146/annurev.physiol.61.1.457. [DOI] [PubMed] [Google Scholar]
- Covey E, Kauer JA, Casseday JH. Whole-cell patch-clamp recording reveals subthreshold sound-evoked postsynaptic currents in the inferior colliculus of awake bats. J Neurosci. 1996;16:3009–3018. doi: 10.1523/JNEUROSCI.16-09-03009.1996. [DOI] [PMC free article] [PubMed] [Google Scholar]
- Davis KA. Evidence of a functionally segregated pathway from dorsal cochlear nucleus to inferior colliculus. J Neurophysiol. 2002;87:1824–1835. doi: 10.1152/jn.00769.2001. [DOI] [PubMed] [Google Scholar]
- Davis KA, Ramachandran R, May BJ. Auditory processing of spectral cues for sound localization in the inferior colliculus. J Assoc Res Otolaryngol. 2003;4:148–163. doi: 10.1007/s10162-002-2002-5. [DOI] [PMC free article] [PubMed] [Google Scholar]
- Depireux DA, Simon JZ, Klein DJ, Shamma SA. Spectro-temporal response field characterization with dynamic ripples in ferret primary auditory cortex. J Neurophysiol. 2001;85:1220–1234. doi: 10.1152/jn.2001.85.3.1220. [DOI] [PubMed] [Google Scholar]
- Doupe AJ, Kuhl PK. Birdsong and human speech: common themes and mechanisms. Annu Rev Neurosci. 1999;22:567–631. doi: 10.1146/annurev.neuro.22.1.567. [DOI] [PubMed] [Google Scholar]
- Faingold CL, Boersma Anderson CA, Caspary DM. Involvement of GABA in acoustically-evoked inhibition in inferior colliculus neurons. Hear Res. 1991;52:201–216. doi: 10.1016/0378-5955(91)90200-s. [DOI] [PubMed] [Google Scholar]
- Faingold CL, Anderson CA, Randall ME. Stimulation or blockade of the dorsal nucleus of the lateral lemniscus alters binaural and tonic inhibition in contralateral inferior colliculus neurons. Hear Res. 1993;69:98–106. doi: 10.1016/0378-5955(93)90097-k. [DOI] [PubMed] [Google Scholar]
- Felsheim C, Ostwald J. Responses to exponential frequency modulations in the rat inferior colliculus. Hear Res. 1996;98:137–151. doi: 10.1016/0378-5955(96)00078-0. [DOI] [PubMed] [Google Scholar]
- Feng AS, Vater M. Functional organization of the cochlear nucleus of rufous horseshoe bats (Rhinolophus rouxi): frequencies and internal connections are arranged in slabs. J Comp Neurol. 1985;235:529–553. doi: 10.1002/cne.902350410. [DOI] [PubMed] [Google Scholar]
- Fuzessery ZM. Response selectivity for multiple dimensions of frequency sweeps in the pallid bat inferior colliculus. J Neurophysiol. 1994;72:1061–1079. doi: 10.1152/jn.1994.72.3.1061. [DOI] [PubMed] [Google Scholar]
- Fuzessery ZM, Hall JC. Role of GABA in shaping frequency tuning and creating FM sweep selectivity in the inferior colliculus. J Neurophysiol. 1996;76:1059–1073. doi: 10.1152/jn.1996.76.2.1059. [DOI] [PubMed] [Google Scholar]
- Fuzessery ZM, Richardson MD, Coburn MS. Neural mechanisms underlying selectivity for the rate and direction of frequency-modulated sweeps in the inferior colliculus of the pallid bat. J Neurophysiol. 2006;96:1320–1336. doi: 10.1152/jn.00021.2006. [DOI] [PubMed] [Google Scholar]
- Gaese BH, King I, Felsheim C, Ostwald J, von der Behrens W. Discrimination of direction in fast frequency-modulated tones by rats. J Assoc Res Otolaryngol. 2006;7:48–58. doi: 10.1007/s10162-005-0022-7. [DOI] [PMC free article] [PubMed] [Google Scholar]
- Gittelman JX, Li N, Pollak GD. Mechanisms underlying directional selectivity for frequency modulated sweeps in the inferior colliculus revealed by in vivo whole-cell recordings. J Neurosci. 2009;29:13030–13041. doi: 10.1523/JNEUROSCI.2477-09.2009. [DOI] [PMC free article] [PubMed] [Google Scholar]
- Glendenning KK, Baker BN, Hutson KA, Masterton RB. Acoustic chiasm V: inhibition and excitation in the ipsilateral and contralateral projections of LSO. J Comp Neurol. 1992;319:100–122. doi: 10.1002/cne.903190110. [DOI] [PubMed] [Google Scholar]
- Golding NL, Robertson D, Oertel D. Recordings from slices indicate that octopus cells of the cochlear nucleus detect coincident firing of auditory nerve fibers with temporal precision. J Neurosci. 1995;15:3138–3153. doi: 10.1523/JNEUROSCI.15-04-03138.1995. [DOI] [PMC free article] [PubMed] [Google Scholar]
- Gordon M, O'Neill WE. Temporal processing across frequency channels by FM selective auditory neurons can account for FM rate selectivity. Hear Res. 1998;122:97–108. doi: 10.1016/s0378-5955(98)00087-2. [DOI] [PubMed] [Google Scholar]
- Holmstrom L, Roberts PD, Portfors CV. Responses to social vocalizations in the inferior colliculus of the mustached bat are influenced by secondary tuning curves. J Neurophysiol. 2007;98:3461–3472. doi: 10.1152/jn.00638.2007. [DOI] [PubMed] [Google Scholar]
- Holy TE, Guo Z. Ultrasonic songs of male mice. PLoS Biol. 2005;3:e386. doi: 10.1371/journal.pbio.0030386. [DOI] [PMC free article] [PubMed] [Google Scholar]
- Kanwal JS, Matsumura S, Ohlemiller K, Suga N. Analysis of acoustic elements and syntax in communication sounds emitted by mustached bats. J Acoust Soc Am. 1994;96:1229–1254. doi: 10.1121/1.410273. [DOI] [PubMed] [Google Scholar]
- Klein DJ, Depireux DA, Simon JZ, Shamma SA. Robust spectrotemporal reverse correlation for the auditory system: optimizing stimulus design. J Comput Neurosci. 2000;9:85–111. doi: 10.1023/a:1008990412183. [DOI] [PubMed] [Google Scholar]
- Klug A, Bauer EE, Hanson JT, Hurley L, Meitzen J, Pollak GD. Response selectivity for species-specific calls in the inferior colliculus of Mexican free-tailed bats is generated by inhibition. J Neurophysiol. 2002;88:1941–1954. doi: 10.1152/jn.2002.88.4.1941. [DOI] [PubMed] [Google Scholar]
- Koch U, Grothe B. GABAergic and glycinergic inhibition sharpens tuning for frequency modulations in the inferior colliculus of the big brown bat. J Neurophysiol. 1998;80:71–82. doi: 10.1152/jn.1998.80.1.71. [DOI] [PubMed] [Google Scholar]
- Le Beau FE, Rees A, Malmierca MS. Contribution of GABA- and glycine-mediated inhibition to the monaural temporal response properties of neurons in the inferior colliculus. J Neurophysiol. 1996;75:902–919. doi: 10.1152/jn.1996.75.2.902. [DOI] [PubMed] [Google Scholar]
- LeBeau FE, Malmierca MS, Rees A. Iontophoresis in vivo demonstrates a key role for GABA(A) and glycinergic inhibition in shaping frequency response areas in the inferior colliculus of guinea pig. J Neurosci. 2001;21:7303–7312. doi: 10.1523/JNEUROSCI.21-18-07303.2001. [DOI] [PMC free article] [PubMed] [Google Scholar]
- Li L, Kelly JB. Inhibitory influence of the dorsal nucleus of the lateral lemniscus on binaural responses in the rat's inferior colliculus. J Neurosci. 1992;12:4530–4539. doi: 10.1523/JNEUROSCI.12-11-04530.1992. [DOI] [PMC free article] [PubMed] [Google Scholar]
- Malmierca MS, Hernandez O, Rees A. Intercollicular commissural projections modulate neuronal responses in the inferior colliculus. Eur J Neurosci. 2005a;21:2701–2710. doi: 10.1111/j.1460-9568.2005.04103.x. [DOI] [PubMed] [Google Scholar]
- Malmierca MS, Saint Marie RL, Merchan MA, Oliver DL. Laminar inputs from dorsal cochlear nucleus and ventral cochlear nucleus to the central nucleus of the inferior colliculus: two patterns of convergence. Neuroscience. 2005b;136:883–894. doi: 10.1016/j.neuroscience.2005.04.040. [DOI] [PubMed] [Google Scholar]
- Malmierca MS, Leergaard TB, Bajo VM, Bjaalie JG, Merchan MA. Anatomic evidence of a three-dimensional mosaic pattern of tonotopic organization in the ventral complex of the lateral lemniscus in cat. J Neurosci. 1998;18:10603–10618. doi: 10.1523/JNEUROSCI.18-24-10603.1998. [DOI] [PMC free article] [PubMed] [Google Scholar]
- Malmierca MS, Hernandez O, Falconi A, Lopez-Poveda EA, Merchan M, Rees A. The commissure of the inferior colliculus shapes frequency response areas in rat: an in vivo study using reversible blockade with micro-injection of kynurenic acid. Exp Brain Res. 2003;153:522–529. doi: 10.1007/s00221-003-1615-1. [DOI] [PubMed] [Google Scholar]
- Nataraj K, Wenstrup JJ. Roles of inhibition in creating complex auditory responses in the inferior colliculus: facilitated combination-sensitive neurons. J Neurophysiol. 2005 doi: 10.1152/jn.01152.2004. [DOI] [PubMed] [Google Scholar]
- Nelken I, Versnel H. Responses to linear and logarithmic frequency-modulated sweeps in ferret primary auditory cortex. Eur J Neurosci. 2000;12:549–562. doi: 10.1046/j.1460-9568.2000.00935.x. [DOI] [PubMed] [Google Scholar]
- O'Neill WE, Suga N. Encoding of target range and its representation in the auditory cortex of the mustached bat. J Neurosci. 1982;2:17–31. doi: 10.1523/JNEUROSCI.02-01-00017.1982. [DOI] [PMC free article] [PubMed] [Google Scholar]
- Oliver DL, Huerta MF. Inferior and superior colliculi. In: Webster DB, Popper AN, Fay RR, editors. The Mammalian Auditory System: Neuroanatomy. Springer-Verlag; New York: 1992. pp. 168–221. [Google Scholar]
- Palombi PS, Caspary DM. GABA inputs control discharge rate primarily within frequency receptive fields of inferior colliculus neurons. J Neurophysiol. 1996;75:2211–2219. doi: 10.1152/jn.1996.75.6.2211. [DOI] [PubMed] [Google Scholar]
- Park TJ, Pollak GD. GABA shapes a topographic organization of response latency in the mustache bat's inferior colliculus. J Neurosci. 1993a;13:5172–5187. doi: 10.1523/JNEUROSCI.13-12-05172.1993. [DOI] [PMC free article] [PubMed] [Google Scholar]
- Park TJ, Pollak GD. GABA shapes sensitivity to interaural intensity disparities in the mustache bat's inferior colliculus: implications for encoding sound location. J Neurosci. 1993b;13:2050–2067. doi: 10.1523/JNEUROSCI.13-05-02050.1993. [DOI] [PMC free article] [PubMed] [Google Scholar]
- Park TJ, Pollak GD. Azimuthal receptive fields are shaped by GABAergic inhibition in the inferior colliculus of the mustache bat. J Neurophysiol. 1994;72:1080–1102. doi: 10.1152/jn.1994.72.3.1080. [DOI] [PubMed] [Google Scholar]
- Pecka M, Zahn TP, Saunier-Rebori B, Siveke I, Felmy F, Wiegrebe L, Klug A, Pollak GD, Grothe B. Inhibiting the inhibition: a neuronal network for sound localization in reverberant environments. J Neurosci. 2007;27:1782–1790. doi: 10.1523/JNEUROSCI.5335-06.2007. [DOI] [PMC free article] [PubMed] [Google Scholar]
- Pollak GD, Casseday JH. The Neural Basis of Echolocation in Bats. Springer-Verlag; New York: 1986. [Google Scholar]
- Pollak GD, Park TJ. The effects of GABAergic inhibition on monaural response properties of neurons in the mustache bat's inferior colliculus. Hear Res. 1993;65:99–117. doi: 10.1016/0378-5955(93)90205-f. [DOI] [PubMed] [Google Scholar]
- Pollak GD, Winer JA, O'Neill WE. Perspectives on the functional organization of the mammalian auditory system: why bats are good models. In: Popper AN, Fay RR, editors. Hearing by Bats, Springer Handbook of Auditory Research. Vol. 11. Springer-Verlag; New York: 1995. pp. 481–498. [Google Scholar]
- Poon PW, Chiu TW. Similarities of FM and AM receptive space of single units at the auditory midbrain. Biosystems. 2000;58:229–237. doi: 10.1016/s0303-2647(00)00127-1. [DOI] [PubMed] [Google Scholar]
- Poon PW, Chen X, Hwang JC. Basic determinants for FM responses in the inferior colliculus of rats. Exp Brain Res. 1991;83:598–606. doi: 10.1007/BF00229838. [DOI] [PubMed] [Google Scholar]
- Portfors CV, Felix RA., 2nd Spectral integration in the inferior colliculus of the CBA/CaJ mouse. Neuroscience. 2005;136:1159–1170. doi: 10.1016/j.neuroscience.2005.08.031. [DOI] [PubMed] [Google Scholar]
- Portfors CV, Roberts PD, Jonson K. Over-representation of species-specific vocalizations in the awake mouse inferior colliculus. Neuroscience. 2009;162:486–500. doi: 10.1016/j.neuroscience.2009.04.056. [DOI] [PubMed] [Google Scholar]
- Priebe NJ, Ferster D. Direction selectivity of excitation and inhibition in simple cells of the cat primary visual cortex. Neuron. 2005;45:133–145. doi: 10.1016/j.neuron.2004.12.024. [DOI] [PubMed] [Google Scholar]
- Rall W. Time constants and electrotonic length of membrane cylinders and neurons. Biophys J. 1969;9:1483–1508. doi: 10.1016/S0006-3495(69)86467-2. [DOI] [PMC free article] [PubMed] [Google Scholar]
- Razak KA, Fuzessery ZM. Neural mechanisms underlying selectivity for the rate and direction of frequency-modulated sweeps in the auditory cortex of the pallid bat. J Neurophysiol. 2006;96:1303–1319. doi: 10.1152/jn.00020.2006. [DOI] [PubMed] [Google Scholar]
- Razak KA, Fuzessery ZM. Facilitatory mechanisms underlying selectivity for the direction and rate of frequency modulated sweeps in the auditory cortex. J Neurosci. 2008;28:9806–9816. doi: 10.1523/JNEUROSCI.1293-08.2008. [DOI] [PMC free article] [PubMed] [Google Scholar]
- Razak KA, Fuzessery ZM. GABA shapes selectivity for the rate and direction of frequency modulated sweeps in the auditory cortex. J Neurophysiol. 2009 doi: 10.1152/jn.00334.2009. [DOI] [PMC free article] [PubMed] [Google Scholar]
- Riquelme R, Saldana E, Osen KK, Ottersen OP, Merchan MA. Colocali-zation of GABA and glycine in the ventral nucleus of the lateral lemniscus in rat: an in situ hybridization and semiquantitative immunocytochemical study. J Comp Neurol. 2001;432:409–424. doi: 10.1002/cne.1111. [DOI] [PubMed] [Google Scholar]
- Ryan MJ. Frequency modulated calls and species recognition in a neotropical frog. J Comp Physiol A. 1983;150:217–221. [Google Scholar]
- Sanchez JT, Gans D, Wenstrup JJ. Contribution of NMDA and AMPA receptors to temporal patterning of auditory responses in the inferior colliculus. J Neurosci. 2007;27:1954–1963. doi: 10.1523/JNEUROSCI.2894-06.2007. [DOI] [PMC free article] [PubMed] [Google Scholar]
- Sanchez JT, Gans D, Wenstrup JJ. Glycinergic “inhibition” mediates selective excitatory responses to combinations of sounds. J Neurosci. 2008;28:80–90. doi: 10.1523/JNEUROSCI.3572-07.2008. [DOI] [PMC free article] [PubMed] [Google Scholar]
- Semple MN, Aitkin LM. Physiology of pathway from dorsal cochlear nucleus to inferior colliculus revealed by electrical and auditory stimulation. Exp Brain Res. 1980;41:19–28. doi: 10.1007/BF00236675. [DOI] [PubMed] [Google Scholar]
- Suga N. Analysis of frequency modulated sounds by auditory neurons of echolocating bats. J Physiol. 1965;179:26–53. doi: 10.1113/jphysiol.1965.sp007648. [DOI] [PMC free article] [PubMed] [Google Scholar]
- Suga N. Analysis of frequency-modulated and complex sounds by single auditory neurons of bats. J Physiol. 1968;198:51–80. doi: 10.1113/jphysiol.1968.sp008593. [DOI] [PMC free article] [PubMed] [Google Scholar]
- Suga N. Feature extraction in the auditory system of bats. In: Moller AR, editor. Basic Mechanisms in Hearing. Academic Press; New York: 1973. pp. 675–744. [Google Scholar]
- Suga N, Schlegel P. Coding and processing in the auditory systems of FM-signal-producing bats. J Acoust Soc Am. 1973;54:174–190. doi: 10.1121/1.1913561. [DOI] [PubMed] [Google Scholar]
- Suga N, O'Neill WE, Kujirai K, Manabe T. Specificity of combination-sensitive neurons for processing of complex biosonar signals in auditory cortex of the mustached bat. J Neurophysiol. 1983;49:1573–1626. doi: 10.1152/jn.1983.49.6.1573. [DOI] [PubMed] [Google Scholar]
- Suta D, Kvasnak E, Popelar J, Syka J. Representation of species-specific vocalizations in the inferior colliculus of the guinea pig. J Neurophysiol. 2003;90:3794–3808. doi: 10.1152/jn.01175.2002. [DOI] [PubMed] [Google Scholar]
- Vater M, Covey E, Casseday JH. The columnar region of the ventral nucleus of the lateral lemniscus in the big brown bat (Eptesicus fuscus): synaptic arrangements and structural correlates of feedforward inhibitory function. Cell Tissue Res. 1997;289:223–233. doi: 10.1007/s004410050869. [DOI] [PubMed] [Google Scholar]
- Voytenko SV, Galazyuk AV. Intracellular recording reveals temporal integration in inferior colliculus neurons of awake bats. J Neurophysiol. 2007;97:1368–1378. doi: 10.1152/jn.00976.2006. [DOI] [PubMed] [Google Scholar]
- Wang X, Merzenich MM, Beitel R, Schreiner CE. Representation of a species-specific vocalization in the primary auditory cortex of the common marmoset: temporal and spectral characteristics. J Neurophysiol. 1995;74:2685–2706. doi: 10.1152/jn.1995.74.6.2685. [DOI] [PubMed] [Google Scholar]
- Wenstrup J, Leroy SA. Spectral integration in the inferior colliculus: role of glycinergic inhibition in response facilitation. J Neurosci. 2001;21:RC124. doi: 10.1523/JNEUROSCI.21-03-j0002.2001. [DOI] [PMC free article] [PubMed] [Google Scholar]
- Winer JA, Larue DT, Pollak GD. GABA and glycine in the central auditory system of the mustache bat: structural substrates for inhibitory neuronal organization. J Comp Neurol. 1995;355:317–353. doi: 10.1002/cne.903550302. [DOI] [PubMed] [Google Scholar]
- Xie R, Meitzen J, Pollak GD. Differing roles of inhibition in hierarchical processing of species-specific calls in auditory brainstem nuclei. J Neuro-physiol. 2005;94:4019–4037. doi: 10.1152/jn.00688.2005. [DOI] [PubMed] [Google Scholar]
- Xie R, Gittelman JX, Pollak GD. Rethinking tuning: in vivo whole-cell recordings of the inferior colliculus in awake bats. J Neurosci. 2007;27:9469–9481. doi: 10.1523/JNEUROSCI.2865-07.2007. [DOI] [PMC free article] [PubMed] [Google Scholar]
- Xie R, Gittelman JX, Li N, Pollak GD. Whole cell recordings of intrinsic properties and sound-evoked responses from the inferior colliculus. Neuroscience. 2008;154:245–256. doi: 10.1016/j.neuroscience.2008.02.039. [DOI] [PubMed] [Google Scholar]
- Yang L, Pollak GD, Resler C. GABAergic circuits sharpen tuning curves and modify response properties in the mustache bat inferior colliculus. J Neuro-physiol. 1992;68:1760–1774. doi: 10.1152/jn.1992.68.5.1760. [DOI] [PubMed] [Google Scholar]
- Yue Q, Casseday JH, Covey E. Response properties and location of neurons selective for sinusoidal frequency modulations in the inferior colliculus of the big brown bat. J Neurophysiol. 2007;98:1364–1373. doi: 10.1152/jn.00432.2007. [DOI] [PubMed] [Google Scholar]
- Zhang LI, Tan AY, Schreiner CE, Merzenich MM. Topography and synaptic shaping of direction selectivity in primary auditory cortex. Nature. 2003;424:201–205. doi: 10.1038/nature01796. [DOI] [PubMed] [Google Scholar]