Abstract
This study describes the use of spectral fingerprints acquired by flow injection(FI)-MS and multivariate analysis to differentiate three Panax species: P. ginseng, P. quinquefolius, and P. notoginseng. Data were acquired using both high resolution and unit resolution MS, and were processed using principal component analysis (PCA), soft independent modeling of class analogy (SIMCA), partial least squares-discriminant analysis (PLS-DA), and a fuzzy rule-building expert system (FuRES). Both high and unit resolution MS allowed discrimination among the three Panax species. PLS-DA and FuRES provided classification with 100% accuracy while SIMCA provided classification accuracies of 77 and 88% by high- and low-resolution MS, respectively. The method does not quantify any of the sample components. With FI-MS, the analysis time was less than 2 min.
Plants of the genus Panax, collectively referred to as “ginseng,” have been used for thousands of years as a traditional medicine in many countries (1). Although there are approximately 14 species of these slow-growing perennial plants, P. ginseng C.A. Meyer (Asian ginseng), P. quinquefolius L. (American ginseng), and P. notoginseng are the most commonly used and studied (2). These three species grow wild and are cultivated in different geographical regions. While authentication of each species is traditionally based on morphological and histological examination, chemical authentication is becoming increasingly important since many products are in a powdered or liquid form.
P. ginseng is used extensively in traditional Chinese medicine. It is prepared as either white ginseng, obtained by simply sun-drying the roots, or red ginseng, obtained by processing the roots with steam, followed by artificial drying and sun-drying to yield a glassy red product (3). P. quinquefolius L. (American ginseng) was originally found only in North America and is usually smaller than P. ginseng. It has been used by Native Americans for medicinal purposes (1). Ginseng is used mainly to increase resistance to physical, chemical, and biological stress, and to boost general vitality. In vitro studies and clinical trials show that immune system modulation, antistress activities, and antihyperglycemic activities are among the most notable features of ginseng (1). P. notoginseng (notoginseng), also known as “Sanqi,” is a well-known Chinese medicinal plant that is effective in restoring hemostasis, nourishing the blood, and treating coronary thrombosis (4). Today, all three species are grown on many continents.
The widespread use of ginseng root has led to the development of a wide spectrum of analytical methods for ensuring quality, efficacy, and consumer safety (5–23). In general, the focus of these methods has been on quantification of the ginsenosides, which are considered the active components and are the most commonly used index for ginseng product evaluation. The method of choice is HPLC, and more recently, ultra-HPLC (UHPLC), with detection by FTIR spectroscopy, FT-near-IR (FT-NIR) spectroscopy, UV absorption, evaporative light scattering, or MS. Although MS detection is superior to the other detection methods in terms of specificity and sensitivity, it is more expensive and has poorer precision. The separation process is usually the rate-limiting step.
Identification, authentication, and differentiation do not necessarily require quantification of specific compounds in the samples. These processes can be implemented by examining the patterns arising from the chemical composition of the samples. The more components used, the more robust the method. Two commonly used methods for obtaining chemical patterns are chromatographic and spectral fingerprinting coupled with multivariate analysis. With chromatographic fingerprinting, the entire chromatogram is treated as an image, and images are acquired for all the samples and compared. The major drawback is that multivariate methods require careful alignment of the images. Hence, retention time alignment programs are necessary. This problem is avoided by using spectral fingerprinting, which requires no prior separation. The normal spectral reproducibility for most instruments is sufficient without any special measures. Flow injection (FI)-MS method could save time because no HPLC/UHPLC method development is necessary. It also saves analytical time, analytical columns, solvents, and manpower.
A major advantage of MS is the ability to identify specific compounds, even when spectral fingerprinting is used. We recently compared the use of IR and NIR spectral fingerprints (acquired from solids) and UV and MS spectral fingerprints (acquired from extracts of the solids) for differentiation between two cultivars of broccoli grown with seven different treatments (four levels of Se, organically, and conventionally, with two levels of irrigation; 24, 25). The data were processed using analysis of variance-principal component analysis (ANOVA-PCA). All five methods (MS spectra were acquired with both positive and negative ionization) provided excellent discrimination between the two cultivars and the seven treatments. Both ANOVA and PCA loadings were used to identify spectral components key to differentiation. For MS, these key components were specific ions that were identified as amino acids, organic acids, and sugars and their isomers. This information was not available from IR, NIR, and UV because of their lack of specificity.
Multivariate analysis programs are used for pattern recognition and are especially useful when the number of variables (wavelengths, wavenumbers, or masses) exceeds the number of samples. They are generally classified as unsupervised, e.g., PCA; or supervised, e.g., soft independent modeling of class analogy (SIMCA); partial least squares-discriminant analysis (PLS-DA); and fuzzy rule-building expert systems (FuRES). PCA simply computes the principal components for the data set and allows easy visual examination of the resultant score plots for patterns. There is no a priori identification of classes. Conversely, SIMCA, PLS-DA, and FuRES use training sets to develop models that are used to predict the classes of unknown samples. Validation of the models is achieved by randomly dividing the samples between the training set and the unknown samples, building a model, and evaluating the accuracy of the model for the unknown samples. This process is repeated many times with different, random distributions of samples in the model building and prediction sets using bootstrapped Latin partitions. This approach provides a generalized estimate of precision as opposed to relying on a single configuration of the training set and prediction set.
In this study, we describe the use of spectral fingerprints, acquired by FI-MS, and multivariate analysis as a fast and effective way to differentiate P. ginseng, P. quinquefolius, and P. notoginseng. Data were acquired using both a high-resolution MS (Exactive, Thermo Fisher Scientific, Inc., Waltham, MA) and a unit-resolution MS (LCQ, Thermo Fisher Scientific, Inc.). Data were initially processed using PCA to determine the ability of the method to discriminate among the species and to identify, through the loadings, those spectral features key to discrimination. Of particular interest was the utility of ginsenosides and non-ginsenosides in discrimination. Data were then processed by SIMCA, PLS-DA, and FuRES to determine the method’s ability to accurately classify the different species.
Experimental
Reagents
Water.—Optima grade (Thermo Fisher Scientific Inc.).
Acetonitrile.—Optima grade (Thermo Fisher Scientific Inc.)
Methanol.—Optima grade (Thermo Fisher Scientific Inc.)
Formic acid.—MS grade (Sigma Aldrich, St. Louis, MO).
Ginsenoside Rb2 (>95% purity).—ChromaDex Inc., Irvine, CA.
HPLC mobile phase.—Mobile phase A is 0.1% formic acid in water; mobile phase B is 0.1% formic acid in acetonitrile.
Samples
For this study, 44 P. quinquefolius, 12 P. ginseng, and four P. notoginseng samples were obtained or purchased (Table 1). Only red P. ginseng samples were used in the study because authentic white P. ginseng without bleaching was not available. American Herbal Pharmacopoeia confirmed that its white P. ginseng samples were treated with sulfite to bleach them prior to drying.
Table 1.
Ginseng sample list
| Species | No. of samples | Label | Obtained from | Source |
|---|---|---|---|---|
| P. quinquefolius | 28 | American Ginseng | Ginseng Board of Wisconsina | USA |
| 15 | American Ginseng | American Herbal Pharmacopoeiab | USA | |
| 6 | American Ginseng | Internet (Wisconsin farm) | USA | |
| 2 | American Ginseng | Internet (Canadian farm) | Canada | |
| 1 | American Ginseng | Ginseng Board of Wisconsin | China | |
| P. ginseng | 5 | Asian Ginseng | American Herbal Pharmacopoeia | China |
| 5 | Asian Ginseng | Internet Retailer | China | |
| 1 | Asian Ginseng | Ginseng Board of Wisconsin | China | |
| 1 | Asian Ginseng | Personal purchase (China) | China | |
| P. notoginseng | 4 | Notoginseng | American Herbal Pharmacopoeia | China |
Ginseng Board of Wisconsin, Wausau, WI.
American Herbal Pharmacopoeia, Scotts Valley, CA.
Apparatus
Exactive MS system.—Accela high speed LC (Thermo Fisher Scientific Inc.) consisted of a quaternary pump with a vacuum degasser, a thermostatted column compartment, and autosampler. The HPLC system is coupled with an Exactive mass spectrometer (Thermo Fisher Scientific Inc.).
LC/MS system.—Agilent 1100 HPLC system (Agilent Technologies, Palo Alto, CA) consisted of a binary pump with a vacuum degasser, a thermostatted column compartment, an autosampler, and a diode array detector. The HPLC system is coupled with an LCQ Classic ion-trap mass spectrometer (Thermo Fisher Scientific Inc.).
Centrifuge.—IEC Clinical Centrifuge (Danon/IEC Division, Needham Heights, MA).
LC conditions.—The HPLC/UV/MS method used a mobile phase consisting of 0.1% formic acid in H2O (A) and 0.1% formic acid in acetonitrile (B) with isocratic elution at 60:40 (v/v) for 1.5 min. The flow rate was 0.5 mL/min. A guard column (Adsorbosphere All-Guard Cartridge, C18, 5 µm, 4.6 × 7.5 mm, Alltech Associates, Inc., Deerfield, IL) was used to minimize the potential contamination for the MS system.
MS conditions.—Electrospray ionization (ESI) was performed in negative ion mode to obtain the mass spectral fingerprints. The parameters of both mass spectrometers were optimized for ginsenoside Rb2 (m/z 1077.60, M-H) by auto-tune, using the Xcalibur software through infusion of ginsenoside Rb2 standard. For the Exactive MS, the following conditions were used: spray voltage, −4.0 kV; capillary temperature, 275°C; sheath gas, 50 (arb. units); aux gas, 15 (arb. units); spare gas, 5 (arb. units); maximum spray current, 100 µA; heater temperature, 365°C. For the LCQ MS: spray voltage, −4.0 kV; capillary temperature, 275°C; sheath gas, 80; aux gas, 10; heated capillary temperature, 220°C
Sample Preparation
Ginseng root samples were ground into fine powders and stored in desiccators. For each dried ground sample, 300 mg was mixed with 10 mL methanol–water (60 + 40, v/v) in 15 mL centrifuge tubes and sonicated for 60 min at room temperature. The extracted samples were centrifuged at 5000 × g for 15 min. The supernatant was filtered through a 17 mm (pore size 0.45 µm) PVDF syringe filter (VWR Scientific, Seattle, WA). For all samples, 5 µL of the extract was injected.
Data Acquisition
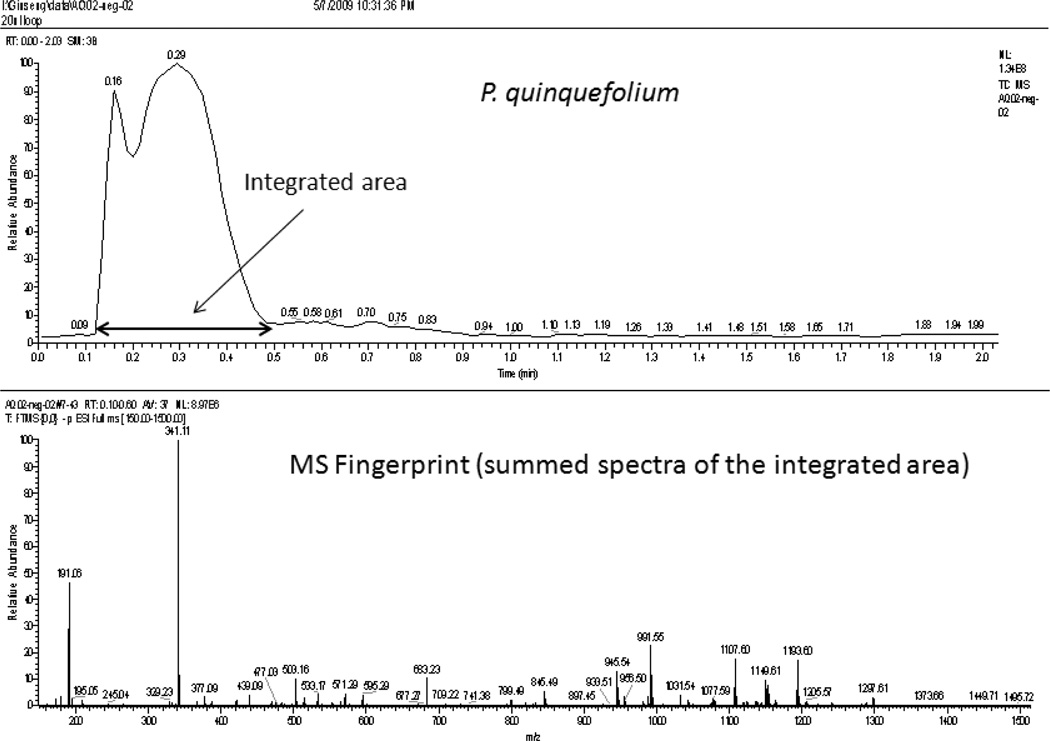
Spectral fingerprints were obtained in the negative ion mode using flow injection ESI/MS. Spectra were summed for a 0.5 min interval that covered the sample peak (Figure 1) as measured using the total ion current. The interval was from 0.1 to 0.6 min for the Exactive MS and 0.5 to 1.0 min for the LCQ MS. Three repeat analyses of the 68 different samples using the Exactive MS provided 204 spectra; five repeat analyses of the 68 different samples using the LCQ MS provided 340 spectra. Data were acquired from m/z 150 to 1500 for both MS analyses.
Figure 1.
Typical mass spectral fingerprint of P. quinquefolius from the Exactive MS.
Data Processing
The spectral fingerprint of each sample is a vector (ion counts with respect to mass-to-charge ratio for a range of m/z 150 to 1500). The spectra were exported with unit mass resolution to Excel (Microsoft, Inc., Bellevue, WA), combining the 204 spectra for the Exactive MS into one spreadsheet and 340 spectra for the LCQ MS into one spreadsheet, respectively. Sorting the data by sample names, and aligning the masses (each spectrum contains different numbers of ions since not all masses appear in each spectrum), resulted in two data matrixes, 204 × 1136 (samples × mass measurements) for the Exactive MS, and 340 × 1301 for the LCQ MS. The data matrixes were exported to Solo (Eigenvector Research, Inc., Wenatchee, WA) for PCA and to MATLAB (The MathWorks, Inc., Natick, MA) for SIMCA, PLS-DA, and FuRES.
All calculations were performed with the 64 bit version of MATLAB 2010a (version 7.10) with the Optimization Toolbox (version 5.0). The software was executed on a homebuilt Intel Core i7–860 Lynnfield 2.93 GHz LGA 1156 Quad Core processor computer equipped with four GBs of DDR3 RAM that operated under MS Windows 7 (version 6.1) 64 bit Enterprise version.
Analysis of Variance
The use of ANOVA-PCA method to compute relative variance for each of the experimental factors has been previously described (24, 25). Briefly, for each of the data matrixes (DMs) described above, we constructed a grand means matrix (GMM) by filling in each variable with the average for all the samples. The GMM was subtracted from the DM to provide the grand means residuals matrix (GMRM). The GMRM is also known as the mean centered matrix. The species mean matrix (SMM) was constructed from the GMRM by filling in each object with the average object for the species. The SMM was subtracted from the GMRM to give the species means residual matrix (SMRM). The run mean matrix (RMM) was constructed from the SMRM by filling in each object with the average of the three repeat analyses for each sample. This factor is called the RMM because a complete set of samples was run randomly on five different days and characterizes variations with time. The run mean residuals matrix (RMRM) was obtained by subtracting the RMM from the SMRM.
The sum of the squares of the GMRM is the total variance for the data set; the sum of squares for the SMM is the between-species variance; the sum of squares for the SMRM is the within-species variance; the sum of squares for the RMM is the between-run variance; and the sum of squares for the RMRM is the within-run variance. The within-run variance provides the analytical uncertainty. The between- and within-species variances are used to compute the F value for the species means in the conventional manner.
Classification Methods
SIMCA.—A home-built SIMCA script was written for MATLAB. Each class of training data was processed separately. The data for the class model were mean-centered, and principal components were calculated using the SVDS function in MATLAB. A first-order model (single principal component) was used for all the evaluations, models with additional orders were systematically investigated. Confidence limits for each model were based on the Hotelling T2 and the Q statistic (26). The Hotelling T2 statistic is the multidimensional equivalent of Student’s t statistic. It characterizes the multivariate standardized variance of an object from the model, whereas the Q statistic characterizes the lack-of-fit of a data object to the model by the residual variance.
PLS-DA.—A home-built PLS2 script was written that is described in detail (27). The algorithm divides the training data into two Latin partitions for which the results are pooled for each of 10 bootstraps. The average prediction error with respect to component number is calculated for the 10 bootstraps. The number of latent variables in the PLS model is determined by the minimum of the average prediction error.
FuRES.—A home-built FuRES classifier was written that is described in detail (28). FuRES builds classification trees and has no adjustable parameters such as the number of components or latent variables of SIMCA and PLS. FuRES uses a divide-and-conquer algorithm to construct rules that minimize the fuzzy entropy of classification. The degree of fuzziness is selected that maximizes the first derivative of the fuzzy entropy with respect to the rule temperature. This constraint speeds up the optimization, reduces local minima, and furnishes robust and reproducible multivariate rules.
Validation.—Generalized validation was accomplished using bootstrapped Latin partitions (29, 30). This method characterizes a key source of variation, which is the partitioning of the data into prediction and calibration sets. Confidence intervals can be obtained by bootstrapping that characterizes the reproducibility of the method and allows statistical comparisons to be made among the different methods. Latin partitions randomly divide the data into equally sized subsets for which the class distributions are the same. Each partition is used once for prediction while the others are used for calibration. The prediction results of the partitions are pooled. The procedure is repeated several times and the average prediction results are reported with confidence intervals.
Accuracy.—The percent accuracy summarizes the sensitivity (percent of positives correctly identified, e.g., the percent of P. notoginseng correctly classified as P. notoginseng) and specificity (percent of negatives correctly identified, e.g., percent of non-P. notoginseng samples correctly classified as non-P. notoginseng).
Results and Discussion
Sample Preparation
Historically, quantification of ginsenosides has been used to discriminate among the ginseng species. Many different methods have been studied for this purpose: heating (21–23, 31), sonication (22, 31, 32), supercritical fluids (31, 32), microwaving (31–34), and enzymatic digestion (35). Refluxing with 100% methanol at 60–65°C for 1 h gave the highest yield of neutral ginsenosides (20). But although the use of heat may improve the total yield of ginsenosides, it will also degrade the thermally unstable malonyl-ginsenosides into the corresponding neutral ginsenosides (36). Literature reports indicate that sonication with alcohol (methanol or ethanol) and water at room temperature is optimal for the extraction of both neutral and acidic ginsenosides (21,23,37). Because the only requirement for fingerprinting is that all samples be extracted in the same manner, sonication with methanol/water (see Experimental section) was chosen as the method of extraction for the current study.
Flow Injection
The method developed in this study was intended to chemically differentiate the three Panax species in minutes without chromatography. No analytical column was used for the method. Samples were injected into the MS system using standard HPLC sample injectors through a C18 reversed-phase guard column. The guard column served primarily as an in-line filter and provided little separation. The total ion chromatogram produced by injection of the sample gave a broad peak (total ion count) that was about 0.5 min wide (Figure 1). Mass spectral scans were integrated over the 0.5 min interval to yield a single spectrum (fingerprint).
MS Fingerprints of Panax Species
Data were acquired using two mass spectrometers, the high-resolution Exactive MS, and the unit-resolution LCQ MS. Data from the Exactive MS systems were initially processed in two formats: high-resolution, with masses reported to four decimal places; and unit mass after rounding the data to the nearest mass (i.e., binning into unit mass bins). Similar results were obtained regardless of the data format. However, the high-resolution data matrix was relatively unwieldy and slower to process because of its larger size. Consequently, all the results presented in this report (including the LCQ MS) are based on unit resolution mass spectral data.
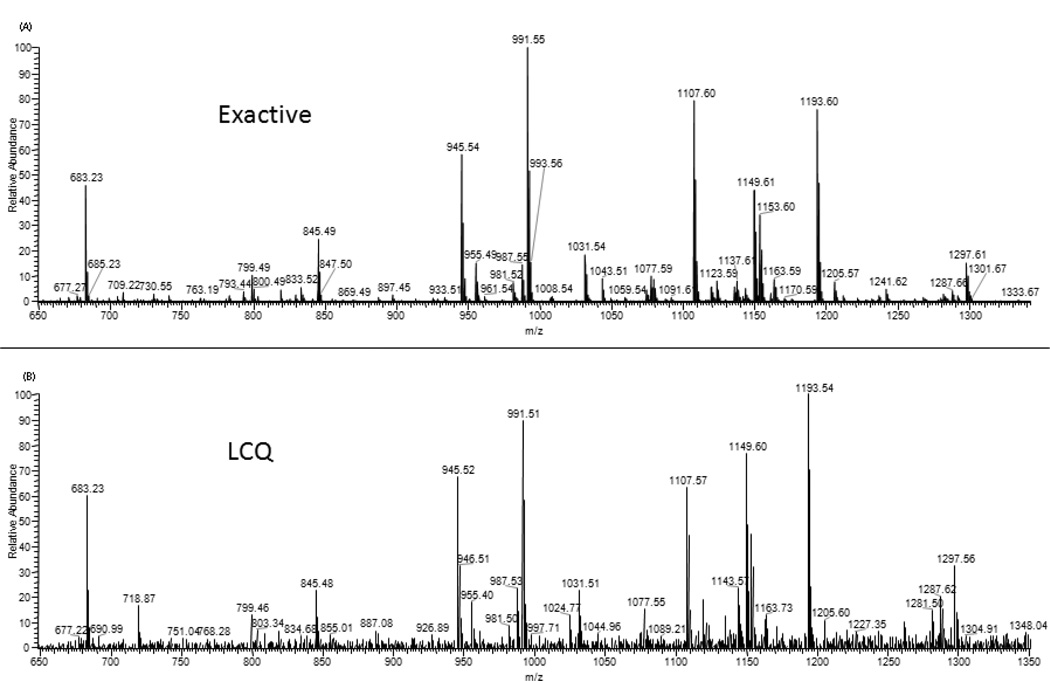
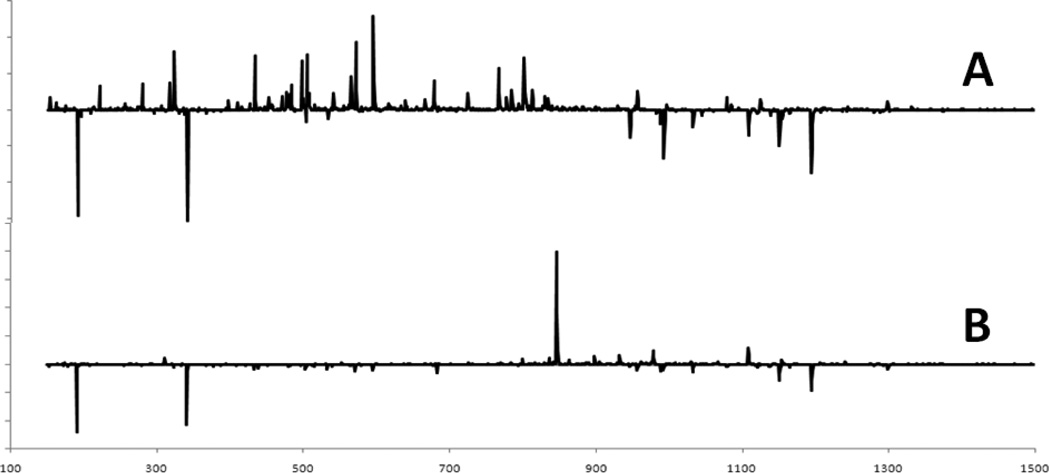
Typical MS fingerprints obtained for P. quinquefolius using the Exactive and LCQ are shown in Figure 2 (the region of m/z 650–1350 is shown for the details of the ion-rich region; a full spectrum is shown in Figure 1). The same major masses are observed by both systems, but with different relative counts. The differences are not surprising because the two instruments have different ESI and ion optic designs, and the LCQ MS is 10 years older.
Figure 2.
Comparison of mass spectra of P. quinquefolius obtained from (A) the Exactive MS and (B) the LCQ MS (m/z 650–1350).
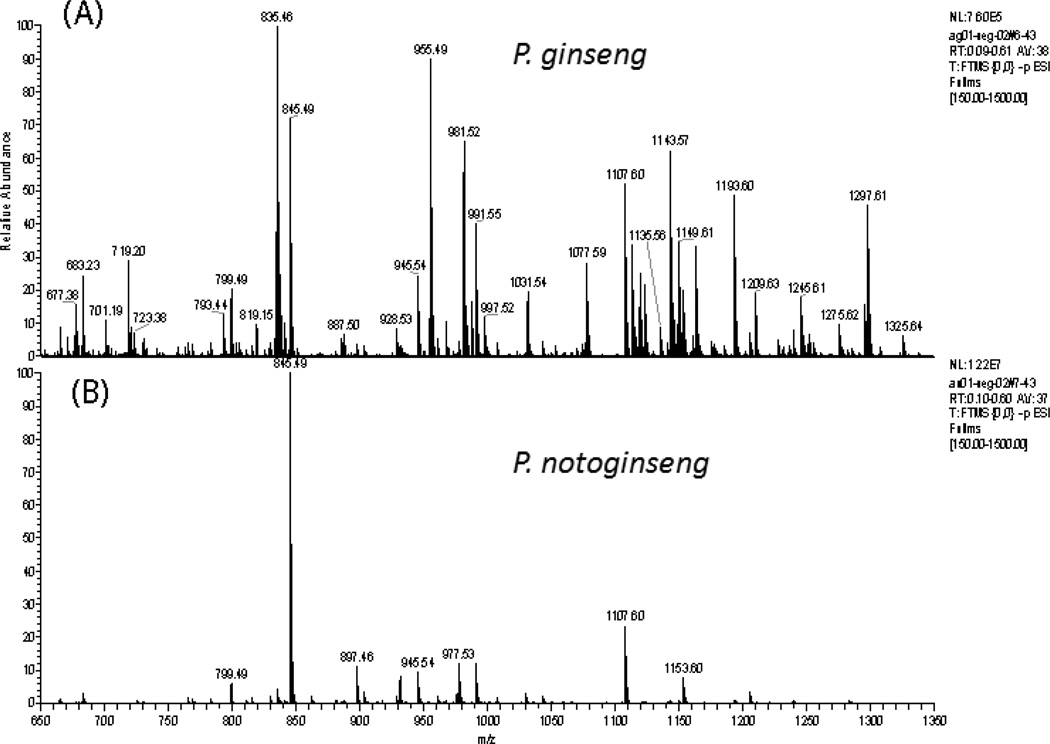
Fingerprints for P. ginseng and P. notoginseng acquired using the Exactive MS are shown in Figure 3. Although the fingerprints appear very different, common masses can be seen for all three ginseng species (Figures 2 and 3). Despite the fact that no chromatographic separation was performed, many ginsenosides can be detected in the spectra. This is not surprising since both MS were optimized for Rb2 at m/z 1077.60. However, the fingerprints also feature nonginsenoside ions (Figure 1). Table 2 lists some of the most prominent ginsenosides and nonginsenoside ions observed for all three species and provides their identification where possible.
Figure 3.
Comparison of mass spectra of P. ginseng and P. notoginseng (data acquired using the Exactive MS m/z 650–1350).
Table 2.
Important peaks from MS fingerprints and PCA loadings
| PCA loadings |
||||
|---|---|---|---|---|
| m/z | Compound | Ion | PC1 | PC2 |
| 191.06 | Quinic acid | M-H | X | X |
| 341.11 | Dihexosides | M-H | X | X |
| 503.16 | Trihexosides | M-H | x | x |
| 571.29 | Unidentified | x | x | |
| 595.29 | Unidentified | X | x | |
| 683.23 | Rh | M-H+HCOOH | − | x |
| 799.49 | Rf/Rg1/24(R)-pseudo-ginsenoside F11 | M-H | − | x |
| 845.49 | Rf/Rg1/24(R)-pseudo-ginsenoside F11 | M-H+HCOOH | − | X |
| 945.54 | Rd/Re | M-H | x | − |
| 955.49 | Ro | M-H | x | x |
| 991.55 | Rd/Re | M-H+HCOOC | x | x |
| 1031.55 | Malony Rd | M-H | x | x |
| 1077.59 | Rb2/Rb3/Rc | M-H | x | x |
| 1107.59 | Rb1 | M-H | x | x |
| 1149.61 | Malonyl Rb1 | M-CO2-H | x | x |
| 1153.60 | Rb1 | M-H+HCOOH | x | x |
| 1163.59 | Malonyl Rb2/Rb3/Rc | M-H | x | − |
| 1193.60 | Malonyl Rb1 | M-H | x | x |
| 1209.63 | Ra1/Ra2 | M-H | x | − |
P. notoginseng (Figure 3B) is readily identified by the high counts at m/z 845.49 for Rf/Rg1/24(R)-pseudo-ginsenoside F11. However, the spectra for both P. quinquefolius and P. ginseng (Figure 3A) were dominated by nonginsenosides; citrate (m/z 191.02) and dihexosides (m/z 341.11) dominated the P. quinquefolius spectra and the dihexosides (m/z 341.11); and an unidentified ion at m/z 377.09 dominated the P. ginseng spectra. In addition to the ginsenoside at m/z 845.49, P. notoginseng also had higher counts for ginsenosides at m/z 945.54, 991.55, 1107.60, and 1153.60. P. quinquefolius had higher counts for ginsenosides at m/z 945.54, 991.55, 1107.60, 1149.61, and 1193.60. P. ginseng had higher counts for m/z 845.49, 955.49, 1107.60, 1163.59, and 1209.63. These ions are identified in Table 2.
Three nonginsenosides were identified: quinic acid (m/z 191.06), dihexosides (m/z 341.11), and trihexosides (m/z 503.16). All three can be seen for all three species, but the trihexosides are not as prevalent as the other two.
Principal Component Analysis
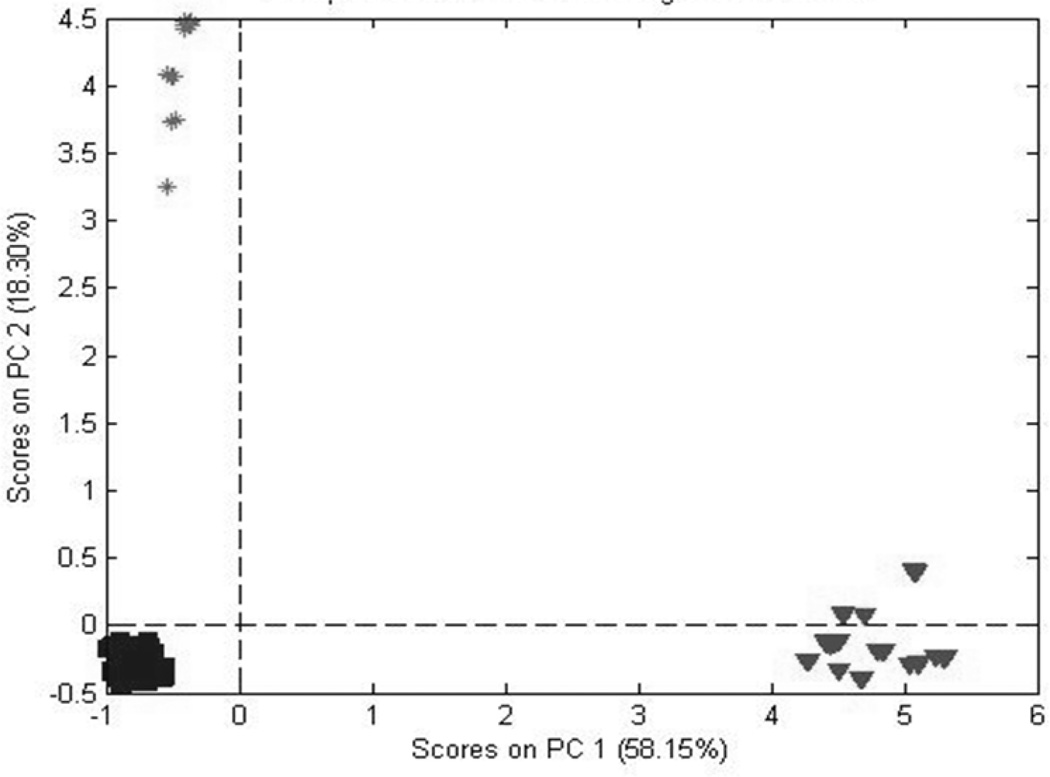
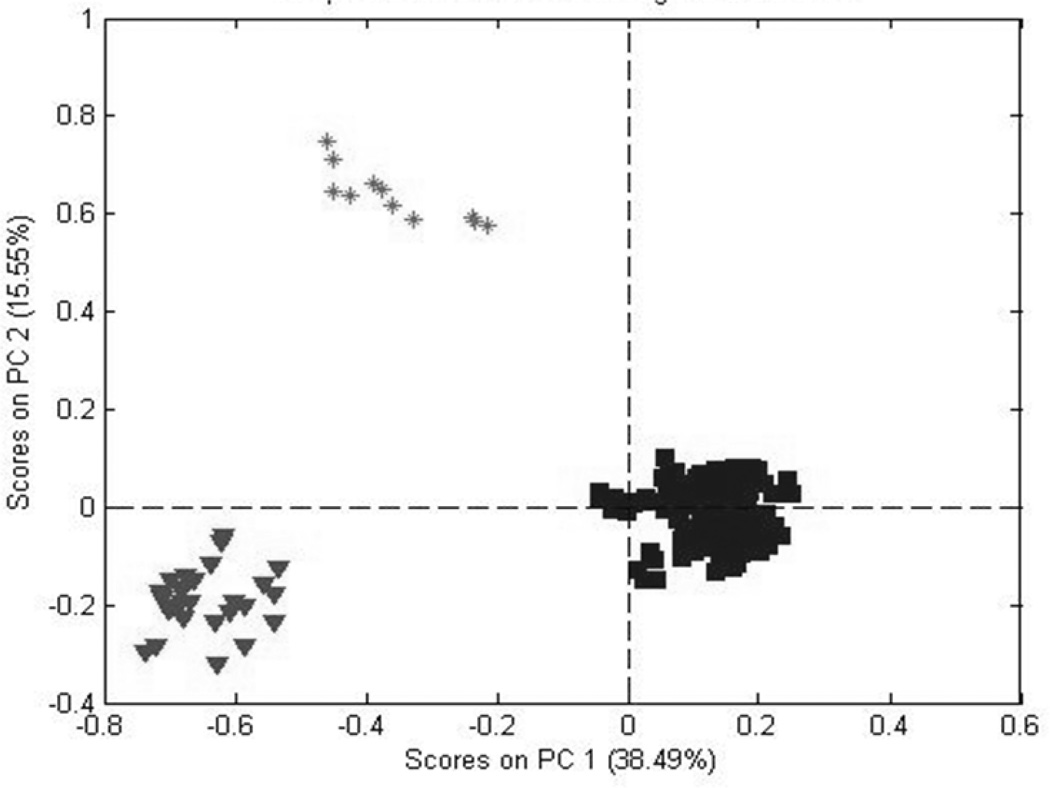
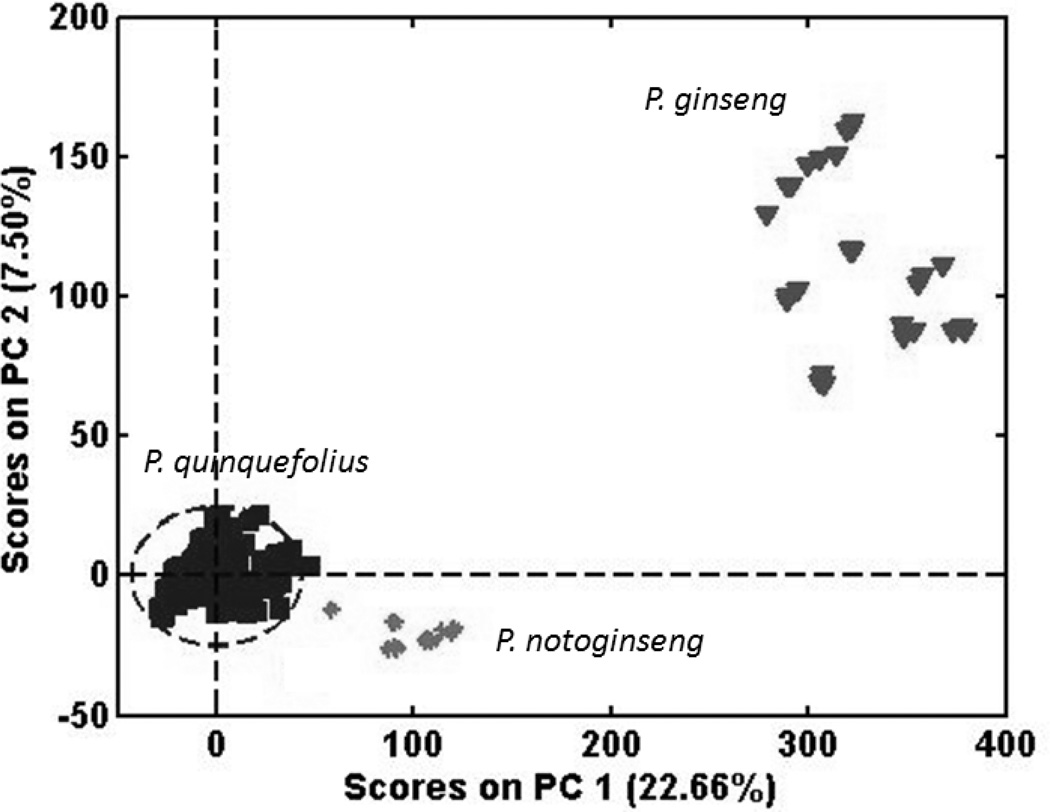
Figures 4 and 5 are PCA score plots for the first two principal components (PCs) for the Exactive and LCQ MS, respectively. The two plots are very similar, although the plot for the Exactive MS provides slightly tighter, more distinct clusters. For the Exactive MS, the first two PCs account for 76% of the variability in the data set, compared to 54% for the LCQ MS. These values indicate a greater noise component for the LCQ MS, as discussed in the previous section. These plots indicate that both MS systems can easily discriminate among the three Panax species.
Figure 4.
PCA scores based on data from all three species (data acquired using the Exactive MS).
Figure 5.
PCA scores based on data from all three species (data acquired using the LCQ MS).
The data for the PCA scores in Figures 4 and 5 were scaled using the square root of the mean (SQRM) for each variable. Alternatives were no scaling, group scaling, or autoscaling (scaling with the SD of the variable). With no scaling, PCA places the greatest emphasis on the peaks with the highest counts. This emphasis is decreased with group scaling (scaling by the SD of all the variables), further diminished by SQRM scaling, and largely negated with autoscaling (scaling by the SD of the variable). However, autoscaling introduces additional noise into the calculation, especially for peaks with low counts since the SD may be larger than the peak counts. Scaling can be arbitrary. For this study, we elected to use SQRM scaling.
Figure 6 presents the loadings for PC1 and PC2. The loadings are the coefficients computed for each variable. The most positive and negative coefficients indicate a high significance in determining the positions of the samples on that axis. The three highest loadings (positive or negative) for each PC are shown in Table 2 by a bold, upper case X. Less significant loadings that exceed the baseline variation are indicated by a nonbold, lower case x.
Figure 6.
Variable loadings for PC1 for the Exactive MS: (A) with no scaling, (B) with SQRM scaling.
More ions contribute to the PC1 scores (Figure 6) than to PC2. Mathematically, PC1 captures more of the sample variance than PC2. As expected, m/z 845.49 is strong contributor to separation of the clusters on PC2 (Table 2). The nonginsenoside ions at m/z 191.02, 341.11, and 595.29 are the other most significant contributors. In general, all the ginsenosides have loadings that contribute to discrimination between species as do the more intense non-ginsenoside ions.
ANOVA
ANOVA tests for the equivalence of the means for multiple populations using a single variable. In this case, the variable is the mass spectra (24, 25). For the Exactive MS, the relative variances between species, within species, between runs, and within runs (analytical uncertainty) were 64.7, 34.7, 0.1, and 0.6%. The F test was highly significant, providing a probability ≤0.0001 that the means of the three species were the same. For the LCQ MS, these values were 41.6, 36.6, 6.0, and 15.8%. Again, the probability was ≤0.0001 that the spectra were equal. The difference in the between-run means and the analytical uncertainties shows that the Exactive MS out-performed the older LCQ MS. The between-species variance was considerably less for the LCQ MS (the older system), explaining the better separation of the clusters observed for the Exactive MS in Figure 4.
Supervised Modeling
The excellent separation of the three species in Figures 4 and 5 by unsupervised PCA suggests that supervised modeling using SIMCA, PLS, or FuRES (27, 28) should be successful. SIMCA applies a PCA model to each of the specified classes and establishes the distance between the model vectors. PLS-DA and FuRES are more sophisticated classification methods based on linear regression and neural networks, respectively. The number of components for PLS-DA were determined by using bootstrap Latin partitions to divide the training data into two sets randomly and averaging the pooled results across 10 bootstraps. The number of components with the lowest prediction error are selected. FuRES is a parameter free classification method which does not require this additional step. All three methods were validated with independent test sets (29, 30).
The results for the classification methods are shown in Table 3 for identification of the three ginseng species. The results are presented as percent accuracy, which reflects both sensitivity (i.e., ability to accurately classify P. ginseng samples as P. ginseng) and specificity (i.e., ability to not classify P. notoginseng samples as P. ginseng), and the SD for the repeat validations. The percent accuracy was 100% for PLS-DA and FuRES for both MS systems. The SIMCA method, however, performed less well, providing only 77 and 88% accuracy for the Exactive MS and LCQ MS, respectively, using a single component model. Use of more components yielded lower accuracies. SIMCA did ton work well because the covariance within each class did not correspond to the variances among the classes.
Table 3.
Percent accuracy for SIMCA, PLS-DA, and FuRES for identification of the three ginseng species
| Method | No. of samples | SIMCA | PLS-DA | FuRES |
|---|---|---|---|---|
| MS-EX | 204 | 77.4 ± 1.8% | 100.0 ± 0.0% | 100.0 ± 0.0% |
| MS-LCQ | 340 | 88.1 ± 1.2% | 100.0 ± 0.0% | 99.9 ± 0.3% |
SIMCA applies a PCA model to each class of samples. Because each model is based only on the characteristics of the samples in that class, as opposed to the characteristics of all the samples, the separation of the classes may be worse when projected onto the SIMCA component than when the covariances of all the classes are modeled by PCA. Figure 7 shows the principal component scores of the P. quinquefolius spectra from the Exactive MS. It can be seen that all the P. notoginseng and P. ginseng samples lie outside the 95% confidence limit (Hotelling T2). Statistically, some of the P. quinquefolius samples also lie outside the 95% confidence limit. The P. notoginseng and P. ginseng samples lie much closer to the P. quinquefolius cluster than they did in Figure 4 because the principal components are not characterizing the variances of the other two samples.
Figure 7.
PCA scores for the Exactive MS based on a PCA model for P. quinquefolius
Conclusions
This study demonstrates that spectral fingerprints obtained from FI-MS provides a simple, fast, and economical method for differentiating P. quinquefolius, P. ginseng, and P. notoginseng. This method nicely complements the more rigorous and lengthy chromatographic methods traditionally used for a full metabolomic analysis. MS fingerprinting with multivariate analysis is very sensitive to differences in chemical composition. The method was shown to work with both old and new mass spectrometers so that it can be used without an expensive investment in a newer high-resolution mass spectrometer. The emphasis is now on identifying the compounds and documenting the histories of the materials that give rise to the chemical differences.
Acknowledgments
This research is supported by the Agricultural Research Service of the U.S. Department of Agriculture and an Interagency Agreement with the Office of Dietary Supplements of the National Institutes of Health.
Contributor Information
Pei Chen, U.S. Department of Agriculture, Food Composition Laboratory, Beltsville Human Nutrition Research Center, Agricultural Research Service, Beltsville, MD 20705.
James M. Harnly, U.S. Department of Agriculture, Food Composition Laboratory, Beltsville Human Nutrition Research Center, Agricultural Research Service, Beltsville, MD 20705
Peter de B. Harrington, Ohio University, Center for Intelligent Chemical Instrumentation, Department of Chemistry and Biochemistry, Athens, OH 45701
References
- 1.Christensen LP. Adv. Food Nutr. Res. 2009;55:1–73. doi: 10.1016/S1043-4526(08)00401-4. [DOI] [PubMed] [Google Scholar]
- 2.Choi HK, Wen J. Plant Syst. Evol. 2000;224:109–120. [Google Scholar]
- 3.Wiklund I, Karberg J, Lund B. Curr. Ther. Res. 1994;55:32–38. [Google Scholar]
- 4.Jia W, Gao WY. J. Plant Biotechnol. 2003;5:7–11. [Google Scholar]
- 5.Angelova N, Kong HW, Heijden RV, Yang SY, Choi YH, Kim HK, Wang M, Hankemeier T, Greef JV, Xu G, Verpoorte R. Phytochem. Anal. 2008;19:2–16. doi: 10.1002/pca.1049. [DOI] [PubMed] [Google Scholar]
- 6.Chuang WC, Sheu SJ. J. Chromatogr. A. 1994;685:243–251. [Google Scholar]
- 7.Ko SR, Choi KJ, Kim SC, Han KW. Korean J. Ginseng Sci. 1995;19:254–259. [Google Scholar]
- 8.U.S. Pharmacopeia and National Formulary. Rockville, MD: U.S. Pharmacopeial Convention; 2008. p. 952. [Google Scholar]
- 9.Ren G, Chen F. J. Agric. Food Chem. 1999;47:2771–2775. doi: 10.1021/jf9812477. [DOI] [PubMed] [Google Scholar]
- 10.Wang X, Sakuma T, Asafu-Adjaye E, Shiu GK. Anal. Chem. 1999;71:1579–1584. doi: 10.1021/ac980890p. [DOI] [PubMed] [Google Scholar]
- 11.Fuzzati N, Gabetta B, Jayakar K, Pace R, Peterlongo F. J. Chromatogr. A. 1999;854:69–79. doi: 10.1016/s0021-9673(99)00463-x. [DOI] [PubMed] [Google Scholar]
- 12.Fuzzati N. J. Chromatogr. B. 2004;812:119–133. doi: 10.1016/j.jchromb.2004.07.039. [DOI] [PubMed] [Google Scholar]
- 13.Toh DF, New LS, Koh HL, Chan EC. J. Pharm. Biomed. Anal. 2010;52:43–50. doi: 10.1016/j.jpba.2009.12.005. [DOI] [PubMed] [Google Scholar]
- 14.Deng G, Wang D, Meng M, Hu F, Yao T. J. Chromatogr. B. 2009;877:2113–2122. doi: 10.1016/j.jchromb.2009.06.003. [DOI] [PubMed] [Google Scholar]
- 15.Chan EC, Yap SL, Lau AJ, Leow PC, Toh DF, Koh HL. Rapid Commun. Mass Spectrom. 2007;21(4):519–528. doi: 10.1002/rcm.2864. [DOI] [PubMed] [Google Scholar]
- 16.Guan J, Lai CM, Li SP. J. Pharm. Biomed. Anal. 2007;44:996–1000. doi: 10.1016/j.jpba.2007.03.032. [DOI] [PubMed] [Google Scholar]
- 17.Chan TWD, But PPH, Cheng SW, Kwok IMY, Lau FW, Xu HX. Anal. Chem. 2000;72:1281–1287. doi: 10.1021/ac990819z. [DOI] [PubMed] [Google Scholar]
- 18.Li WK, Gu CG, Zhang HG, Awang DVC, Fitzloff JF, Harry HS. Anal. Chem. 2000;72:5417–5422. doi: 10.1021/ac000650l. [DOI] [PubMed] [Google Scholar]
- 19.Wan JB, Li SP, Chen JM, Wang YT. J. Sep. Sci. 2007;30:825–832. doi: 10.1002/jssc.200600359. [DOI] [PubMed] [Google Scholar]
- 20.Leung KSY, Chan K, Bensoussan A, Munroe MJ. Phytochem. Anal. 2007;18:146–150. doi: 10.1002/pca.962. [DOI] [PubMed] [Google Scholar]
- 21.Lu GH, Zhou Q, Sun SQ, Leung KZY, Zhang H, Zhao ZZ. J. Mol. Struct. 2008;883:91–98. [Google Scholar]
- 22.Yap KYL, Chan SY, Lim CS. Food Chem. 2008;107:570–575. [Google Scholar]
- 23.Du XW, Wills RBH, Stuart DL. Food Chem. 2004;86:155–159. [Google Scholar]
- 24.Luthria DL, Mukhopadhyay S, Finley J, Banuelos GS, Robbins R, Harnly JM. J. Agric. Food Chem. 2008;56:5457–5462. doi: 10.1021/jf0734572. [DOI] [PMC free article] [PubMed] [Google Scholar]
- 25.Luthria DL, Lin LZ, Robbins RJ, Finley JW, Banuelos GS, Harnly JM. J. Agric. Food Chem. 2008;56:9819–9827. doi: 10.1021/jf801606x. [DOI] [PubMed] [Google Scholar]
- 26.Jackson JE, Mudholkar GS. Technometrics. 1979;21:341–349. [Google Scholar]
- 27.Harrington P, de B, Kister J, Artaud J, Dupuy N. Anal. Chem. 2009;81:7160–7169. doi: 10.1021/ac900538n. [DOI] [PubMed] [Google Scholar]
- 28.Harrington P, de B. J. Chemometrics. 1991;5:467–486. [Google Scholar]
- 29.Wan CH, Harrington P, de B. Anal. Chim. Acta. 2000;408:1–12. [Google Scholar]
- 30.Harrington P, de B. TRAC- Trends Anal. Chem. 2006;25:1112–1124. [Google Scholar]
- 31.Corbit RM, Ferreira JFS, Ebbs SD, Murphy LL. J. Agric. Food Chem. 2005;53:9867–9873. doi: 10.1021/jf051504p. [DOI] [PubMed] [Google Scholar]
- 32.Christensen LP, Jensen M, Kidmose U. J. Agric. Food Chem. 2006;54:8995–9003. doi: 10.1021/jf062068p. [DOI] [PubMed] [Google Scholar]
- 33.Fuzzati N. J. Chromatogr. B. 2004;812:119–133. doi: 10.1016/j.jchromb.2004.07.039. [DOI] [PubMed] [Google Scholar]
- 34.Wu J, Lin L, Chau FT. Ultrason. Sonochem. 2001;8:347–352. doi: 10.1016/s1350-4177(01)00066-9. [DOI] [PubMed] [Google Scholar]
- 35.Wang HC, Chen CR, Chang CJ. Food Chem. 2001;72:505–509. [Google Scholar]
- 36.Wood JA, Bernards MA, Wan W, Charpentier W. J. Supercrit. Fluids. 2006;39:40–47. [Google Scholar]
- 37.Kwon JH, Bélanger JMR, Paré JRJ, Yaylayan VA. Food Res. Int. 2003;36:491–498. [Google Scholar]


