Abstract
The fingerprints of 18 commercially available Ginkgo biloba supplements, 12 samples of raw G. biloba leaves, and three G. biloba standard reference materials from the National Institute of Standards and Technology were acquired directly (no chromatography) by UV spectrometry and after separation using HPLC with a diode array detector. The fingerprints consisted of the UV spectral images, the chromatographic images, and the areas of the 21 most prominent chromatographic peaks. Data were analyzed by principal component analysis and one-class soft independent modeling of class analogy (SIMCA). It was determined that three of the commercial products were adulterated with rutin, four with quercetin, and one with an unidentified flavonol glycoside. One-class SIMCA of the authentic products allowed the adulterated products to be easily distinguished using Q-residuals. Authentic supplements and raw leaf materials were easily distinguished. The finely powdered samples were also analyzed by near-IR (NIR) spectrometry. The authentic and adulterated products could not be distinguished by NIR spectrometry because of the excipients.
Ginkgo biloba is one of the top-selling botanicals in the world (1, 2). It has purported efficacy for the treatment of cerebrovascular disease and dementia. Its popularity and value has led to a high frequency of adulteration. The unofficial industrial standard for G. biloba extract, established by the W. Schwabe Co. (Karlsruhe, Germany), is 24% flavonol glycosides and 6% terpene lactones by weight (3). More than 30 flavonols and flavonol glycosides (4) and five terpene lactones (5) have been reported. The most common form of adulteration is addition of a less expensive flavonol or flavonol glycoside to the extract to achieve the desired 24% flavonol glycoside concentration (6–8), although full-scale substitution has been reported (6).
Confirmation of the flavonol glycoside and terpene lactone concentration is generally achieved using HPLC with a diode array detector (DAD) and MS detection. Flavonol glycosides are hydrolyzed to aglycones, separated by HPLC, and quantified by a DAD using authentic aglycone standards (6–10). The individual aglycone masses are multiplied by specific conversion factors (2.51 for quercetin, 2.64 for kaempferol, and 2.39 for isorhamnetin), then summed to acquire the total glycosidic weight (4). The hydrolysis step in the flavonol analysis process precludes quantification of individual glycosides. The terpene lactones are transparent in the UV region and are determined by HPLC/MS with atmospheric pressure chemical ionization or electrospray ionization using authentic standards for quantification (6, 7, 9, 10).
Chromatographic and spectral fingerprinting has been used to discriminate among a wide variety of food and botanical materials based on their chemical composition (7, 11). These methods are particularly useful for botanicals for which many of the chemical components have never been identified and the bioactive constituents are not known. The World Health Organization (12) and China (13) have recognized the utility of chromatographic fingerprinting for identification and QC of whole botanical materials. Use of fingerprinting methods becomes problematic, however, as the botanicals are processed to produce dietary supplements. The production process may concentrate the components of interest, but the addition of excipients to tinctures, capsules, or tablets can produce dramatically different chemical fingerprints.
Identification of a botanical material can only be accomplished by comparison to authentic materials (14). This is reasonable for most raw ingredients of supplements. However, with processing, the authentic or reference material becomes the product itself, consisting of the botanical ingredients and any added excipients. Thus, consistency of a product can be monitored using fingerprinting methods, but comparison between products may be difficult. Care must be taken to ensure that the fingerprint accounts for all the components of a botanical product.
Chemometric methods are necessary in order to discern patterns within the complex multivariate data represented by chromatographic or spectral fingerprints (7, 11). Commonly used methods, such as principal component analysis (PCA), produce score plots that are visually easy to interpret (15). Separation of the test materials into separate clusters establishes their difference. Statistical methods are used to determine the significance of the separation (16). For multivariate data, the Hotelling T2 value indicates how well a sample fits within the PCA model (16). It is the multivariate analog of the Student’s t-value used for univariate data. However, a PCA model may be based on any number of principal components. As fewer principal components are used, the probability increases that a significant fraction of the variance may remain unaccounted for by the model (16).
A second statistical parameter, the Q-residual (also called the squared prediction error), accounts for the variance outside the model (16). This parameter has been used for process control (17, 18) and for detection of outliers (19) and is particularly useful when comparing an unknown material to a set of authentic materials. A one-class SIMCA (soft independent modeling of class analogy) model is constructed based on the authentic materials, and the Q-residual indicates how well the unknown material fits into the model. If the Q-residual for the unknown material falls outside the confidence limit computed for the authentic materials, then this indicates that the unknown contains a new type of variation that is not accounted for by the model.
This study examined the similarity of 18 commercially available G. biloba supplements, 12 samples of raw G. biloba leaves, and three G. biloba standard reference materials (SRMs) from the National Institute of Standards and Technology (NIST). Extracts of the samples were analyzed using HPLC-DAD and by direct analysis of the same extracts, without chromatographic separation, by UV spectrometry. Finely powdered samples were also analyzed by near-IR (NIR) spectrometry. The data were processed using PCA, one-class SIMCA, and classic statistical methods [F-test and one-way analysis of variance (ANOVA)].
Experimental
Reagents and Samples
Methanol (MeOH).—Optima grade (Fisher Scientific, Pittsburgh, PA).
Mobile phase.—The HPLC mobile phase A was 0.05% trifluoroacetic acid (TFA) in water; mobile phase B was 0.05% TFA in MeOH.
TFA.—HPLC grade (Sigma-Aldrich, St. Louis, MO).
Reference standards.—NIST SRM 3246, powdered raw Ginkgo leaf; 3247, spray-dried Ginkgo extract; and 3248, Ginkgo extract tablet. SRMs are intended to be used as analytical standards, not taxonomic standards. However, authentic plant material was used in the preparation of the Ginkgo standards, and the extraction and preparation techniques were identical to many procedures used commercially. The authenticity and purity of SRM 3247 have been verified using genetic bar coding (Harbaugh Reynaud et al. unpublished data).
Samples.—Eighteen commercial samples of G. biloba supplements were purchased at local drugstores or from the Internet. Seventeen were in capsule form and one was a tablet. The mg/serving (mg/capsule or tablet) were 40, 60, 90, and 120 mg. All samples claimed 24% flavonol glycosides and 6% terpene lactones by weight on the label. The inactive ingredients listed on the label included rice flour, alfalfa leaf powder, cellulose, vegetable cellulose, microcrystalline cellulose (plant fiber), maltodextrin, sorbitol, magnesium stearate, stearic acid, dicalcium phosphate, calcium carbonate, silica, calcium silicate, silicon dioxide, colloidal silicon dioxide, and preservatives. Specific ingredients have not been listed for each sample in order to maintain anonymity.
Water.—Optima grade (Fisher Scientific).
Apparatus
Centrifuge.—IEC Clinical Centrifuge (Danon/IEC Division, Needham Heights, MA).
HPLC system.—Agilent 1100 HPLC system (Agilent Technologies, Palo Alto, CA) consisting of a quaternary pump with a vacuum degasser, a thermostatted column compartment, an autosampler, and a DAD.
HPLC column.—Symmetry C18 column (250 × 4.6 mm id, 5 µm particle size) with a SymmetryShield C18 guard column (20 × 3.9 mm id, 5 µm particle size) (Waters Corp., Milford, MA).
UV spectrometer.—Lambda 25 spectrophotometer (PerkinElmer, Waltham, MA).
NIR spectrometer.—Nicolet 6700 (Thermo-Electron, Waltham, MA).
Syringe filters.—Nylon 25 mm × 0.45 µm filters (Altech Associate Inc., Deerfield, IL).
Sample Preparation
Extraction of the Ginkgo supplements has been described previously (7). Briefly, the capsules were opened and emptied, and the contents were mixed. Tablets were weighed and ground into a fine powder using a mortar and pestle. A 200 mg amount of each solid sample was weighed and transferred into a 15 mL centrifuge tube. Aqueous MeOH (50%) was used to extract flavonol glycosides, as discussed by van Beek (5). A 10 mL amount of 50% aqueous MeOH was then added to each centrifuge tube. All samples were sonicated for 15 min and centrifuged for 10 min at 1500 rpm. The supernatant was decanted into a centrifuge tube. An additional extraction was performed in the same manner as described above. The two extracts were combined and filtered through Nylon syringe filters. All samples were prepared in duplicate.
Leaf material was finely powdered and passed through a 20-mesh sieve prior to extraction, then 200 mg of the sieved materials was extracted and treated in the same manner as the powdered tablet/capsule materials. All samples were prepared in duplicate.
Sample Analysis
HPLC analysis.—The column was set at ambient room temperature, with a flow rate of 1.0 mL/min. The mobile phase consisted of a combination of A (0.1% formic acid in water) and B (0.1% formic acid in acetonitrile). The gradient increased linearly from 10% to 26% B (v/v) at 40 min, to 65% B at 70 min, and held at 65% B for an additional 30 min. At 100 min, the gradient was changed to 100% B and maintained for 6 additional min. The gradient was then changed to 10% B and held for 5 min for the next run. The DAD was set at 270, 310, 330, and 350 nm for real-time monitoring of the peak intensities. UV spectra were recorded from 190 to 450 nm.
UV analysis.—UV spectra were acquired for the 50% aqueous MeOH extracts between 200 and 400 nm at 1 nm intervals, with 50% aqueous MeOH as the reference blank. Extracts were diluted as necessary so that the maximum absorbance at 220 nm fell below 0.6 absorbance units. Sample analyses were repeated six times (each duplicate preparation was analyzed in triplicate).
NIR analysis.—Approximately 1 g of the powdered samples was placed in a 15 mL vial and tamped on a solid surface to ensure that the powder was settled firmly. Spectra were collected between 4200 and 4950 cm–1at approximately 2 cm–1 intervals. A previous study showed that this region had the most information. The region from 4950 to 5400 cm–1 was avoided, as it contains strong water bands. Sample analysis was repeated three times.
Data Processing
LC analysis/peak areas.—The original data readout from the HPLC was used, as previously described (7), to determine the 21 most prominent peaks (>5% of the major rutin peak) based on NIST SRM 3247. The peak areas for these 21 peaks were then determined for each chromatogram at the specified retention times and used to construct a data table in Excel (Microsoft, Inc., Bellingham, WA). Areas for duplicate analyses were averaged. The averaged areas for the 21 peaks were then summed and used to determine the relative peak areas. This generated a data matrix that was 20 samples by 21 peak areas that was exported to the chemometrics program.
HPLC analysis/chromatogram images.—For each of the 20 samples run in duplicate by HPLC, the entire chromatogram was used as an image. HPLC chromatograms were exported to Excel, and retention times were aligned using SpectraAlign (Version 2.4; Cartwright Group, PTCL, University of Oxford, Oxford, UK). The final data matrix for the aligned chromatograms was 40 samples by 15 800 absorbances. This matrix was exported to the chemometrics program.
UV analysis.—Spectra were exported from the UV spectrometer to Excel. Duplicate sample preparations analyzed in triplicate resulted in 120 spectra. Only the spectra from 220 to 400 nm were used because of the uncertainty introduced at the lower wavelengths by refraction. The resultant data matrix, 120 samples by 181 absorbances, was exported to the chemometrics program.
NIR analysis.—Spectra were exported from the NIR spectrometer to Excel. Samples analyzed three times each resulted in 60 spectra. Spectra were from 4200 to 4950 cm–1 at 2 cm–1 intervals. The resultant data matrix, 60 samples by 375 intensities, was exported to the chemometrics program.
Multivariate Statistical Analysis
Chemometric analyses were performed using Solo (Eigenvector Research, Inc., Wenatchee, WA). Each data set was preprocessed. The HPLC relative peak areas were previously normalized and were mean-centered in Solo. The chromatogram images and UV and NIR spectra were normalized and meancentered. The UV spectra were filtered using Savitsky-Golay coefficients for the first derivative of a quadratic fit to 25 points. The NIR spectra were filtered using the second derivative of a quartic-quintic fit to 25 points. For PCA, the entire data set was analyzed. For SIMCA, only the authentic data were submitted to PCA, and the loadings for each variable were used to compute the scores for all samples, including the adulterated samples. In every case, scores plots, loadings, and the Hotelling T2 and Q-residuals were generated by Solo.
Results
Normalized Peak Areas
A previous study examined the authenticity of commercial G. biloba samples using HPLC monitored at 280 nm (7). Based on chromatograms for the NIST reference materials, 21 major peaks, all flavonol gylcosides, were selected that characterized G. biloba. Based on retention times, peak areas were determined for these 21 peaks in each sample. Areas were summed and used to determine the relative area for each peak.
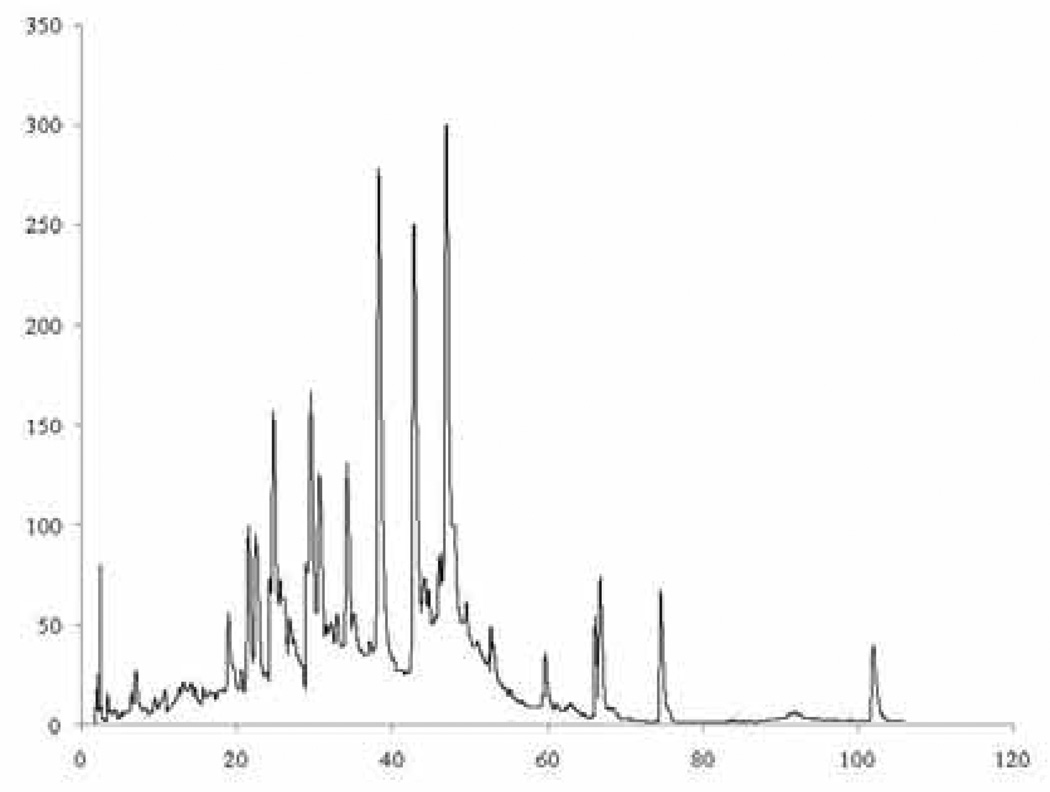
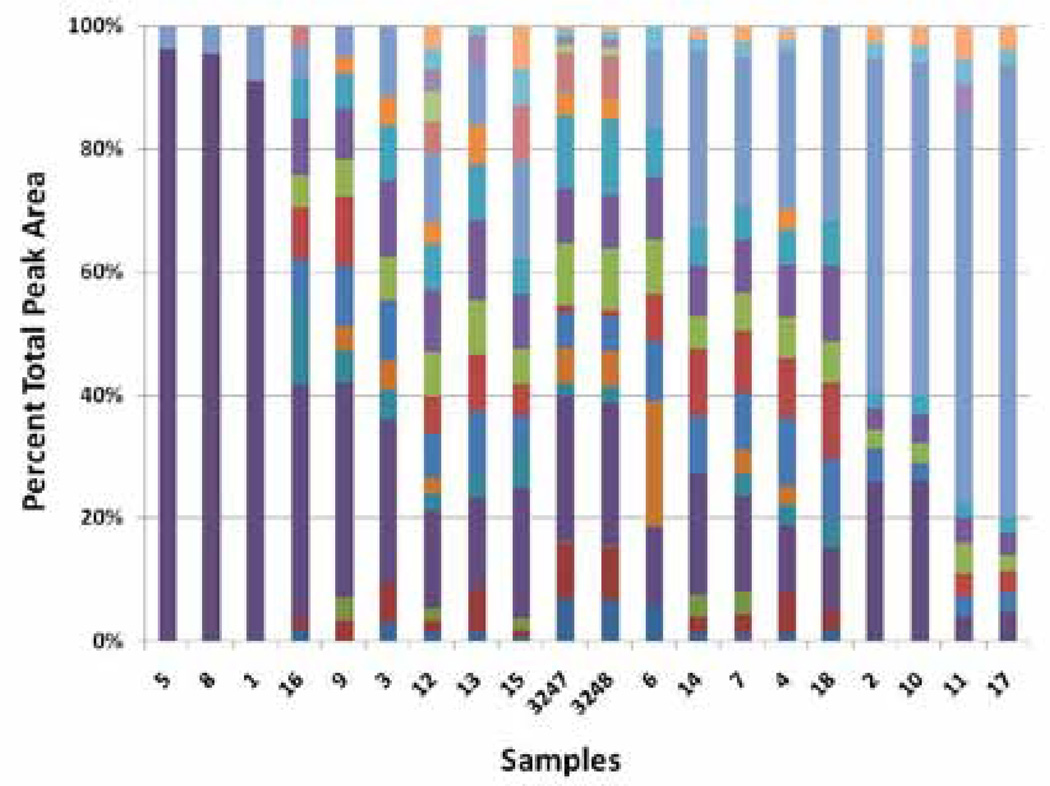
A similar approach was initially used in the current study. Relative peak areas were determined for the same 21 peaks. A typical chromatogram is shown in Figure 1; a bar graph for the normalized peak areas (the average for two runs) is presented in Figure 2. Data were acquired for 18 commercial Ginkgo biloba dietary supplements and two NIST reference materials: SRM 3247, spray-dried Ginkgo extract; and SRM 3248, Ginkgo extract tablets. The reference standards were intended by NIST to be used as analytical standards, not taxonomic standards. However, authentic plant material was used in their preparation, and the extraction and preparation techniques were identical to many procedures used commercially. Thus, the NIST materials can be regarded as an authentic Ginkgo dietary supplement with the expected, natural distribution of flavonol glycosides.
Figure 1.
Typical chromatogram for Ginkgo biloba supplements.
Figure 2.
Relative peak areas for 18 commercial Ginkgo biloba supplements and 2 NIST SRMs. Bar graph shows normalized areas for 21 peaks. Each supplement is the average of 3 repeat analyses.
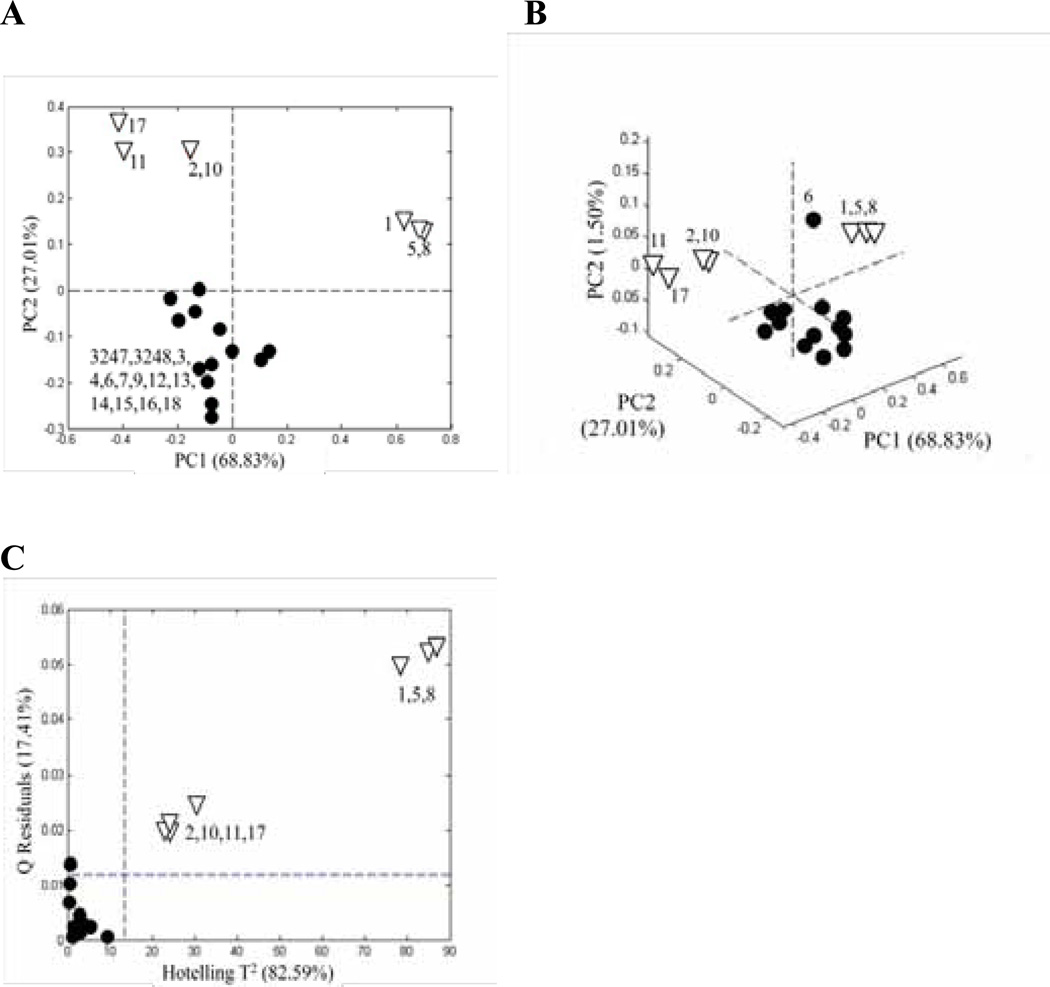
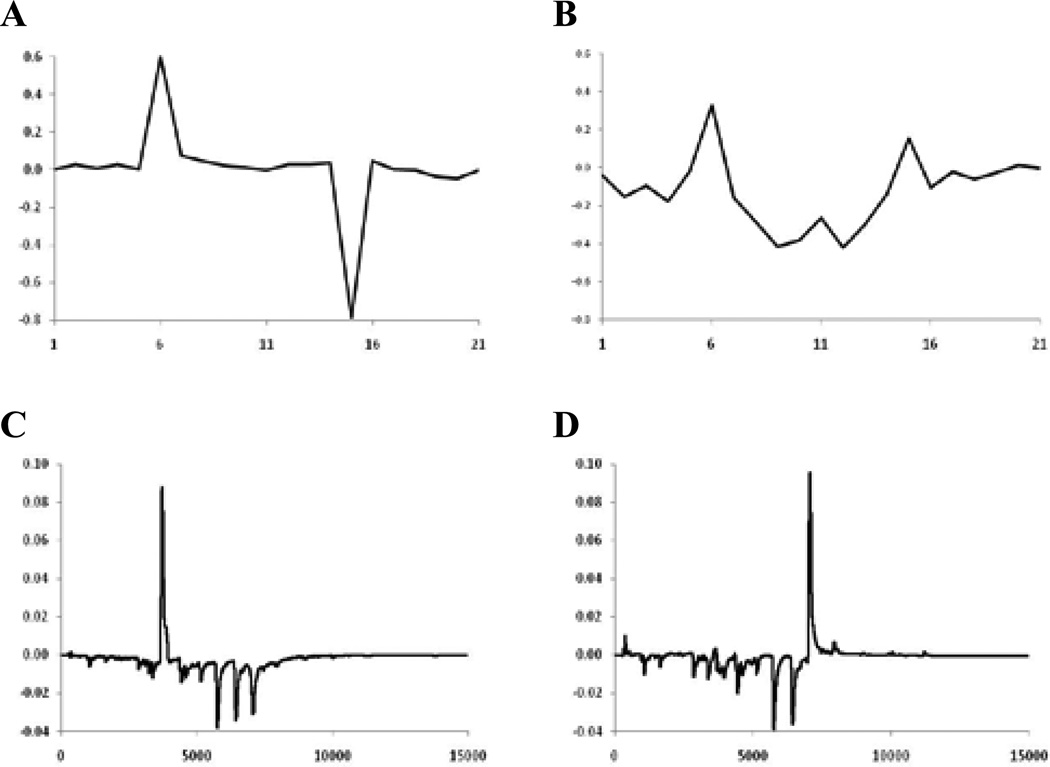
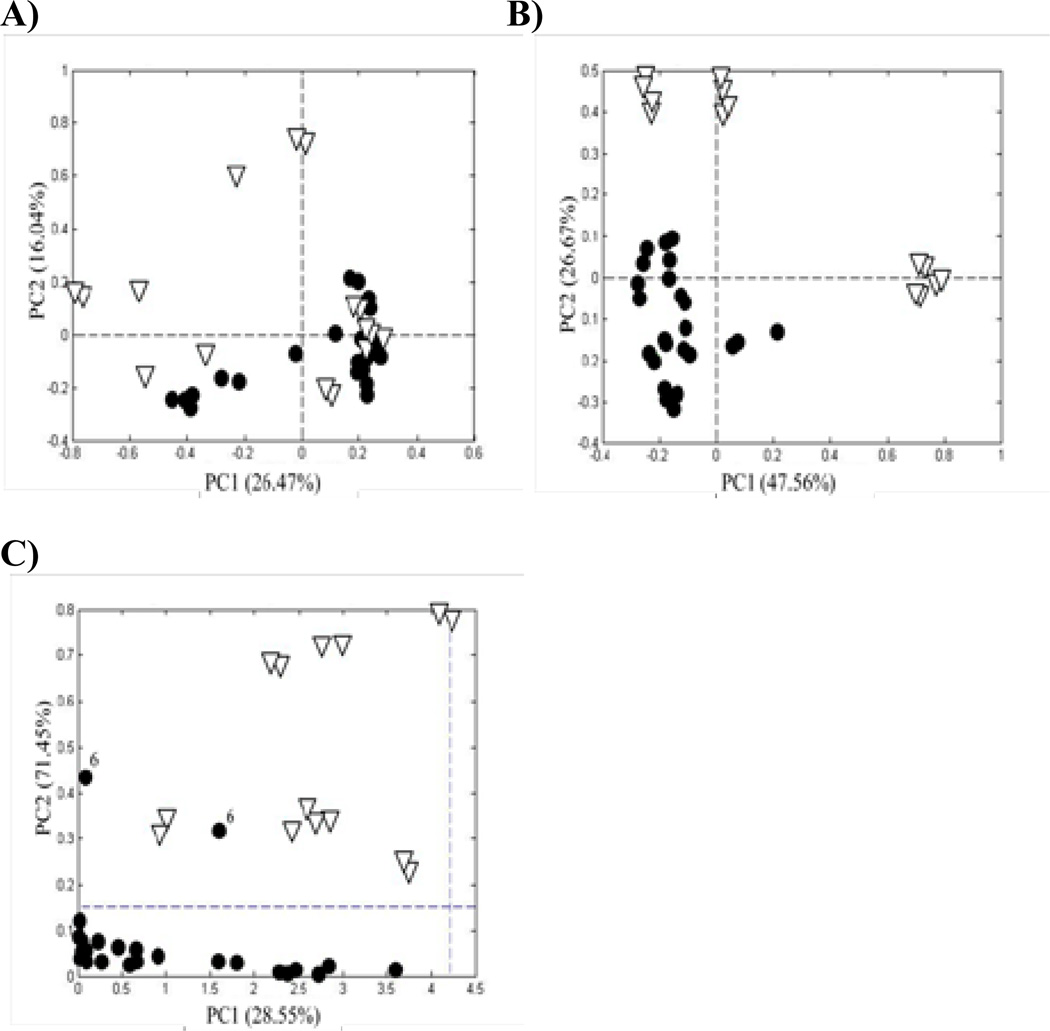
The samples in Figure 2 are arranged in order of descending rutin (quercetin rutinoside) concentration from the left and descending quercetin concentration from the right. The high rutin and quercetin levels at the two ends indicate that the original flavonol concentration has been adulterated. PCA of the normalized peak areas yielded the score plots shown in Figure 3A. It can be seen that the samples at the extreme left (Nos. 1, 5, and 8) and right (Nos. 2, 10, 11, and 17) in Figure 2 lie well-separated from the rest of the samples and from each other. The outlying samples, presumed to be adulterated, are open triangles for easy interpretation of the results. The loading plots for the first and second principal components (Figures 4A and B, respectively) reflect the importance of rutin (variable 6) and quercetin (variable 15) in discriminating between the authentic and adulterated samples.
Figure 3.
Relative peak areas: (A) PCA score plots based on the relative peak areas for the Ginkgo biloba supplements in Figure 2 with two principal components, (B) PCA score plots with three principal components, and (C) Q residuals versus Hotelling T2 for SIMCA based on a PCA model for relative peak areas of the authentic supplements. (•) authentic supplements and (∇) adulterated supplements. Each point represents the average of 3 repeat analyses.
Figure 4.
Loading plots for relative peak areas of Ginkgo biloba supplements in Figure 3 for: (A) PC1 and (B) PC2. Loading plots for peak images in Figure 6B for: (C) PC1 and (D) PC2.
Assuming that the samples seen as solid circles in Figure 3A are “authentic,” with a natural distribution of flavonols, we can use one-class SIMCA to quantify the degree of separation of the adulterated samples. Based on the construction of a PCA model for just the authentic samples using a single principal component, the Q-residual and Hotelling T2 values can be computed for all the samples. Figure 3C shows that the adulterated samples lay well beyond the 95% confidence level for both tests. However, one of the authentic samples (No. 6) also lies above the 95% confidence limit for the Q-residuals. A closer look at the bar graph in Figure 2 reveals that the strongest band (third from the bottom) of Sample 6 is unique, only seen at very low fractions in three other samples. A re-examination of the original PCA data adding a third principal component (Figure 3B) shows that Sample 6 is indeed an outlier. This fact was not discernible in the two-dimensional PCA score plot and emphasizes the importance of quantifying the degree of separation with the Q-residual.
Chromatogram Images
The use of predetermined markers can lead to erroneous results. For example, augmentation with other than one of the prominent flavonols or flavonol glycosides would not be detected using an approach looking for just 21 peaks at predetermined retention times. An alternative approach for determining authenticity is to use the entire chromatogram as an image. The sample images are processed in the same manner using one-class SIMCA. There are two significant differences using this second approach. First, retention times must be aligned for each chromatogram to eliminate systematic drift and guarantee accurate results. Second, a considerably larger number of data are processed. Whereas, in this study, PCA of the peak areas was based on a data matrix of 20 samples by 21 peaks, the chromatographic image matrix consisted of 40 samples (duplicates could no longer be averaged) by 15 800 absorbance measurements (collected over 106 min).
The need for retention time alignment is illustrated in Figures 5A and B. When properly aligned (see Experimental section), the score plot for the chromatographic images in Figure 5B is similar to that for peak areas in Figure 3A. Without alignment, no pattern was discernible (Figure 5A). Not surprisingly, the Q-residual versus Hotelling T2 plot for the chromatogram images (Figure 5C) is similar to the same plot for peak areas (Figure 3C). The loading plots (Figure 4C and D) for the aligned chromatographic images is considerably more complex than that for the peak areas (Figures 4A and B) since each of the 15 800 data points in the chromatogram is considered in the calculation. Once again, Sample 6 appears to be authentic in the two-dimensional score plots, but shows up as an obvious outlier based on the Q-residuals.
Figure 5.
Chromatographic images: (A) PCA score plots based on the chromatographic images of the Ginkgo biloba supplements in Figure 1 without retention time alignment, (B) with retention time alignment, and (C) Q residuals versus Hotelling T2 for SIMCA based on a PCA model for peak areas of the authentic samples. (•) authentic supplements and (∇) adulterated supplements. Each supplement was analyzed in duplicate.
Use of peak areas and chromatographic images represent targeted and nontargeted analyses, respectively. In this study, augmentation of the samples occurred at targeted peaks; thus, the results for the two approaches were the same. If augmentation of the samples had occurred using a compound at a retention time that was not targeted, then only the chromatographic image approach would offer the possibility of detecting the augmentation.
UV Spectra–Chemometric Analysis
A third approach eliminates the need for chromatographic separation and uses the UV spectra of the original, unfractionated sample extracts. This is an untargeted approach that has been implemented using a classic UV-Vis spectrometer, a 96-well plate reader, or a DAD for direct injection HPLC across a guard column. In the last case, the spectra were summed across the sample bolus. In all cases, the data matrix is considerably simpler than that of the chromatographic images, since there are usually only 180 variables, the UV spectrum from 221 to 400 nm, measured at 1 nm increments. In this study, six spectra were collected for each sample using a UV-Vis spectrometer; each duplicate sample was analyzed three times. Thus, the data matrixes were 120 samples by 180 absorbances.
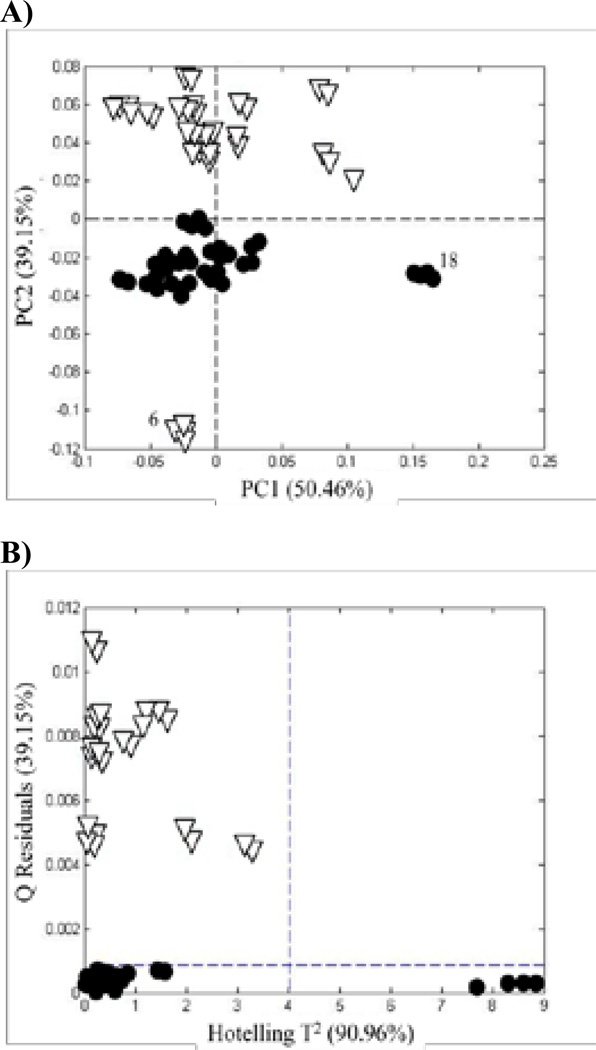
The PCA score plot and Q-residual plot for the UV spectra are shown in Figures 6A and B, respectively. In general, Figure 6A is similar to Figures 3A and 5B. One major difference is that Sample 6 is now found at the bottom of the plot, well-separated from the authentic and adulterated samples. It is displayed as an open triangle to denote an adulterated sample. A second difference is that Sample 18 is well-separated to the right side of the plot, although it has still been identified as an authentic sample (solid circle). In Figure 2, it can be seen that Sample 18 contains a high fraction of quercetin. However, so do Samples 4, 7, and 14. Thus, it is the total pattern that establishes the difference for Sample 18. Figure 6B shows that Sample 18 lies beyond the 95% confidence limit on the Hotelling T2 scale. Thus, Sample 18 is marginally authentic with respect to its chemical content.
Figure 6.
UV spectra: (A) PCA score plots based on the UV spectra of the Ginkgo biloba supplements in Figure 2 and (B) Q residuals vs Hotelling T2 for SIMCA based on a PCA model for authentic supplements. (•) authentic supplements and (∇) adulterated supplements. Each supplement was analyzed six times.
UV Spectra–Classical Statistical Analysis
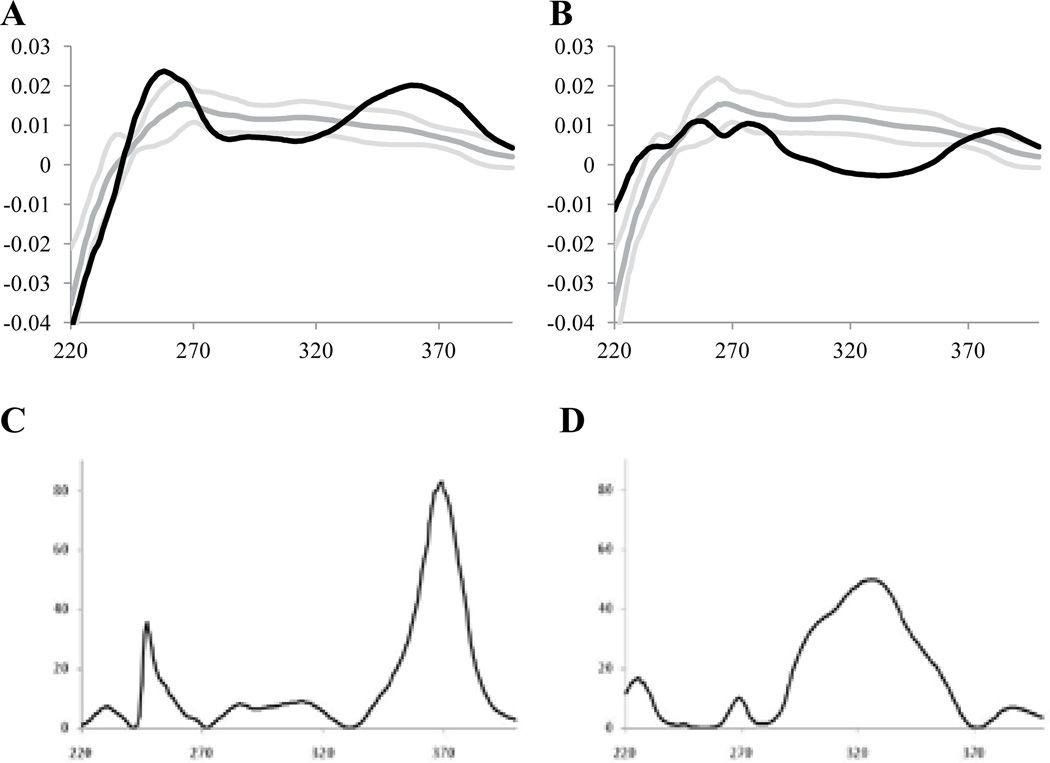
It is possible to analyze the UV spectra using classical statistical approaches, such as the Student’s t-test, the F-test, or one-way ANOVA. All three approaches are analogous, since each determines whether the mean spectra of the authentic and adulterated samples are significantly different based on the spectral variance. Figures 7A and B show the mean spectrum (after normalizing and mean centering) of the authentic samples (dark gray) and the 95% confidence limit determined at each wavelength (light gray). It can be seen that the superimposed average spectra (black) for Samples 5 (Figure 7A) and 17 (Figure 7B), the samples at the extremes in Figure 2, fell outside the 95% confidence limit over many intervals of their spectra. Visually, these two samples would be judged as different from the authentic samples.
Figure 7.
Comparison of averaged, normalized, and mean centered UV spectra (A and B) and F values (C and D) for supplements 5 (A and C) and 17 (B and D). For A and B, Dark Gray = averaged, normalized, and mean centered UV spectra for authentic supplements, Light Gray = 95% confidence limit, and Black = averaged, normalized, and mean centered UV spectrum for samples 5 and 17. For (C) and (D) computed F values based on authentic supplements and supplements 5 and 17.
An F-test of the two populations confirms the visual conclusion. In Figures 7C and D, an F-value has been computed at each wavelength for Samples 5 and 17, respectively. The larger the deviation of the spectra of the adulterated samples from the mean of the authentic samples in Figures 7A and B, the larger the F-values in Figures 7C and D. It can be seen that the patterns of the two adulterated samples were different; the maximum F-value for Sample 5 fell at 370 nm compared to the maximum for Sample 17 at 320 nm. The patterns for most of the adulterated samples (Nos. 1, 2, 10, and 11) were similar to those of Sample 5 (Figure 7C). Samples 6 and 8 had maxima at both 320 and 370 nm.
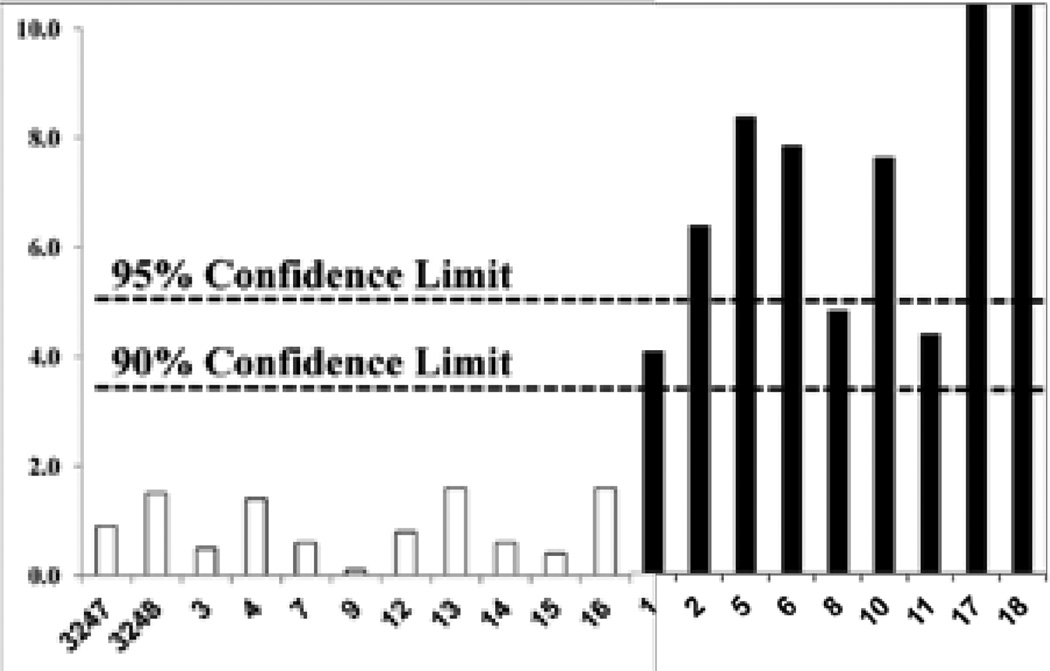
The F-test results in Figures 7C and D are simply a series of one-way ANOVAs performed at a single wavelength. Application of ANOVA to a range of wavelengths will provide the average F-value for the wavelengths selected. Figure 8 provides the ANOVA results for all of the samples analyzed using the full spectrum (221–400 nm). In this case, the average spectrum of the authentic data was compared to the spectrum of each individual sample, authentic or adulterated. Thus, the F-values for Samples 5 and 17, averaged between 221 and 400 nm, were approximately 5 and 12, respectively, and were significant at the 95 and 90% confidence limits.
Figure 8.
F-values for each supplement in Figure 2 based on one way ANOVA of the UV spectra using authentic supplements (white bars) as the references.
In general, all the authentic samples had F-values well below the 90% confidence limit, and all the previously observed adulterated samples had F-values above the 90% confidence limit. Greater statistical significance for the adulterated samples can be achieved using F-values at selected wavelengths, as shown in Figures 7C and D. However, the use of the entire spectrum allows sensitivity to different variations in the spectral patterns. For example, F-values measured at 370 nm would provide greater statistical significance for the variation of Sample 5 but would fail to identify Sample 17 as an adulterated sample.
NIR Spectra
PCA of the NIR spectra obtained for the finely powdered samples used for extracts above failed to show the patterns observed in Figures 3A, 5B, and 6A. NIR spectrometry could not distinguish between the authentic and adulterated G. biloba samples. Upon reflection, this is not surprising. Analysis of solids by either NIR or IR spectrometry is heavily influenced by the macrocomponents. Thus, the solid ingredient (binders or excipients), which compose 76% of the sample by weight, can have a significant influence on the spectra. Conversely, the MeOH–water extraction process used in this study will leave the excipients behind and extract the semipolar components.
For the 18 commercial samples analyzed in this study, numerous additional ingredients were identified on the label. These included rice flour, alfalfa leaf powder, cellulose, vegetable cellulose, microcrystalline cellulose (plant fiber), maltodextrin, sorbitol, magnesium stearate, stearic acid, dicalcium phosphate, calcium carbonate, silica, calcium silicate, silicon dioxide, colloidal silicon dioxide, and preservatives. The percent composition of these ingredients is not listed. There was no obvious correlation between any of the listed ingredients and the pattern seen in the PCA score plot of the NIR spectra.
The use of alfalfa leaf powder as an additional ingredient seemed problematic. It was possible that the alfalfa might contribute components to the extract that are not found in G. biloba. This could influence the chromatographic images or the UV spectra. However, the samples containing alfalfa fell in the authentic category and showed no extraneous components in either the chromatograms or UV spectra.
Commercial Samples Versus Raw Leaves
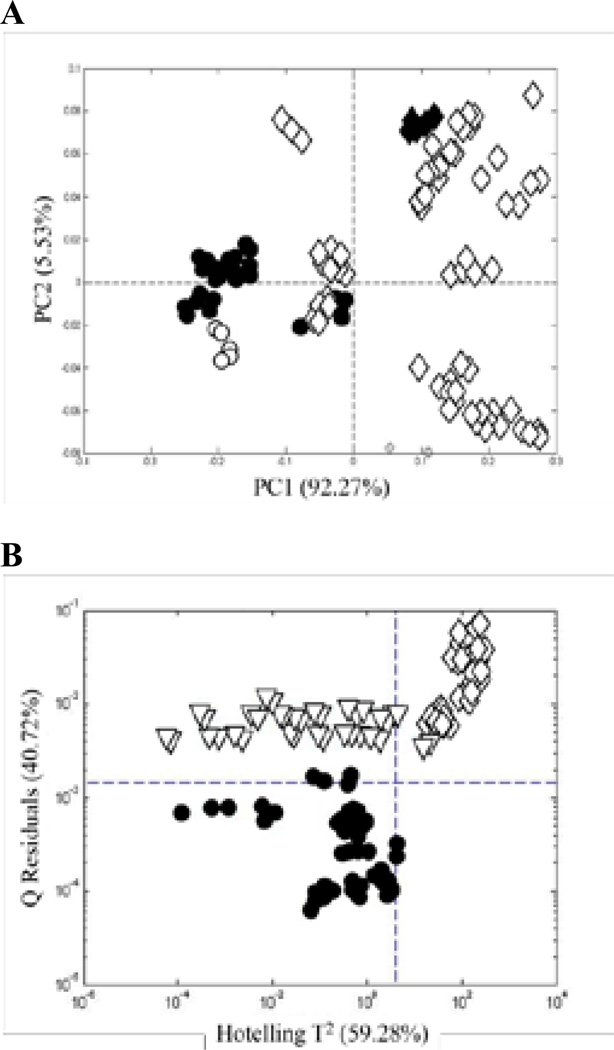
Commercial G. biloba extracts are prepared through a complex series of extractions and back-extractions using different solvents. The purpose is to purify the flavonol glycosides and terpene lactones, and to remove unwanted compounds. Thus, it is to be expected that the commercially prepared supplements would have a different chemical profile compared to an extract of the raw leaves. This difference is obvious in Figure 9A, where the PCA score plot is shown for the UV spectra of extracts of 12 raw leaf samples (open diamonds) (collected in Maryland and Beijing in the summer of 2007) and the 10 authentic commercial samples (solid circles). In this figure, SRM 3246, raw Ginkgo leaves, has also been included, and is shown as solid diamonds. SRM 3247, spray-dried Ginkgo extract, and SRM 3248, Ginkgo extract tablets, are shown as open circles.
Figure 9.
Comparison of Ginkgo biloba supplements and raw leaves: (A) PCA score plots for UV spectra of the authentic supplements and raw leaves and (B) Q residuals versus Hotelling T2 for SIMCA based on a PCA model for authentic supplements. (•) Authentic supplements, (∇) adulterated supplements, (o) raw leaves, (♦) SRM 3247, spray dried ginkgo extract, and SRM 3248, ginkgo extract tablets, and (•) SRM 3246, ground Ginkgo biloba leaves. Each sample was analyzed six times.
In general, the extracts of the commercial samples and SRMs 3247 and 3248 fall on the left side of the plot, and the extracts of the raw leaves and SRM 3246 fall on the right side. There is overlap in the center for one commercial sample (No. 18) and three raw leaf samples. Sample 18 was the sample that was marginally authentic in Figures 6A and B; the raw leaf samples were collected in Beijing and Maryland. It appears that Sample 18 may contain a significant fraction of ground raw leaf.
Discussion
The results of this study show that UV spectra, combined with SIMCA and, specifically, the Hotelling T2 and Q-residuals, can be used to distinguish between authentic and adulterated G. biloba supplements. The Q-residual and the 95% confidence limit establish a step function that separates the authentic and the adulterated samples. Confidence in the UV method is enhanced by the results obtained from chemometric analysis of the chromatographic images. This reinforces the adage that the more that is known about a material, the easier it is to develop an accurate assay. In this study, the more definitive chromatographic images make it easier to accept the simpler UV method results as accurate.
Interestingly, the results presented in this paper suggest that the UV spectra were more sensitive than the normalized peak areas or chromatographic images to the subtle variations in chemical composition of the G. biloba samples. Sample 6 is clearly identified as adulterated by the UV method (Figure 6), whereas it is more difficult to detect chromatographically (Figures 3 and 5). In addition, Sample 18 shows up as marginally authentic by the UV method (Figure 6) and when compared to raw leaf material (Figure 9A). It must be remembered that the same extracts were used for all three studies, and UV detection was used for each. This suggests that the excellent precision achieved for UV spectra may be offset by the added uncertainty associated with the chromatographic process.
Authenticity is most easily established by comparison of the “unknown” to an “authentic” material. However, for a processed sample, the authentic material is previously prepared materials for which the process is accepted as being under control. To compare multiple processed samples, as was the case in this study, it is necessary to extract the common component. Hence, the chromatographic and UV spectral results for the extractant were more meaningful than the NIR results for the solid.
Finally, the biological variation of the natural components of a botanical material will have a normal or log-normal distribution. And the sum of these components, as measured by direct UV spectrometric analysis or monitored by PCA, will be even more likely to have a normal or log-normal distribution. There is no absolute chemical profile. Strong augmentation of a sample will provide a significantly different profile that exceeds the natural limits of authentic materials. This creates an obvious step function that makes it is easy to discern the adulterated samples in Figures 3C, 5C, and 6C. However, more subtle augmentation would create greater difficulty in its detection. The level of augmentation that can be detected is dependent on the sensitivity of the method for the augmenting compound and the quantity that has been added.
Conclusions
Common chromatographic and spectral patterns were detected for commercially available G. biloba supplements after a MeOH–water extraction. Adulterated and authentic supplements were easily distinguished and were also distinguishable from raw leaf materials. Extraction of the supplements and leaves was critical to being able to discriminate among the three populations.
Acknowledgments
This research was supported by the Agricultural Research Service of the U.S. Department of Agriculture and an Interagency Agreement with the Office of Dietary Supplements of the National Institutes of Health.
References
- 1.Michel PF. Presse. Med. 1986;15:1450–1454. [PubMed] [Google Scholar]
- 2.Gaby AR. Alt. Med. Rev. 1996;1:236–242. [Google Scholar]
- 3.Sticher O. Planta Med. 1993;59:2–11. doi: 10.1055/s-2006-959593. [DOI] [PubMed] [Google Scholar]
- 4.Hasler A, Sticher O. J. Chromatogr. B. 1992;605:41–48. [Google Scholar]
- 5.van Beek TA, editor. Ginkgo biloba. New York, N Y: Harwood Academic Publishers; 2000. pp. 151–178. [Google Scholar]
- 6.Sloley BD, Tawfik SR, Scherban KA, Tam YK. J. Food Drug Anal. 2003;11:102–107. [Google Scholar]
- 7.Chen P, Ozcan M, Harnly J. Anal. Bioanal. Chem. 2007;389:251–261. doi: 10.1007/s00216-007-1386-9. [DOI] [PMC free article] [PubMed] [Google Scholar]
- 8.Ding S, Dudley E, Plummer S, Tang J, Newton RP, Brenton AG. Phytochemistry. 2008;69:1555–1564. doi: 10.1016/j.phytochem.2008.01.026. [DOI] [PubMed] [Google Scholar]
- 9.Tang D, Yang D, Tang A, Gao Y, Jiang X, Mou J, Yin X. Anal. Bioanal. Chem. 2010;396:3087–3095. doi: 10.1007/s00216-010-3536-8. [DOI] [PubMed] [Google Scholar]
- 10.Ozcan M, McAuley B, Chen P. J. Food Drug. Anal. 2007;15:55–62. [Google Scholar]
- 11.Sarbu C, Nacu-Briuciu RD, Kot-Wasik A, Gorinstein S, Wasik A, Namiesnik J. Food Chem. 2011;130:944–1002. [Google Scholar]
- 12.World Health Organization. Guidelines for Assessment of Herbal Medicines. Geneva, Switzerland: WHO; 1991. [Google Scholar]
- 13.Committee of National Pharmacopoeia. Pharmacopoiea of PR China. Beijing, China: Press of Chemical Industry; 2000. [Google Scholar]
- 14.LaBudde R, Harnly J. J. AOAC Int. 2012;95:273–285. doi: 10.5740/jaoacint.11-266. [DOI] [PMC free article] [PubMed] [Google Scholar]
- 15.Wold S. Chemometr. Intell. Lab. Syst. 1987;2:37–52. [Google Scholar]
- 16.Brereton RG. Chemometrics for Pattern Recognition. West Sussex, UK: John Wiley and Sons, Ltd; 2009. [Google Scholar]
- 17.Li Vigni M, Durante C, Foca G, Marchetti A, Ulrici A, Cocchi M. Anal. Chim. Acta. 2009;642:69–76. doi: 10.1016/j.aca.2009.01.046. [DOI] [PubMed] [Google Scholar]
- 18.Preys S, Vigneau E, Mazerolles G, Cheynier V, Bertrand D. Chemometr. Intell. Lab. Syst. 2007;87:200–207. [Google Scholar]
- 19.Daszykowski M, Kaczmarek K, Vander Hayden Y, Walczak B. Chemometr. Intell. Lab. Syst. 2007;85:203–219. [Google Scholar]


