

Abstract
The pivotal role of cultivated grapevine (Vitis vinifera L.) in many countries economy is compromised by its high susceptibility to Plasmopara viticola, the causal agent of downy mildew disease. Recent research has identified a set of genes related to resistance which may be used to track downy mildew infection. Quantification of the expression of these resistance genes requires normalizing qPCR data using reference genes with stable expression in the system studied. In this study, a set of eleven genes (VATP16, 60 S, UQCC, SMD3, EF1α, UBQ, SAND, GAPDH, ACT, PsaB, PTB2) was evaluated to identify reference genes during the first hours of interaction (6, 12, 18 and 24 hpi) between two V. vinifera genotypes and P. viticola. Two analyses were used for the selection of reference genes: direct comparison of susceptible, Trincadeira, and resistant, Regent, V. vinifera cultivars at 0 h, 6, 12, 18 and 24 hours post inoculation with P. viticola (genotype effect); and comparison of each genotype with mock inoculated samples during inoculation time-course (biotic stress effect). Three statistical methods were used, GeNorm, NormFinder, and BestKeeper, allowing to identify UBQ, EF1α and GAPDH as the most stable genes for the genotype effect. For the biotic stress effect, EF1α, SAND and SMD3 were the most constant for the susceptible cultivar Trincadeira and EF1α, GAPDH, UBQ for the resistant cultivar Regent. In addition, the expression of three defense-related transcripts, encoding for subtilisin-like protein, CYP and PR10, was analysed, for both datasets, during inoculation time-course. Taken together, our results provide guidelines for reference gene(s) selection towards a more accurate and widespread use of qPCR to study the first hours of interaction between different grapevine cultivars and P. viticola.
Introduction
Traditional premium cultivars of wine and table grapes are highly susceptible to various diseases, particularly to downy mildew. Grapevine downy mildew is caused by the biotrophic oomycete Plasmopara viticola (Berk. et Curt.) Berl. et de Toni. In Europe, disease management became one of the main tasks for viticulture, being the current strategy for downy mildew disease control the massive use of pesticides in each growing season. The introgression of specific genetic traits, such as resistance to pathogens in traditional crops by breeding programs is one of the most promising methods to reduce such disease control measures. The study of this pathosystem has been of great interest and knowledge on resistance genes linked to downy mildew have been inferred from several approaches, such as from transcriptional analysis [1]–[7] to quantitative trait loci (QTL) and linkage map analysis [8]–[14], to loci linked to resistance [3], .
Quantitative real time polymerase chain reaction (qPCR) is currently the most sensitive technique for gene expression analysis due to its reproducibility and sensitivity [18]–[20]. However, qPCR is influenced by a number of variables that strongly interfere with its accuracy and reliability [20]–[22]. qPCR studies require one or more reference genes (RG) as internal controls for the standardization of raw expression data, allowing the correction for variable starting amounts of RNA and for differences in reverse transcription (RT) efficiency, since reference genes are exposed to the same preparation steps as the genes of interest (GOI) [19], [21]–[23]. Reference genes must be validated for each experimental condition [24] and the geometrical averaging of multiple internal control genes should be used [25]. For grapevine, validation of reference genes has been reported for berry development [26], abiotic stress [27] and biotic stress [28],[29]. For grapevine-downy mildew pathosystem, reference genes have been validated for susceptible V. vinifera cultivars from 1 to 7 days post- inoculation with P. viticola, being V-type proton ATPase (VATP16), 60 S ribosomal protein L18 (60 S), ubiquitin conjugating enzyme (UBQ) and SAND family protein (SAND) reported as the most stable [28], [29]. For the first hours of interaction between grapevine and P. viticola no reference genes have yet been validated. In this study, we have tested 11 candidate genes for qPCR normalization of gene expression during the first hours of interaction (0 h, 6, 12, 18 and 24 hpi) with P. viticola. Two grapevine cultivars with different degrees of resistance towards P. viticola were used. Data was analysed to study genotype and biotic stress effects. The best combination of reference genes for each data set was used to assess the expression of three GOIs, pathogenesis-related protein 10, subtilisin-like protease and cyclophilin, known to be induced during downy mildew inoculation [2].
Materials and Methods
Plant Material, Experimental Design and Plasmopora viticola Inoculation
The grapevine cultivar Regent was selected at the JKI-Institute for Grapevine Breeding Geilweilerhof. It was bred by multiple introgressions from resistant wild genotypes [30], presenting a high degree of resistance to both downy and powdery mildew [31]. Trincadeira is a Portuguese traditional grapevine cultivar widely used for quality wine production and highly sensitive to Plasmopara viticola [1]. Both cultivars were propagated under identical greenhouse conditions according to Figueiredo et al. [2]. Briefly, wood cuttings from both grapevine genotypes were harvested at Quinta da Plansel (Montemor-o-Novo, Portugal) and sent to the JKI Institute for Grapevine Breeding (Geilweilerhof, Germany). Wood cuttings were grown in 12 cm diameter pots in Fruhstorfer Erde (soil) Type P at natural day/night rhythm in a temperature range between 5°C and 28°C for 10 weeks. For plant inoculation, P. viticola sporangia were collected after an overnight incubation of symptomatic leaves from greenhouse infected plants in a moist chamber at room temperature. Sporangia were carefully recovered by brushing, dried, stored at −25°C and checked for their vitality by microscopy as described in Kortekamp et al. [3]. A suspension containing 104 sporangia ml−1 was used to spray the abaxial leaf surface in order to challenge the plants. Mock inoculations with water were also made. After inoculation, plants were kept in a moist chamber (100% humidity) required for optimal infection for 8 h and then under greenhouse conditions at 25°C during the inoculation time course. The third to fifth fully expanded leaves beneath the shoot apex were harvested at 0 h, 6, 12, 18 and 24 hpi, immediately frozen in liquid nitrogen and stored at −80°C. For each genotype, each biological replicate comprehends a pool of three leaves from three different plants. Three independent biological replicates were collected for each cultivar and condition (inoculated and mock inoculated).
RNA Extraction and cDNA Synthesis
Total RNA was isolated from leaves with the Spectrum™ Plant Total RNA Kit (Sigma-Aldrich, USA) according to the manufacturer’s instructions. Residual genomic DNA was digested with DNase I (On-Column DNase I Digestion Set, Sigma-Aldrich, USA). RNA purity and concentration were measured at 260/280 nm using a spectrophotometer (NanoDrop-1000, Thermo Scientific) while RNA integrity was verified by agarose gel electrophoresis. Genomic DNA (gDNA) contamination was checked by qPCR analysis of a target on the crude RNA [32]. Complementary DNA (cDNA) was synthesized from 2.5 µg of total RNA using RevertAid®H Minus Reverse Transcriptase (Fermentas, Ontario, Canada) anchored with Oligo(dT)18 primer (Fermentas, Ontario, Canada), according to manufacturer’s instructions.
Candidate Gene: Selection and Primer Design
Eleven candidate genes were selected based on previous studies in Arabidopsis [33] and grapevine [2], [26], [28], [29], [33], [34]. Nine of these genes were formerly described as reference genes for grapevine downy mildew pathosystem in later inoculation time-points (1–7 days post-inoculation): V-type proton ATPase 16 kDa proteolipid subunit (VATP16), 60 S ribosomal protein L18 (60 S), Ubiquinol-cytochrome c reductase complex chaperone (UQCC), Small nuclear ribonucleoprotein SMD3 (SMD3) from Gamm et al. [28]; Elongation factor 1α (EF1α) from Trouvelot et al. [34], Ubiquitin-conjugating enzyme (UBQ) and SAND family protein (SAND) from Reid et al. [26], glyceraldehyde-3-phosphate dehydrogenase (GAPDH) from Selim et al. [29] and Actin (ACT) from Figueiredo et al. [2]. The other two gene homologous to Arabidopis polypyrimidine tract-binding protein 1 (AT3g01150) and D1 subunit of photosystem I and II reaction centers (ATCg00340) [33], were retrieved from the grapevine TIGR database v. 8 as PTB2 protein (TC109121) and PsaB (TC134081), respectively. Grapevine specific primers were designed with Primer Express software version 3.0 (Applied Biosystems, Sourceforge, USA) using the following parameters: amplicon length between 75 and 250 bp; size: 20±2 bp; melting temperature (Tm): 60±2 °C; GC content: ±50%.
Quantitative Real time PCR
Quantitative RT-PCR (qPCR) experiments were carried out using Maxima™ SYBR Green qPCR Master Mix (2×) kit (Fermentas, Ontario, Canada) in a StepOne™ Real-Time PCR system (Applied Biosystems, Sourceforge, USA). A final concentration of 2.5 mM MgCl2 and 0.2 µM of each primer were used in 25 µL volume reactions, together with cDNA as template. The amplification efficiency of each candidate/target gene was determined using a pool representing all cDNA samples. The pool was used to generate a five-point standard curve based on a ten-fold dilution series. Each standard curve was amplified in two independent qPCR runs and each dilution was run in triplicate. Amplification efficiency (E) was calculated from the slope of the standard curve (E = 10(−1/a)) where a is the slope of the linear regression model (y = a log(x)+ b) fitted over log-transformed data of the input cDNA concentration (y) plotted against quantification cycle (Cq) values (x).
To investigate candidate reference gene stability, cDNA samples were 10-fold diluted. Thermal cycling for all genes started with a denaturation step at 95°C for 10 min followed by 45 cycles of denaturation at 95°C for 15 s and annealing temperatures (Table 1) for 30 s. Each set of reactions included no template control. Dissociation curves and agarose gel electrophoresis were used to analyze non-specific PCR products. Three biological replicates were used for each sample and the experiments were done twice (two technical replicates).
Table 1. Candidate reference genes and target genes primer sequences, amplicon length and qPCR analysis.
| Gene (Accession Number)* | Predicted function | Primer sequence | Ampliconlength (bp) | Ta (°C) | Tm (°C) | PCR efficiency(E/%) | Regression Coefficient (R2) | Average Cq(± SD) |
| Reference genes | ||||||||
| VATP16 (XM_002269086.1) | Transport | F: CTTCTCCTGTATGGGAGCTG | 112 | 60 | 82.62 | Discarded (unspecific amplification) | ||
| R: CCATAACAACTGGTACAATCGAC | ||||||||
| UQCC (XM_002264785.1) | unknown | F: CAAAGTATGAGGGTATCCGA | 250 | 60 | 77.76 | |||
| R: GTATTGCCCAAATTCAACACC | ||||||||
| PTB2 | Similar to AT3g01150, involved in RNA binding, nucleic acid and nucleotide binding | F: CGATCCATAACTCGTGCCAAA | 113 | 60 | 78.79 | Discarded (low abundance transcript) | ||
| (TC109121) | R: TGAACCCACCATGAACAACAA | |||||||
| 60 S (XM_002270599.1) | structural constituent of ribosome/translation | F: ATCTACCTCAAGCTCCTAGTC | 165 | 60 | 79.41 | 1.932/93.18 | 0.998 | 20.20±1.62 |
| R: CAATCTTGTCCTCCTTTCCT | ||||||||
| SMD3 (AM435088.2) | Pre-mRNA splicing | F: GCTCTGTTGTTGAAGATGGG | 156 | 60 | 80.35 | 1.969/96.94 | 0.994 | 22.35±1.13 |
| R: GGAAGCAGTTTGTAGCATCAG | ||||||||
| EF1α (EC959059) | Translation | F: GAACTGGGTGCTTGATAGGC | 164 | 60 | 79.8 | 1.992/99.20 | 0.994 | 17.37±1.18 |
| R: ACCAAAATATCCGGAGTAAAAGA | ||||||||
| UBQ (EC922622) | protein degradation. | F: GAGGGTCGTCAGGATTTGGA | 75 | 60 | 78.78 | 1.965/96.48 | 0.994 | 18.95±1.19 |
| post-translational modification | R: GCCCTGCACTTACCATCTTTAAG | |||||||
| SAND (CF405409) | unknown | F: CAACATCCTTTACCCATTGACAGA | 76 | 60 | 78.78 | 1.932/93.18 | 0.996 | 23.8±1.33 |
| R: GCATTTGATCCACTTGCAGATAAG | ||||||||
| GAPDH (EF192466) | Glycolysis. gluconeogenesis | F: TCAAGGTCAAGGACTCTAACACC | 226 | 60 | 81.13 | 1.936/93.47 | 0.993 | 17.12±1.51 |
| R: CCAACAACGAACATAGGAGCA | ||||||||
| Actin (TC81781**) | Cytoskeletal structural protein | F: ATTCCTCACCATCATCAGCA | 89 | 55 | 77.44 | 1.950/94.97 | 0.996 | 21.34±1.30 |
| R: GACCCCCTCCTACTAAAACT | ||||||||
| PsaB | Similar to ATCg00340, involved in chlorophyll binding | F: GGACCCCACTACTCGTCGTATT | 148 | 60 | 77.06 | 1.907/90.69 | 0.998 | 16.14±2.71 |
| (TC134081) | R: TCCGGAAGTCCACAGAAAAAT | |||||||
| Target genes | ||||||||
| PR10 (HS075818) | Defense | F: GTTTTGACTGACGGCGTTGA | 99 | 62 | 79.72 | 1.903/90.31 | 0.998 | 15.07±1.38 |
| R:TGGTGTGGTACTTGCTGGTGTT | ||||||||
| Subtilisin (HS977208) | Defense | F: GTGCTCCAGAGGGACTCGATAT | 100 | 58 | 76.86 | 1.967/96.67 | 0.997 | 18.63±2.71 |
| R: TACCTTTCCTTCCACCTTCAACA | ||||||||
| Cyclophilin (CF609761) | Defense/signalling | F: GCCTCTGCACTACAAGGGATCT | 96 | 56 | 82.34 | 1.997/99.74 | 0.991 | 15.86±1.76 |
| R: TTCGCCACCAGTACCGTTTC | ||||||||
SD, standard deviation. * NCBI accession number or TC TIGR number. ** According to Polesani et al. (2010).
Determination of Reference Gene Expression Stability using GeNorm, NormFinder and BestKeeper
Data analysis was performed in two groups: biotic stress effect and genotype effect. With the biotic stress dataset, gene stability was evaluated by comparing each genotype with mock inoculated control samples at 6, 12, 18 and 24 hpi. With the genotype dataset, gene stability was evaluated when comparing directly the resistant cultivar Regent and the susceptible Trincadeira at 0 h, 6, 12, 18 and 24 hpi.
The stability of candidate reference genes for the different comparison groups was evaluated with BestKeeper [35], GeNorm v. 3.5 [25] and NormFinder [36] tools.
The GeNorm is based on the pairwise variation of a single reference candidate gene relative to all other genes. The main assumption of this approach relies on the expression ratio of the two ideal reference genes being identical in all samples regardless of the conditions tested. GeNorm calculates a gene expression stability measure (M) based on the average pairwise (V) expression ratio between a gene and each of the other genes being compared. Moreover, it performs a stepwise exclusion of the least stable gene and recalculates M until only the two most stably expressed genes are left. A pairwise variation value (V) with a cut-off of 0.15 as threshold is used to select the optimal number of RGs. After, GeNorm estimates the normalization factor (NFn) using the geometric mean of expression levels of n best reference genes [25]. NormFinder is based on a variance estimation approach, which calculates an expression stability value (SV) for each gene analysed. It enables estimation of the overall variation of the reference genes, taking into account intra and intergroup variations of the sample set. According to this algorithm, genes with lowest SV will be top ranked. BestKeeper tool calculates standard deviation (SD) and the coefficient of variation (CV) based on Cq values of all candidate reference genes [35]. The program compares each reference gene to the BestKeeper Index (BKI) and calculates a Pearson’s correlation coefficient (r) and p-value. Higher correlation coefficients suggest more stable expression. Genes with SD less than 1 and with the highest coefficient of correlation r have the highest stability.
A comprehensive ranking considering the 3 algorithms was established by calculating the arithmetic mean ranking value of each RG genes [37]. Each gene was ranked from 1 (most stable) to 8 (least stable) (Table S1).
Data Analysis and Normalization of PR10, Subtilisin and CYP
Reference gene selection was performed with the three statistical algorithms (GeNorm, NormFinder and Bestkeeper). Cq values from each candidate RG were log-transformed for GeNorm v. 3.5 and NormFinder analysis, while raw Cq values were used for Bestkeeper. After selecting RGs, two normalization strategies were tested: (1) using the 3 top genes given by a comprehensive ranking based on the three methods (GeNorm, NormFinder and BestKeeper); and (2) using the optimal number of RGs based on GeNorm pairwise variation value (the 0.15 cut-off value was followed).
For normalization, Cq values were converted into relative quantities (RQ) by the delta-Ct method [38], incorporating the calculated amplification efficiency (E) for each primer pair [39]. The formula RQ = EΔCq, being the ΔCt calculated as Ct from control samples minus Ct of treated samples was used for both RG and GOI calculations. A normalization factor calculated as the geometric mean of the relative expression of the RGs selected for each normalization strategy was used to obtain the normalized relative quantities (NRQ) [40]. Finally, to obtain GOIs fold expression, the ratio between the RQ values of each gene of interest with NRQ for each normalization strategy was performed.
The expression of three defense-related genes encoding for a pathogenesis related protein 10 (PR10, HS075818), a subtilisin-like protease (subtilisin, HS977208) and cyclophilin (CYP, CF609761) (Table 1) was further analysed in both datasets (genotype and biotic stress). Also, data described by Figueiredo et al. [2] on PR10, CYP and Subtilisin expression at 6 and 12 hpi, allowed to validate the selected RGs for the genotype effect dataset.
Statistical significance (p<0.05) between the two normalization strategies was determined by the Mann-Whitney U test using IBM® SPSS® Statistics version 20.0 (SPSS Inc., USA) software.
Results
Selection of Candidate Reference Genes and Amplification Specificity
Nowadays, data normalization using a set of reference genes is considered to be the gold standard method for accurate measurement of qPCR expression levels of target transcripts [41]. RNA quality is one of the crucial parameters that must be addressed in a gene expression profiling experiment [42]. In the present study, all samples were analysed spectrophotometrically and in agarose gels showing absorbance ratios at 260/280 and 260/230 nm above 1.8, well-defined bands corresponding to the rRNA and absence of nucleic acid degradation. To confirm the absence of contaminating gDNA, positive and no RT controls were used for each candidate gene amplification. DNase treatment (On-Column DNase I Digestion, Sigma-Aldrich) was followed by a careful check for the absence of gDNA through qPCR analysis of a target on the crude RNA [32].
In qPCR, when using a SYBR Green approach, amplification specificity of several genes should be supported by both melting curve and gel electrophoresis [20]. In our samples, single PCR amplification products with the expected size for each gene were found (Fig. 1). Melting curves of the genes tested were analysed to detect the absence/presence of primer dimer or non-specific PCR products (Fig. S1). For VATP16 and UQCC, melting curves profiles revealed non-specific amplification and primer dimer formation on the amplicon region (Fig. S1). Primers targeting PTB2PTB2 revealed high Cq values characteristic of low abundance transcript, particularly on inoculated samples of both grapevine genotypes. Thus, VATP16, UQCC and PTB2PTB2 were excluded from analysis (Table 1). For all remaining genes, no-template controls (NTCs) had no Cq values or the Cq values ranged between 29 and 34 Cq. Since no amplicon peak was obtained from melting curve analysis, the Cq values observed on NTCs were attributed to primer dimer formation/hairpins, and thus disregarded (Fig. S1).
Figure 1. Agarose gel (3%) electrophoresis showing amplicon size for eleven candidate reference genes.

M- O’GeneRuler™ 1 kb DNA Ladder Plus (Fermentas), 1- UBQ, 2- SAND, 3- ACT, 4- NTC VATP16, 5- VATP16, 6- PTB2, 7- PSAB, 8- SMD3, 9- EF1α, 10–60 S, 11- GAPDH, 12- NTC UQCC, 13- UQCC.
PCR efficiency of each primer pair was calculated through the standard curve method using the pool of all cDNA samples in a ten-fold serial dilution. The amplification efficiency (E) of the reactions ranged from 1.907 (90.69%) to 1.992 (99.20%), with correlation coefficients R2 varying from 0.993 to 0.998 (Table 1). To account that any variation between biological replicates was not due to the treatments but intrinsic to the gene itself, data from the biological replicates were analysed separately by statistical algorithms [43], [44]. The expression stability of the remaining eight candidate genes was evaluated by three different statistical applets: GeNorm, NormFinder and BestKeeper. The analysis was performed for two comparison groups considering genotype and biotic stress effects.
Biotic Stress Effect
To study the biotic stress effect: each cultivar inoculated with P. viticola was compared to a control sample (mock inoculated) at each inoculation time-point (6, 12, 18 and 24 hpi). For V. vinifera cv. Trincadeira inoculated with downy mildew, GeNorm ranked SAND and EF1α (M = 0.881, Table 2) as the most stable genes. NormFinder selected SMD3 (SV = 0.454) as the most stable gene followed by EF1α and SAND (SV = 0.722 and SV = 0.727, respectively). Likewise, SMD3 (SD = 0.66, r = 0.76, Table 2) was identified as the most suitable gene for qPCR normalization by BestKeeper analysis, while EF1 α (SD = 0.86, r = 0.87) and SAND (SD = 0.92, r = 0.74) were ranked in the third and fifth positions, respectively. Overall, EF1α, SAND and SMD3 were the most stable set of genes for V. vinifera cv Trincadeira.
Table 2. Candidate reference genes for Biotic Stress effect in V. vinifera cv Trincadeira calculated by the GeNorm, NormFinder and BestKeeper.
| Candidate genes | Trincadeira | |||
| GeNorm | NormFinder | BestKeeper | ||
| M | SV | SD | r | |
| SAND | 0.881 (1/2) | 0.727 (3) | 0.92 (5) | 0.74* |
| EF1α | 0.881(1/2) | 0.722 (2) | 0.86 (3) | 0.87* |
| SMD3 | 0.975 (3) | 0.454 (1) | 0.66 (1) | 0.76* |
| ACT | 1.038 (4) | 0.849 (5) | 0.92 (4) | 0.75* |
| UBQ | 1.088 (5) | 1.231 (6) | 1.00 (6) | 0.58* |
| GAPDH | 1.158 (6) | 0.813 (4) | 0.84 (2) | 0.81* |
| 60 S | 1.305 (7) | 1.511 (7) | 1.09 (8) | 0.25* |
| PsaB | 1.470 (8) | 1.799 (8) | 1.41 (7) | 0.74* |
SV. stability value; SD, standard deviation of Cq value; r. Pearson coefficient of correlation; * p≤0.001. p-value associated with the Pearson coefficient of correlation. Ranking order is presented in parenthesis.
For V. vinifera cv Regent, UBQ and EF1α (M = 0.920, Table 3) appeared as the most stable genes considering GeNorm analysis. BestKeeper selected, GAPDH (SD = 0.66, r = 0.82) as the most stable gene, followed by EF1α and UBQ (SD = 0.87 and SD 0.92, respectively). Interestingly, GAPDH was also found to be the most stable gene with NormFinder analysis. EF1α appeared in the third position after SMD3 (Table 3), while UBQ was set in the fourth/fifth position together with ACT (SV = 0.869). Considering the three algorithms, EF1α, GAPDH and UBQ were selected as the most suitable RGs for V. vinifera cv Regent.
Table 3. Candidate reference genes for Biotic Stress effect in V. vinifera cv Regent calculated by the GeNorm, NormFinder and BestKeeper.
| Candidategenes | Regent | |||
| GeNorm | NormFinder | BestKeeper | ||
| M | SV | SD | R | |
| EF1α | 0.920 (1) | 0.812 (3) | 0.87 (2) | 0.91* |
| UBQ | 0.920 (2) | 0.869 (4/5) | 0.92 (3) | 0.73* |
| SMD3 | 1.057 (3) | 0.731 (2) | 0.53(4) | 0.50 |
| GAPDH | 1.153 (4) | 0.579 (1) | 0.66 (1) | 0.82* |
| ACT | 1.184 (5) | 0.869 (4/5) | 1.01 (6) | 0.66* |
| SAND | 1.260 (6) | 1.476 (6) | 1.13 (8) | 0.76* |
| 60 S | 1.413 (7) | 1.509 (7) | 1.03 (7) | 0.23 |
| PsaB | 1.711 (8) | 2.529 (8) | 0.87 (5) | 0.36 |
SV. stability value; SD, standard deviation of Cq value; r. Pearson coefficient of correlation;
p≤0.001. p- value associated with the Pearson coefficient of correlation. Ranking order is presented in parenthesis.
Genotype Effect
In order to evaluate the genotype effect on RG stability both cultivars were directly compared prior (0 h) and after inoculation with P. viticola (6, 12, 18 and 24 hpi). GeNorm selected, EF1α and UBQ (M = 0.775) as the two most stable genes (Table 4). The BestKeeper analysis ranked UBQ as the most stable gene (SD = 0.77), followed by GAPDH (SD = 0.59) and EF1α (SD = 0.93). ACT was excluded due to a low Pearson correlation (r = 0.56, p>0.001, Table S3). The candidate genes SAND, 60 S, and PsaB presented SD values higher than 1 (Table 4) and therefore were considered unstable. NormFinder ranked UBQ (SV = 0.581) as the most stable gene, while GAPDH (SV = 0.668) and EF1α (SV = 0.775) were placed on the second and fourth position, respectively. All three statistical algorithms pointed UBQ as the best reference gene for normalizing qPCR genotype data (Table 4).
Table 4. Candidate reference genes for Genotype effect as calculated by the GeNorm, NormFinder and BestKeeper programs.
| Candidate Genes | GeNorm | NormFinder | BestKeeper | |
| M | SV | SD | r | |
| UBQ | 0.775 (1/2) | 0.581 (1) | 0.77 (1) | 0.90* |
| EF1α | 0.775 (1/2) | 0.775 (4) | 0.93 (3) | 0.88* |
| SAND | 0.939 (3) | 1.023 (5) | 1.19 (8) | 0.85* |
| SMD3 | 1.077 (4) | 0.669 (3) | 0.66 (4) | 0.56 |
| GAPDH | 1.118 (5) | 0.668 (2) | 0.59 (2) | 0.74* |
| ACT | 1.156 (6) | 0.869 (5) | 0.85 (5) | 0.56 |
| 60 S | 1.292 (7) | 1.617 (7) | 1.03 (6) | 0.90* |
| PsaB | 1.525 (8) | 2.144 (8) | 1.11 (7) | 0.57 |
SV, stability value; SD, standard deviation of Cq value; r, Pearson coefficient of correlation;
p≤0.001. p,value associated with the Pearson coefficient of correlation. Ranking order is presented in parenthesis.
Determination of the Optimal Number of Reference Genes for Normalization by GeNorm
It was suggested that normalization using multiple reference genes gives more accurate results [32]. The GeNorm V value determines the optimal number of RGs to be used, following a 0.15 cut-off value below which the inclusion of an additional reference gene is not required [32].
The V values were determined for the experimental datasets: biotic stress effect (TmTi: comparison between Trincadeira mock and inoculated samples; RmRi: comparison between Regent mock and inoculated samples) and genotype effect (Fig. 2). The optimal number of reference genes to be used for normalization differed between the analysed datasets. Considering biotic stress, for Trincadeira, the V did not reach the cut-off value (TmTi, Fig. 2), being five genes (V = 0.178) necessary for an accurate normalization, for Regent (RmRi, Fig. 2) four genes are necessary for qPCR normalization (V4/5 and V5/6 = 0.199). Considering the genotype effect, six genes (V6/7 = 0.134) (Fig. 2) should be used to accomplish an accurate qPCR normalization.
Figure 2. Pairwise variation (V) of candidate genes as predicted by GeNorm.
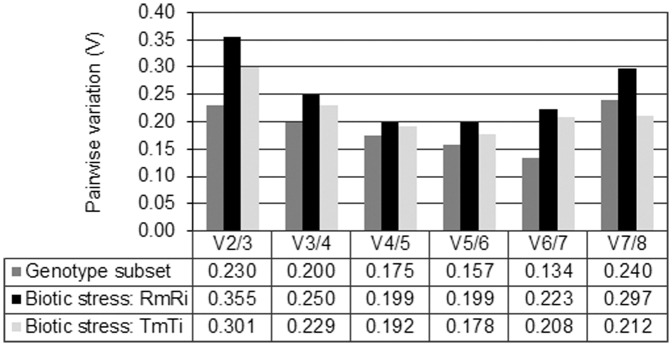
The pairwise variation (Vn/Vn+1) was calculated between the normalization factors NFn and NFn+1. Each pairwise variation value is compared with a recommended cut-off value 0.15, below which the inclusion of an additional reference gene is not required.
PR10, CYP and Subtilisin Expression
Two normalization strategies were followed to determine the expression of 3 defense-related genes (PR10, CYP and subtilisin): (1) using the 3 top RGs given by a comprehensive ranking from the three methods (GeNorm, NormFinder and BestKeeper), and (2) using the optimal number of reference genes selected by the GeNorm V value for each condition studied (pairwise variation analysis, Fig. 2).
Biotic stress
For V. vinifera cv Trincadeira, EF1α, SAND and SMD3 were selected as the three top ranked genes for normalization by the combination of the three methods. Additionally, the top five ranked EF1α, SAND, SMD3, ACT and UBQ genes from GeNorm pairwise analysis were also tested for qPCR normalization (Fig. 3A).
Figure 3. CYP, subtilisin, PR10 expression in Biotic Stress effect when comparing independently Trincadeira (a) and Regent (b).

Two normalization strategies are presented. Fold Change: expression of inoculated leaves (6, 12, 18 and 24 hpi) divided by mock inoculated samples. Asterisks indicate significant differences between each normalization strategy. RG, reference gene. Median and MAD (mean absolute deviation) values of three biological replicates are presented.
In V. vinifera cv Regent, EF1α, GAPDH and UBQ were used as the three top ranked genes, while EF1α, UBQ, SMD3 and GAPDH genes retrieved from the pairwise analysis (V4/5) were tested as a second normalization strategy (Fig. 3B). For both genotypes, the expression profile of the different GOIs tested was similar using the two normalization approaches (Fig. 3A, B). CYP appeared downregulated until 24 hpi in Trincadeira, while in Regent it is downregulated until 18 hpi and at 24 hpi the expression decreases again. Subtilisin was upregulated in both genotypes, showing the greater fold change in Regent at 6 hpi and in Trincadeira at 24 hpi. PR10 was equally over-expressed in both genotypes during downy mildew infection time-course.
Genotype effect
UBQ, EF1α and GAPDH were selected as RGs from a combined analysis using GeNorm, NormFinder and BestKeeper. The GeNorm pairwise analysis (Fig. 2) selected UBQ, EF1α, SAND, SMD3, GAPDH and ACT for normalization (Table 4). Overall, the CYP, subtilisin and PR10 expression profile was similar with the two normalization strategies tested, with the exception of CYP at 0 h (Fig. 4). In the resistant cultivar there is an upregulation of the expression of the three GOIs after P. viticola inoculation, when compared to Trincadeira (Fig. 4). Interestingly, subtilisin is constitutively more expressed in Regent than in Trincadeira (0 h, Fig.4).
Figure 4. Fold change variation when comparing Regent and Tricadeira prior and during inoculation time-course for subtilisin, CYP and PR10.

Two normalization strategies are presented. Fold Change: expression of Regent samples divided by Trincadeira samples. Asterisks indicate significant differences between each normalization strategy. RG, reference gene. Median and MAD (mean absolute deviation) values of three biological replicates are presented.
Discussion
Normalization is one of the key factors affecting the accuracy and reliability of quantitative gene expression analysis. Here, we describe an assessment of eleven reference genes for their use as internal controls in gene expression studies for the first hours of interaction between grapevine and Plasmopara viticola. Two datasets were used representing two different experimental designs: the first dataset compares each genotype with control samples (mock inoculated) during inoculation time-course (biotic stress effect), while the second dataset compares directly a resistant and a susceptible cultivar prior and after P. viticola inoculation evaluating the genotype effect on plant defence response.
Studies using a combination of GeNorm, BestKeeper, and NormFinder for selecting reference genes have described minor to substantial discrepancies in the results of the three programs, which may be easily explained by the different mathematical models associated with each approach [26], [45]. In our study, no substantial differences were obtained in the ranking of candidate reference genes when using the three statistical algorithms. A comprehensive ranking considering the three algorithms was performed and results revealed to be consistent with those of GeNorm analysis, only differing on the ranking orders of the most stable genes (Table S1). Some of the candidates were repeatedly ranked in the last positions, regardless the dataset under analysis: PsaB and 60 S. PsaB, is the Vitis homolog of the Arabidopsis ATCg00340 locus, which was previously reported as a potential RG in biotic stress studies [33], revealed to be unsuitable for our experiment. Also, 60 S was not stable for the first hours of interaction between the susceptible V. vinifera cv. Trincadeira and P. viticola, despite being previously reported as one of the most stable genes for susceptible V. vinifera cv. Marselan leaves inoculated with P. viticola from 1 to 7 days [28]. The early time-points used in our study may account for this difference. In our study and regardless the genotype, EF1α was selected as the most stable gene for the first hours of grapevine-downy mildew interaction. EF1α was also selected as the most stable gene for late blight infection of potato [46]. However, recent studies with V. vinifera cv Riesling inoculated with downy mildew pointed EF1α as one of the least stable reference genes in a 1–5 dpi time-course experiment [29]. These results reinforce the need for systematic selection of stable reference genes for each experimental condition tested.
Several studies have been performed on grapevine resistance response towards P. viticola, transcripts as PR10, subtilisin-like protein and CYP have been pointed out as defense and signalling candidate genes for downy mildew resistance [1], [2], [4], [5], [7]. Subtilisin-like proteins seem to be involved in pathogen recognition leading to further induction of defense responses [47]–[52]. Cyclophilins have been shown to accumulate upon fungal infection [53], [54] and to play an important role in signal transduction under stressful conditions [55]. PR10 family is one of the most important proteins in response to fungal invasion [56] and on other biotic or abiotic stresses [57].
Considering the genotype effect, a recent study by Figueiredo et al. [2] allowed us to validate the RGs selected at 6 and 12 hpi. When comparing Regent to Trincadeira, PR10, subtilisin and CYP are over-expressed in Regent at 6 and 12 hpi which is in accordance with [2]. The expression of these three genes was also accessed for the remaining time-points. During inoculation time-course, for PR10, CYP and subtilisin expression, both normalization strategies showed the same trend: upregulation in the resistant cultivar (Fig. 4). Prior to inoculation (0 h), subtilisin expression is consistent to [1], however different expression was obtained with the two normalization strategies for CYP expression, upregulation using the three best genes and downregulation with the pairwise analysis selected genes (Fig. 4). As CYP expression at 0 h using the 3 best RGs is consistent with [1], we may consider that, in our study the normalization strategy using the 3 best RGs is more accurate.
Considering the biotic stress effect, PR10 appeared upregulated in both genotypes, when compared to mock inoculated samples, during inoculation time-course, which is in accordance to previous works [4],[5]. Cyclophilin was downregulated in both genotypes at 6 and 12 hpi. At 18 hpi, a1.71-fold increase of CYP in Regent was obtained (Fig. 3B), while in Trincadeira a 2.6-fold increase only occurred at 24 hpi (Fig. 3A). As cyclophilins were shown to play a role in signal transduction under stressful conditions [55], the earlier expression peak (18 hpi) observed in the resistant genotype (Regent) may be associated to a faster pathogen recognition and/or defense response activation. Subtilisin-like protein was highly transcribed in Regent at 6 hpi when compared to the control samples, while in Trincadeira the increased in transcription only occurred at 24 hpi. We may hypothesize, as suggested by Figueiredo et al. [2], that subtilisin is participating in pathogen recognition and on the activation of the defence response. As a result, Regent could recognize the pathogen and thus reacts to its invasion faster than Trincadeira, which may account for its increased resistance towards this pathogen [2].
A nonparametric test was used to compare the two normalization strategies (Table S2) in order to determine significant differences in the expression of the GOIs. As no statistically differences were found, we may assume that for an accurate normalization, in our experimental conditions, the top three RGs selected by the combination of GeNorm, NormFinder and BestKeeper are appropriate. In summary, UBQ, EF1α and GAPDH should be used when directly comparing Regent to Trincadeira prior and during inoculation time-course (genotype effect), EF1α, SAND and SMD3 should be used for Trincadeira data normalization and EF1α, GAPDH and UBQ for Regent data normalization (Biotic stress effect). The proposed RGs are a valuable genomic source to study the early kinetics of plant-pathogen interaction and could be a good starting point for gene expression studies for other grapevine genotypes with similar response to downy mildew. Our results clearly showed that RGs are genotype-dependent and that different RGs should be used for normalization of qPCR studies in compatible and incompatible interactions.
Supporting Information
Primer specificity test through dissociation curve analysis collected from StepOne™ software ver. 2.2.2 (Applied Biosystems). UBQ (A), SAND (B), ACT (C), VATP16 (D), PTB2 (E), PsaB (F), SMD3 (G), EF1α (H), 60 S (I), GAPDH (J) and UQCC (K). Non-template control is indicated by a black arrow.
(PDF)
Comprehensive ranking of the candidate RGs calculated as the arithmetic mean ranking value of each gene using the three applets. Genes were ranked from the most stable (1) to the least stable (8).
(XLS)
Test statistics and Ranks given by the Mann-Whitney U test on PR10 , subtilisin and CYP expression, comparing the two normalization strategies followed.
(XLSX)
Descriptive statistics of reference gene expression in all datasets analysed based on the BestKeeper approach.
(PDF)
Acknowledgments
The authors wish to acknowledge Dr. Eva Zyprian and Dr. Martina Bonow-Rex from JKI, Institute for Grapevine Breeding, Geilweilerhof for all the help provided in grapevine inoculation experiments and Dr. Lisete Sousa from Department of Statistics and Operations Research, FCUL for mathematical and statistical advices.
Funding Statement
This work was supported by the Portuguese Foundation for Science and Technology within the frame of the project PTDC/AGR-GPC/119753/2010, with the fellowship SFRH/BPD/25661/2005 to MS and SFRH/BPD/63641/2009 to AF and BIOFIG PEst-OE/BIA/UI4046/2011. The funders had no role in study design, data collection and analysis, decision to publish, or preparation of the manuscript.
References
- 1. Figueiredo A, Fortes A, Ferreira S, Sebastiana M, Choi Y, et al. (2008) Transcriptional and metabolic profiling of grape (Vitis vinifera L.) leaves unravel possible innate resistance against pathogenic fungi. J Exp Bot 59: 3371–3381. [DOI] [PubMed] [Google Scholar]
- 2. Figueiredo A, Monteiro F, Fortes A, Bonow-Rex M, Zyprian E, et al. (2012) Cultivar-specific kinetics of gene induction during downy mildew early infection in grapevine. Funct Integr Genomics 12: 379–386. [DOI] [PubMed] [Google Scholar]
- 3. Kortekamp A, Welter L, Vogt S, Knoll A, Schwander F, et al. (2008) Identification, isolation and characterization of a CC-NBS-LRR candidate disease resistance gene family in grapevine. Mol Breed 22: 421–432. [Google Scholar]
- 4. Polesani M, Desario F, Ferrarini A, Zamboni A, Pezzotti M, et al. (2008) CDNA-AFLP analysis of plant and pathogen genes expressed in grapevine infected with Plasmopara viticola . BMC Genomics 9: 142 doi:10.1186/1471-2164-9-142 [DOI] [PMC free article] [PubMed] [Google Scholar]
- 5. Polesani M, Bortesi L, Ferrarini A, Zamboni A, Fasoli M, et al. (2010) General and species-specific transcriptional responses to downy mildew infection in a susceptible (Vitis vinifera) and a resistant (V. riparia) grapevine species. BMC Genomics 11: 117 doi:10.1186/1471-2164-11-117 [DOI] [PMC free article] [PubMed] [Google Scholar]
- 6. Wu J, Zhang Y, Zhang H, Huang H, Folta K, et al. (2010) Whole genome wide expression profiles of Vitis amurensis grape responding to downy mildew by using Solexa sequencing technology. BMC Plant Biol 10: 234 doi:10.1186/1471-2229-10-234 [DOI] [PMC free article] [PubMed] [Google Scholar]
- 7. Malacarne G, Vrhovsek U, Zulini L, Cestaro A, Stefanini M, et al. (2011) Resistance to Plasmopara viticola in a grapevine segregating population is associated with stilbenoid accumulation and with specific host transcriptional responses. BMC Plant Biol 11: 114 doi:–––10.1186/1471–2229–11–114 [DOI] [PMC free article] [PubMed] [Google Scholar]
- 8. Dalbó M, Ye G, Weeden N, Steinkellner H, Sefc K, et al. (2000) A gene controlling sex in grapevines placed on a molecular marker-based genetic map. Genome 43: 333–340. [PubMed] [Google Scholar]
- 9. Kortekamp A, Zyprian E (2003) Characterization of Plasmopara-resistance in grapevine using in vitro plants. J Plant Physiol 160: 1393–1400. [DOI] [PubMed] [Google Scholar]
- 10.Merdinoglu D, Wiedemann-Merdinoglu S, Coste P, Dumas V, Haetty S, et al. (2003) Genetic analysis of downy mildew resistance derived from Muscadinia rotundifolia. Acta Hortic 451–456.
- 11. Fischer B, Salakhutdinov I, Akkurt M, Eibach R, Edwards K, et al. (2004) Quantitative trait locus analysis of fungal disease resistance factors on a molecular map of grapevine. Theor Appl Genet 108: 501–515. [DOI] [PubMed] [Google Scholar]
- 12. Welter L, Gokturk-Baydar N, Akkurt M, Maul E, Eibach R, et al. (2007) Genetic mapping and localization of quantitative trait loci affecting fungal disease resistance and leaf morphology in grapevine (Vitis vinifera L). Mol Breed 20: 359–374. [Google Scholar]
- 13. Jürges G, Kassemeyer H, Durrenberger M, Duggelin M, Nick P (2009) The mode of interaction between Vitis and Plasmopara viticola Berk. & Curt. Ex de Bary depends on the host species. Plant Biol 11: 886–898. [DOI] [PubMed] [Google Scholar]
- 14. Peressotti E, Wiedemann-Merdinoglu S, Delmotte F, Bellin D, Di Gaspero G, et al. (2010) Breakdown of resistance to grapevine downy mildew upon limited deployment of a resistant variety. BMC Plant Biol 10: 147 doi:10.1186/1471-2229-10-147 [DOI] [PMC free article] [PubMed] [Google Scholar]
- 15. Bellin D, Peressotti E, Merdinoglu D, Wiedemann-Merdinoglu S, Adam-Blondon A, et al. (2009) Resistance to Plasmopara viticola in grapevine ‘Bianca’ is controlled by a major dominant gene causing localised necrosis at the infection site. Theor Appl Genet 120: 163–176. [DOI] [PubMed] [Google Scholar]
- 16. Blasi P, Blanc S, Wiedemann-Merdinoglu S, Prado E, Ruhl E, et al. (2011) Construction of a reference linkage map of Vitis amurensis and genetic mapping of Rpv8, a locus conferring resistance to grapevine downy mildew. Theor Appl Genet 123: 43–53. [DOI] [PubMed] [Google Scholar]
- 17. Schwander F, Eibach R, Fechter I, Hausmann L, Zyprian E, et al. (2012) Rpv10: a new locus from the Asian Vitis gene pool for pyramiding downy mildew resistance loci in grapevine. Theor Appl Genet 124: 163–176. [DOI] [PubMed] [Google Scholar]
- 18. Bustin S (2000) Absolute quantification of mRNA using real-time reverse transcription polymerase chain reaction assays. J Mol Endocrinol 25: 169–193. [DOI] [PubMed] [Google Scholar]
- 19. Bustin S (2002) Quantification of mRNA using real-time reverse transcription PCR (RT-PCR): trends and problems. J Mol Endocrinol 29: 23–39. [DOI] [PubMed] [Google Scholar]
- 20. Derveaux S, Vandesompele J, Hellemans J (2010) How to do successful gene expression analysis using real-time PCR. Methods 50: 227–230. [DOI] [PubMed] [Google Scholar]
- 21. Bustin S, Benes V, Nolan T, Pfaffl M (2005) Quantitative real-time RT-PCR - a perspective. J Mol Endocrinol 34: 597–601. [DOI] [PubMed] [Google Scholar]
- 22. Huggett J, Dheda K, Bustin S, Zumla A (2005) Real-time RT-PCR normalisation; strategies and considerations. Genes Immun 6: 279–284. [DOI] [PubMed] [Google Scholar]
- 23. Fleige S, Walf V, Huch S, Prgomet C, Sehm J, et al. (2006) Comparison of relative mRNA quantification models and the impact of RNA integrity in quantitative real-time RT-PCR. Biotechnol Lett 28: 1601–1613. [DOI] [PubMed] [Google Scholar]
- 24. Schmittgen T, Zakrajsek B (2000) Effect of experimental treatment on housekeeping gene expression: validation by real-time, quantitative RT-PCR. J Bioch Biophys Methods 46: 69–81. [DOI] [PubMed] [Google Scholar]
- 25. Vandesompele J, De Preter K, Pattyn F, Poppe B, Van Roy N, et al. (2002) Accurate normalization of real-time quantitative RT-PCR data by geometric averaging of multiple internal control genes. Genome Biol 3(7): RESEARCH0034. [DOI] [PMC free article] [PubMed] [Google Scholar]
- 26. Reid K, Olsson N, Schlosser J, Peng F, Lund S (2006) An optimized grapevine RNA isolation procedure and statistical determination of reference genes for real-time RT-PCR during berry development. BMC Plant Biology 6: 27 doi:10.1186/1471-2229-6-27 [DOI] [PMC free article] [PubMed] [Google Scholar]
- 27. Coito JL, Rocheta M, Carvalho L, Amancio S (2012) Microarray-based uncovering reference genes for quantitative real time PCR in grapevine under abiotic stress. BMC Res Notes 5: 220 doi:10.1186/1756-0500-5-220 [DOI] [PMC free article] [PubMed] [Google Scholar]
- 28. Gamm M, Heloir MC, Kelloniemi J, Poinssot B, Wendehenne D, et al. (2011) Identification of reference genes suitable for qRT-PCR in grapevine and application for the study of the expression of genes involved in pterostilbene synthesis. Mol Genet Genomics 285: 273–285. [DOI] [PubMed] [Google Scholar]
- 29. Selim M, Legay S, Berkelmann-Lohnertz B, Langen G, Kogel KH, et al. (2012) Identification of suitable reference genes for real-time RT-PCR normalization in the grapevine-downy mildew pathosystem. Plant Cell Rep 31: 205–216. [DOI] [PubMed] [Google Scholar]
- 30. Akkurt M, Welter L, Maul E, Töpfer R, Zyprian E (2007) Development of SCAR markers linked to powdery mildew (Uncinula necator) resistance in grapevine (Vitis vinifera L. and Vitis sp.). Mol Breed 19: 103–111. [Google Scholar]
- 31.Anonymous (2000) Description list of varieties–grapes 2000. Federal Office of Plant Varieties (ed.), Hannover: Landburh Verlog.
- 32. Vandesompele J, De Paepe A, Speleman F (2002) Elimination of primer-dimer artifacts and genomic coamplification using a two-step SYBR green I real-time RT-PCR. Anal Biochem 303(1): 95–98. [DOI] [PubMed] [Google Scholar]
- 33. Czechowski T, Stitt M, Altmann T, Udvardi MK, Scheible WR (2005) Genome-wide identification and testing of superior reference genes for transcript normalization in Arabidopsis . Plant Physiol 139(1): 5–17. [DOI] [PMC free article] [PubMed] [Google Scholar]
- 34. Trouvelot S, Varnier AL, Allegre M, Mercier L, Baillieul F, et al. (2008) A beta-1,3 glucan sulfate induces resistance in grapevine against Plasmopara viticola through priming of defense responses, including HR-like cell death. Mol Plant Microbe Interact 21: 232–243. [DOI] [PubMed] [Google Scholar]
- 35. Pfaffl MW, Tichopad A, Prgomet C, Neuvians TP (2004) Determination of stable housekeeping genes, differentially regulated target genes and sample integrity: BestKeeper–Excel-based tool using pair-wise correlations. Biotechnol Lett 26: 509–515. [DOI] [PubMed] [Google Scholar]
- 36. Andersen C, Jensen J, Orntoft T (2004) Normalization of real-time quantitative reverse transcription-PCR data: A model-based variance estimation approach to identify genes suited for normalization, applied to bladder and colon cancer data sets. Cancer Res 64: 5245–5250. [DOI] [PubMed] [Google Scholar]
- 37. Wang Q, Ishikawa T, Michiue T, Zhu BL, Guan DW, et al. (2012) Stability of endogenous reference genes in postmortem human brains for. Int J Legal Med 126: 943–952. [DOI] [PubMed] [Google Scholar]
- 38. Livak KJ, Schmittgen TD (2001) Analysis of relative gene expression data using real-time quantitative PCR and the 2(-Delta Delta C(T)) Method. Methods 25(4): 402–408. [DOI] [PubMed] [Google Scholar]
- 39. Pfaffl MW (2001) A new mathematical model for relative quantification in real-time RT-PCR. Nucleic Acids Res 29: e45. [DOI] [PMC free article] [PubMed] [Google Scholar]
- 40. Hellemans J, Mortier G, De Paepe A, Speleman F, Vandesompele J (2007) qBase relative quantification framework and software for management and automated. Genome Biol 8: R19 doi:10.1186/gb-2007-8-2-r19 [DOI] [PMC free article] [PubMed] [Google Scholar]
- 41. Bustin SA (2010) Developments in real-time PCR research and molecular diagnostics. Expert Rev Mol Diagn 10: 713–715. [DOI] [PubMed] [Google Scholar]
- 42. Bustin SA, Nolan T (2004) Pitfalls of quantitative real-time reverse-transcription polymerase chain reaction. J Biomol Tech 15(3): 155–166. [PMC free article] [PubMed] [Google Scholar]
- 43. Remans T, Smeets K, Opdenakker K, Mathijsen D, Vangronsveld J, et al. (2008) Normalisation of real-time RT-PCR gene expression measurements in Arabidopsis thaliana exposed to increased metal concentrations. Planta 227: 1343–1349. [DOI] [PubMed] [Google Scholar]
- 44. Castro P, Román B, Rubio J, Die J (2012) Selection of reference genes for expression studies in Cicer arietinum L.: analysis of cyp81E3 gene expression against Ascochyta rabiei . Mol Breed 29: 261–274. [Google Scholar]
- 45. Liu D, Shi L, Han C, Yu J, Li D, et al. (2012) Validation of Reference Genes for Gene Expression Studies in Virus-Infected Nicotiana benthamiana Using Quantitative Real-Time PCR. PLoS One 7(9): e46451 doi:10.1371/journal.pone.0046451 [DOI] [PMC free article] [PubMed] [Google Scholar]
- 46. Nicot N, Hausman JF, Hoffmann L, Evers D (2005) Housekeeping gene selection for real-time RT-PCR normalization in potato during biotic and abiotic stress. J Exp Bot 56(421): 2907–2914. [DOI] [PubMed] [Google Scholar]
- 47. Tornero P, Conejero V, Vera P (1996) Primary structure and expression of a pathogen-induced protease (PR-P69) in tomato plants: Similarity of functional domains to subtilisin-like endoproteases. Proc Natl Acad Sci USA 93: 6332–6337. [DOI] [PMC free article] [PubMed] [Google Scholar]
- 48. Tornero P, Conejero V, Vera P (1997) Identification of a new pathogen-induced member of the subtilisin-like processing protease family from plants. J Biol Chem 272: 14412–14419. [DOI] [PubMed] [Google Scholar]
- 49. Jordá L, Conejero V, Vera P (2000) Characterization of P69E and P69F, two differentially regulated genes encoding new members of the subtilisin-like proteinase family from tomato plants. Plant Physiol 122: 67–74. [DOI] [PMC free article] [PubMed] [Google Scholar]
- 50. Golldack D, Vera P, Dietz KJ (2003) Expression of subtilisin-like serine proteases in Arabidopsis thaliana is cell-specific and responds to jasmonic acid and heavy metals with developmental differences. Physiol Plant 118(1): 64–73. [DOI] [PubMed] [Google Scholar]
- 51. Coffeen WC, Wolpert TJ (2004) Purification and characterization of serine proteases that exhibit caspase-like activity and are associated with programmed cell death in Avena sativa . The Plant Cell 16(4): 857–873. [DOI] [PMC free article] [PubMed] [Google Scholar]
- 52. van der Hoorn RA, Jones JD (2004) The plant proteolytic machinery and its role in defence. Curr Opin Plant Biol 7(4): 400–407. [DOI] [PubMed] [Google Scholar]
- 53. Godoy A, Lazzaro A, Casalongue C, San Segundo B (2000) Expression of a Solanum tuberosum cyclophilin gene is regulated by fungal infection and abiotic stress conditions. Plant Sci 152: 123–134. [Google Scholar]
- 54. Lee J, Park S, Kim J, Lee S, Park Y, et al. (2007) Molecular and functional characterization of a cyclophilin with antifungal activity from Chinese cabbage. Biochem Bioph Res Commun 353(3): 672–678. [DOI] [PubMed] [Google Scholar]
- 55. Kong HY, Lee SC, BK H (2001) Expression of pepper cyclophilin gene is differentially regulated during the pathogen infection and abiotic stress conditions. Physiol Mol Plant Pathol 59: 189–199. [Google Scholar]
- 56. Xie YR, Chen ZY, Brown RL, Bhatnagar D (2010) Expression and functional characterization of two pathogenesis-related protein 10 genes from Zea mays . J Plant Physiol 67(2): 121–130. [DOI] [PubMed] [Google Scholar]
- 57. Liu J, Ekramoddoullah A (2006) The family 10 of plant pathogenesis-related proteins: Their structure, regulation, and function in response to biotic and abiotic stresses. Physiol Mol Plant Pathol 68: 3–13. [Google Scholar]
Associated Data
This section collects any data citations, data availability statements, or supplementary materials included in this article.
Supplementary Materials
Primer specificity test through dissociation curve analysis collected from StepOne™ software ver. 2.2.2 (Applied Biosystems). UBQ (A), SAND (B), ACT (C), VATP16 (D), PTB2 (E), PsaB (F), SMD3 (G), EF1α (H), 60 S (I), GAPDH (J) and UQCC (K). Non-template control is indicated by a black arrow.
(PDF)
Comprehensive ranking of the candidate RGs calculated as the arithmetic mean ranking value of each gene using the three applets. Genes were ranked from the most stable (1) to the least stable (8).
(XLS)
Test statistics and Ranks given by the Mann-Whitney U test on PR10 , subtilisin and CYP expression, comparing the two normalization strategies followed.
(XLSX)
Descriptive statistics of reference gene expression in all datasets analysed based on the BestKeeper approach.
(PDF)