Abstract
In this study, we developed a social network model of the global trade of maize: one of the most important food, feed, and industrial crops worldwide, and critical to food security. We used this model to analyze patterns of maize trade among nations, and to determine where vulnerabilities in food security might arise if maize availability were decreased due to factors such as diversion to non-food uses, climatic factors, or plant diseases. Using data on imports and exports from the United Nations Commodity Trade Statistics Database for each year from 2000 to 2009 inclusive, we summarized statistics on volumes of maize trade between pairs of nations for 217 nations. There is evidence of market segregation among clusters of nations; with three prominent clusters representing Europe, Brazil and Argentina, and the United States. The United States is by far the largest exporter of maize worldwide, while Japan and the Republic of Korea are the largest maize importers. In particular, the star-shaped cluster of the network that represents US maize trade to other nations indicates the potential for food security risks because of the lack of trade these other nations conduct with other maize exporters. If a scenario arose in which US maize could not be exported in as large quantities, maize supplies in many nations could be jeopardized. We discuss this in the context of recent maize ethanol production and its attendant impacts on food prices elsewhere worldwide.
Keywords: Maize, food security, global trade, network models
1. INTRODUCTION
Recent reports have documented the global concerns of food security and safety in coming years, with increased populations and climate change among the most important risks (1, 2, 3, 4). Even as the world population continues to grow, food supplies face an unknown potential risk, with factors such as drought and heavy precipitation in certain agricultural regions of the world likely to affect both the quantity and quality of cereal and vegetable crops available. Meanwhile, increasing demands for meat in growing economies worldwide, and the use of traditional food crops for fuel, will likely impose further demands upon global cereal and vegetable supplies.
Maize is at the center of global food security, as one of the most important cereal crops in human and animal diets worldwide. Aside from providing nutrients for humans and animals, maize serves as a basic raw material for the production of starch, oil, protein, alcoholic beverages, food sweeteners, and fuel (5). Additionally, it is one of the most widely traded agricultural commodities amongst nations. In many populations worldwide, maize is a dietary staple, making up the primary portion of calories consumed in many lower income countries (5). While some of these countries produce sufficient maize for their populations, others rely on imports or donations of maize. Hence, it becomes a critical food security risk if major producers/exporters of maize worldwide are unable to meet expected demands in other parts of the world, due to plant diseases, increased domestic use of maize for a variety of purposes, or other reasons.
The goal of this study was to examine maize trade patterns worldwide: which nations are trading with each other, the overall volumes of trade, and whether nations tend to trade in “clusters.” The descriptive analysis of these maize trade patterns lead to potential implications for food security risk, which are discussed as well, although food security is not the main focus of this work. Analysis of trade patterns has been the subject of many studies in the literature including ones using gravity models of trade (6,7) and world-economy systems.(8) In gravity models, which have gained empirical success in explaining international trade, the bilateral trade flows are a log-linear function of the gross domestic products (GDP) for different nations, and distance between trading partners is modeled similarly to Newton’s universal gravitation law. The world-economy system is characterized by stratification into a core, semi-periphery and a periphery. Countries owe their wealth or poverty to their position in the world economy.
Hence, we developed a network model of maize exports and imports among nations worldwide, to understand the patterns of maize trade among nations and how clustering patterns of trade may have implications for food security. Social network models have been developed in recent years to explain and predict a variety of phenomena (9), ranging from the spread and control of infectious disease (10,11) to obesity and smoking prevalence in social networks (12,13), and global trade in general (14). In this case, the social network model is helpful in its visual representation of multiple actors in food trade patterns worldwide: to provide insights into the underlying structure of trade flows, to identify key actors within the network whose behaviors may have especially strong influences on the remainder of the network, and to determine other descriptive factors such as whether clustering of actors in trade occurs with implications for the relative independence (or dependence) of these actors on the overall flow of trade in the global system.
2. METHODS
Using data from the United Nations Commodity Trade Statistics Database (15), we summed maize exports and imports by weight, in metric tons, on a nation-by-nation basis for the years 2000–2009. These global maize trade data were used to construct a weighted and directed network model, with nodes representing countries and edges (depicted as arrows) representing export/import connections between the countries with weights equal to amount of maize traded. Weights are represented in the diagram by the thickness of the arrows, and the direction of the arrows denotes the direction of maize trade: each arrow between two nations emerges from the nation exporting the maize, and points to the nation importing the maize. In total, 217 nations were represented in the original network model. A similar maize trade model was developed in Wu and Guclu (16) but with a focus on aflatoxin regulations in maize in different nations worldwide.
Upon developing the network model for maize imports and exports, we analyzed clustering patterns in the network, to examine if nations trade broadly worldwide or if certain clusters amongst small groups of nations emerge. This may have important implications for how food can be supplied in times of scarcity, as well as how food safety regulations may have a broader effect than within the nation in which the regulation originates. The tendency of link formation between neighboring nodes in a network is called clustering (or transitivity). Social networks of friendships, for example, usually have a high degree of clustering, due to the tendency of individuals to introduce their friends to each other. In trading patterns, clustering is high in a group of nations if they all conduct business with each other. Clustering is low if, in the example of our network model, many nations import maize from one source, but hardly any other sources.
We then calculated the import or export degree of each nation: the number of other nations with which each nation has imported and exported maize, respectively, during 2000–2009. In a network model, the degree is the number of edges connected to a particular node. In general, if a nation has a high export degree, then any maize production problem in that nation could potentially affect multiple other nations. These other nations are even more vulnerable if they are not regularly importing maize from other nations worldwide. However, a nation that has a high import degree (importing maize from many nations worldwide) is less at risk of jeopardized maize supplies in the event of maize shortages in one exporting region.
For total volume of maize imports and exports per nation, as well as the import and export degrees of each nation, we calculated descriptive statistics: mean, standard deviation (stdev), median, skewness, kurtosis, and coefficient of variation. Additionally, probability density functions were derived for degree of exports and imports of maize-trading nations. Because the United States emerges as a key actor in the global maize trade network, we conducted additional analyses on the amount of maize supplied by the US to the top maize importers worldwide by year from 2000–2009, and the proportion of total maize traded globally supplied by the US over the last two decades.
3. RESULTS
Table I contains data on the top 20 countries exporting or importing maize worldwide, as well as the number of countries to which or from which it trades. In this table, the total amount of maize traded in metric tons from 2000–2009 is included, as the basis for the ranking. “Export degree” refers to the number of nations to which a nation exported any maize (greater than 1 metric ton total) between 2000 and 2009. Likewise, “Import degree” refers to the number of nations from which a nation purchased maize in a quantity exceeding 1 MT between 2000 and 2009.
Table I.
Characteristics of top maize exporting and maize importing nations worldwide.
| Rank | Top maize-exporting nations and total amount exported 2000–2009, MTs | Top maize-importing nations and total amount imported 2000–2009, MTs | ||||
|---|---|---|---|---|---|---|
| Country | Export degree (#nations) | Total amount (MTs) | Country | Import degree (#nations) | Total amount (MTs) | |
| 1 | USA | 181 | 526,670,541 | Japan | 40 | 170,279,244 |
| 2 | Argentina | 150 | 123,527,253 | S. Korea | 39 | 90,841,881 |
| 3 | France | 122 | 71,269,591 | Mexico | 18 | 69,857,045 |
| 4 | China | 95 | 65,558,093 | Egypt | 53 | 51,446,403 |
| 5 | Brazil | 101 | 54,473,911 | Taiwan | 24 | 47,282,122 |
| 6 | Hungary | 72 | 28,557,159 | Spain | 53 | 45,302,592 |
| 7 | Canada | 108 | 23,311,927 | USA | 66 | 33,978,967 |
| 8 | Ukraine | 72 | 19,568,172 | Netherlands | 62 | 28,629,716 |
| 9 | South Africa | 128 | 15,021,879 | Malaysia | 36 | 27,703,058 |
| 10 | Paraguay | 43 | 12,051,097 | Iran | 32 | 27,178,624 |
| 11 | Mexico | 45 | 11,923,079 | Colombia | 31 | 26,821,972 |
| 12 | India | 85 | 11,738,537 | Canada | 58 | 26,012,453 |
| 13 | Germany | 69 | 10,400,097 | Algeria | 31 | 20,230,143 |
| 14 | Serbia | 38 | 6,797,441 | Italy | 57 | 16,678,997 |
| 15 | Thailand | 70 | 5,366,268 | Germany | 66 | 16,548,899 |
| 16 | Romania | 55 | 4,859,320 | Israel | 41 | 15,658,213 |
| 17 | Switzerland | 53 | 3,620,319 | Saudi Arabia | 46 | 15,613,125 |
| 18 | Netherlands | 86 | 3,601,194 | Portugal | 34 | 14,245,589 |
| 19 | Austria | 52 | 3,394,665 | Morocco | 26 | 14,083,900 |
| 20 | Bulgaria | 47 | 2,962,606 | UK | 56 | 13,815,724 |
Data source: UN Comtrade(15).
The United States is by far the largest exporter of maize worldwide, with a total volume of trade in the past decade exceeding the next largest exporter by over four-fold. Moreover, it has exported maize to more nations than any other maize exporter: 181 nations in total between 2000 and 2009. Argentina, France, China, and Brazil are also large maize exporters. China is the largest of Asian maize-exporting nations; while France and Hungary, despite their relatively smaller geographic size compared with other main exporters, also export large quantities of maize. Indeed, despite the relatively smaller geographic area, multiple European nations are included in the list of the top 20 maize exporters.
Of maize importers, Japan is by far the largest maize-importing nation. The Republic of Korea, Mexico, Egypt, Taiwan, and Spain also import large quantities of maize. Interestingly, Mexico, the third largest importer of maize worldwide, imports maize from only 18 nations (and, as will be seen later, almost entirely from the United States) – the least of any of the other nations among the top 20 importers. North African and Middle Eastern nations make up a substantial proportion of the top maize importers worldwide: Egypt, Iran, Algeria, Israel, Saudi Arabia, and Morocco.
Several countries that are among the top 20 maize exporters are also among the top 20 maize importers. These include the United States, Canada, The Netherlands, Mexico, and Germany. Several explanations may exist for this seeming paradox, such as the policies of individual agreements amongst grain companies in different nations – the aggregated data by nation in this study does not account for trade carried out by individual companies.
Another noteworthy point in Table I is that there is a much larger difference between the amounts of maize exported by the first and the 20th exporters (roughly 527 million MTs from the USA vs. 3 million MTs from Bulgaria) than between the amounts of maize imported by the first and 20th importers (roughly 170 million MTs to Japan vs. 14 million MTs to the United Kingdom). The implication is that there is a very large discrepancy between the nation (or nations) exporting the most maize and the rest of the world.
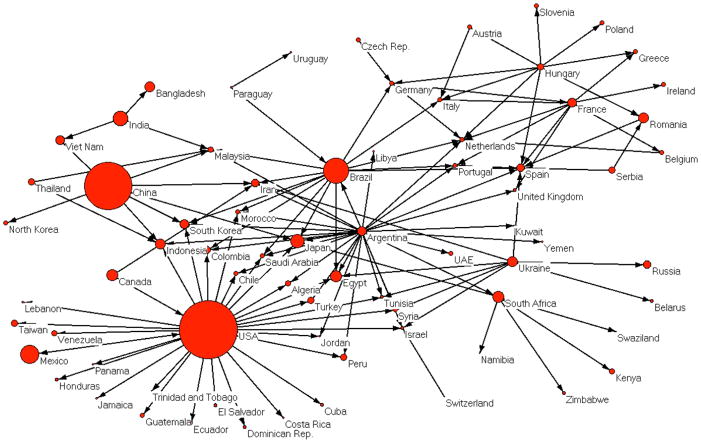
The specific patterns of maize trade between and among nations are shown in the social network model in Fig. 1, with the relative size of export indicated by the size of the node. In this network model, edges were drawn between two nations if they had traded more than 1,000,000 MTs total in 10 years (2000–2009).
Fig. 1.
Global maize trade network, emphasizing top exporters. The node sizes are proportional to the square root of the amount of maize exported from 2000 to 2009.
Examining maize trade through a social network model reveals trends that numbers alone may not. From Fig. 1, it is clear that certain maize trade clusters emerge; centered around three main areas: 1) Europe, 2) Brazil and Argentina and its importers, and 3) the US and its importers.
European nations trade much of their maize amongst each other, although several European nations also import maize from Brazil. A small number of European nations import maize from Argentina. However, none of these European nations imported more than 1,000,000 MTs of maize over ten years from the US, despite the extremely large maize export volume from the USA.
Brazil and Argentina are at the hub of another maize trading cluster. Argentina, in particular, exports maize to many countries all over the world; including in Europe, Asia, Africa, the Americas, and the Middle East. These two nations seem to have largely segregated their patterns of export such that Brazil trades primarily with European nations, while Argentina trades with all other parts of the world (along with several European nations).
The US is at the hub of the third main maize-trading cluster. In Fig. 1, it is the center of a star-shaped topology: it exports maize to a large number of nations, while these importing nations for the most part do not import much maize from other nations. There are several exceptions (e.g., Japan). In general, the US exports the largest volumes of maize to Asian, Middle Eastern, and American nations. Its volume of maize trade with Europe is so small as to not be represented in these network models (where the threshold for inclusion was trading at least 1,000,000 MTs in ten years). Mexico and Canada, though relatively large maize importers, import almost exclusively from the US. This is also the case with many other nations in the Americas.
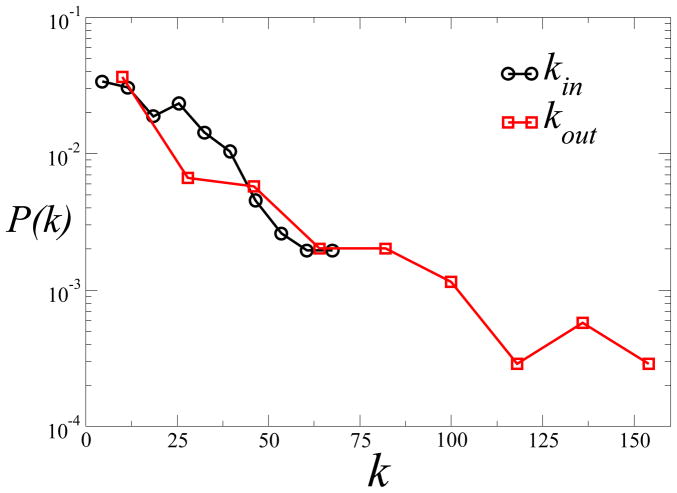
Distributions of export/import degree over the period of 2000–2009 exhibit inverse exponential behavior, as shown in Fig. 2. This figure shows the probability distribution of export and import degrees (out-degree and in-degree): the number of nations to, and from which, each nation exports and imports maize, respectively. What the inverse exponential behaviors indicate is that most nations export to, and import from, a relatively small number of other nations. It is rare to find countries with a high number of trading partners; such as the USA exporting to about 180 countries and Argentina to 150 countries, and again the USA and Germany importing from 66 different countries. The mean export degree for this network is 19.5 (stdev = 29.2), and the mean import degree is 19.5 (stdev = 15.4). Although the means of export degree and import degree are identical over the ten-year period, the variation in the export degree is higher (i.e., there is greater variation among maize-exporting nations in how many other nations import their maize). The implication for nations on the lower end of these distributions is that, for the many nations that export maize from only one nation or a small number of nations, the maize supplies in these nations are vulnerable to any changes in the exporters’ ability to export maize. Additionally, the nations that export to only one or several nations may be vulnerable to changes in demand for maize in these importing nations.
Fig. 2.
Probability distributions for the total import degree (kin), export degree (kout), and logarithms of the export and import volumes for the period of 2000–2009; for all nations importing and exporting maize.
For the total volume of maize exports across nations over the ten years, the mean amount imported was 4.2 million MTs (stdev = 34.0 million MTs), with a median of 182,000 MTs. Likewise, for the total volume of maize imports across nations over the ten years, the mean amount imported was 4.2 million MTs (stdev = 14.4 million MTs), with a median of 182,000 MTs. Other descriptive statistics, including skewness, kurtosis, and coefficient of variation, for these maize export and import volumes and total number of nations traded with for each nation, are shown in Table II. Taken together, these statistics show that the vast majority of nations are exporting to or importing from only one or a small number of nations. However, there is much greater variability with respect to exporting nations: the number of nations to whom they export, and the total amount exported. It may well be that the US is skewing the export data because of the extremely large amount of maize exported over ten years: 527 million MTs compared with a mean of 4.2 million MTs for maize exporters, and 181 trading partners compared with a mean of 19.5 for maize exporters. For importing nations, the upper bound of the range is less extreme; hence, the standard deviations, skewness, kurtosis, and coefficients of variation are correspondingly lower.
Table II.
Descriptive statistics of total export and import amounts of maize across nations in metric tons (MTs), and total number of nations to which each nation exports (export degree) or from which each nation imports (import degree) maize.
| Total export amount (MTs) | Total import amount (MTs) | Export degree (# nations) | Import degree (# nations) | |
|---|---|---|---|---|
| Mean | 4.2 million | 4.2 million | 19.5 | 19.5 |
| Standard dev. | 34 million | 14.4 million | 29.2 | 15.4 |
| Median | 11,600 | 182,000 | 7.0 | 16.0 |
| Skewness | 13.0 | 7.44 | 2.48 | 1.02 |
| Kurtosis | 179 | 69.1 | 7.2 | 0.81 |
| COV | 8.08 | 3.42 | 1.50 | 0.79 |
COV = coefficient of variation.
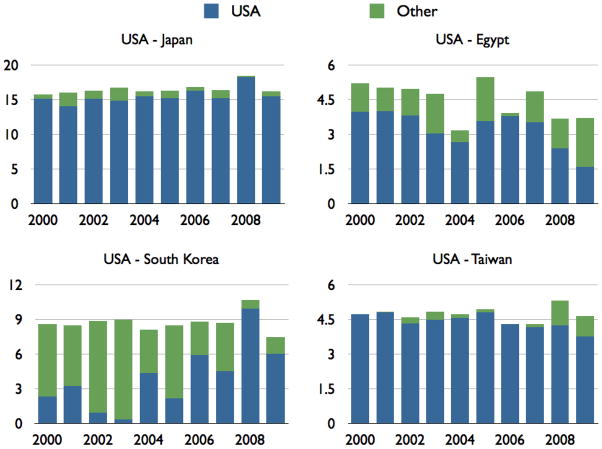
A closer investigation into the export trade of the US to high-volume importers on a yearly basis reveals temporal changes in trade patterns. As can be seen in Fig. 3, we have chosen four countries - Japan, Egypt, South Korea, and Taiwan - which are high-volume maize importers from the US. Japan is by far the largest importer in the world, and more than 90% of its maize consistently came from the US during 2000–2009. Taiwan was in a similar situation until 2007, after which it started exporting about 20% of its maize from other countries. Egypt also experienced a drop in maize imported from the US in the last three years, to 40% from 75% a few years earlier. South Korea was not a major customer for US maize until about 2008, after which the US supplied about 85% of the maize consumed in Korea. We did not include time-dependent maize import data for other major consumers such as Canada and Mexico, because their sole maize provider was the US during 2000–2009 (consistently more than 99% each year). These results suggest that, of the top five maize importing nations worldwide, four of them are very heavily dependent upon US maize exports, and have stayed this way or are increasingly this way over the last decade. Hence, US maize exports play a critical role in ensuring maize security for top maize importers.
Fig. 3.
Maize export volume in million MTs from the USA to Japan, Egypt, South Korea and Taiwan; from 2000 to 2009. The blue portions of the bars represent the proportion of the total imports to Japan, Egypt, South Korea, and Taiwan coming from the United States; the green portions of the bars represent the proportion of total imports from nations other than the USA.
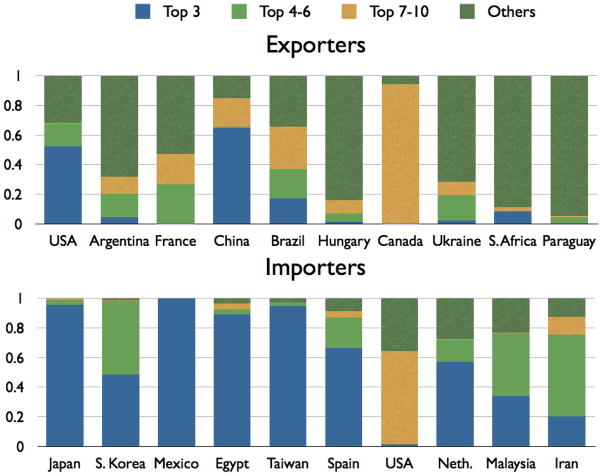
It is also worth assessing the relationship between top producing and consuming countries to analyze clustering. Fig. 4 displays a chart of trade volumes between different sets of countries emphasizing the ratio of maize coming from the top 3, top 4–6, and top 7–10 producers for consumers (top panel) and ratio of maize being exported by the producers to top 3, top 4–6, and top 7–10 consumers (bottom panel). The market for top exporters is more diverse than that for importers. As can be seen in the top panel in Fig. 4, the US and China are the major producers for the top 3 consumers: Japan, South Korea, and Mexico. This diagram also suggests that Canada exports most of its maize to specific countries in the top 7–10 importers; US, Netherlands, Malaysia and Iran, among which US has the lion’s share for Canada’s maize. Countries such as Hungary, South Africa and Paraguay have a different consumer base than other top exporters, namely they export most of their maize to countries other than top ten importers. The top importers’ providers are not very diverse due to the fact that the top three exporters (US, Argentina, and France) dominate the market. The only exception to this is that Malaysia and Iran import maize primarily from producers other than the top three exporters. Interestingly, the US is among both the top ten exporters and top ten importers. As the diagram shows, the US is importing maize not from the top 3 or top 4–6 nations, but from nations further down in the list of top producers.
Fig. 4.
Normalized trade volumes for top exporters (importers) to/from top importers (exporters). Top exporters are the USA, Argentina, and France (top 3); China, Brazil, Hungary (top 4–6); and Canada, Ukraine, S. Africa, and Paraguay (top 7–10). The top importers are Japan, S. Korea, Mexico (top 3); Egypt, Taiwan, Spain (top 4–7); and the USA, Netherlands, Malaysia and Iran (top 7–10).
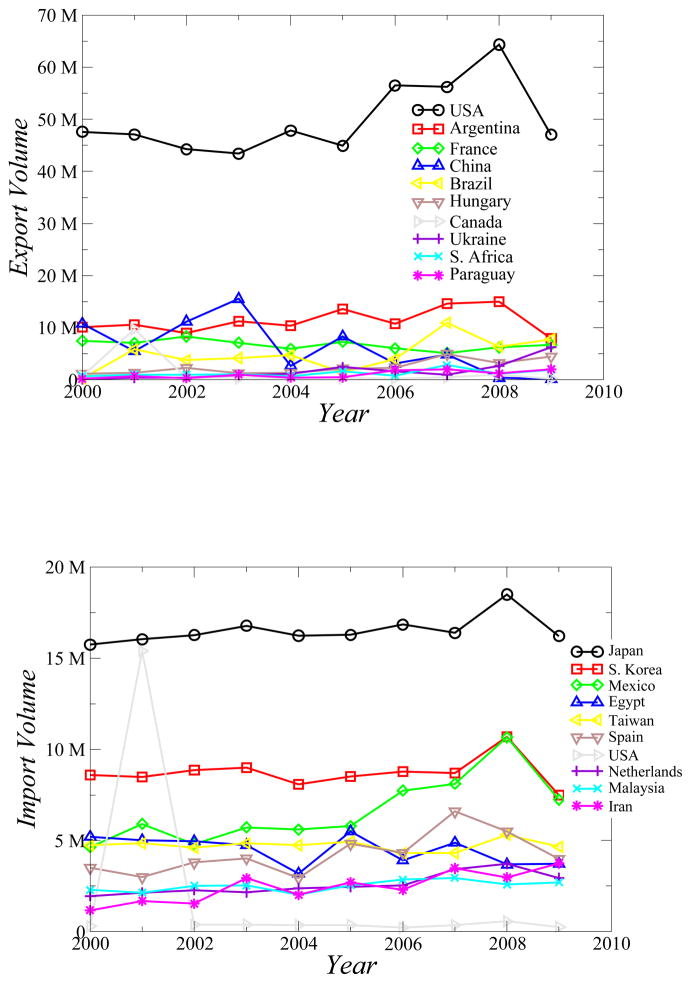
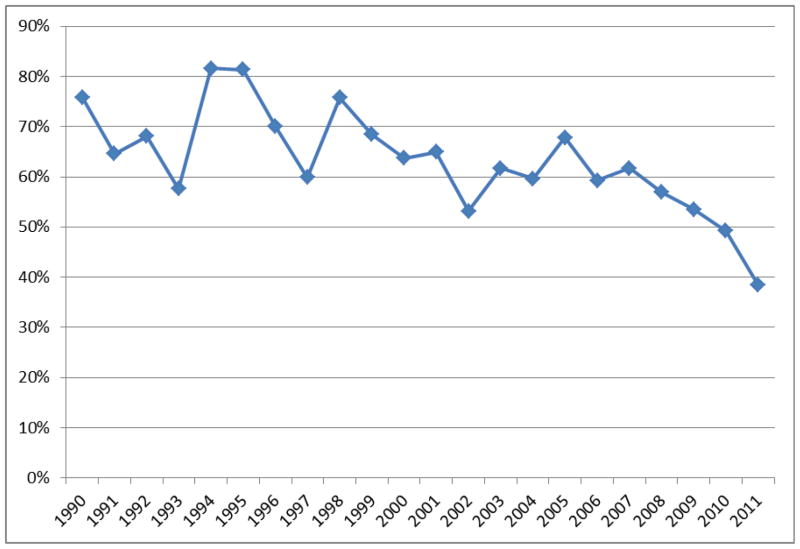
The annual trends in the total export and import volumes exhibit a steady picture for most major exporting/importing nations in terms of maize trade, although significant fluctuations are observed in a few cases, as shown in Fig. 5. For example, as can be seen in the top panel in Fig. 5, the US, Argentina, and Brazil increased their export volumes slightly in the last several years; but China’s export volume decreased significantly in the same period. Brazil’s overall export capacity is largely due to a sudden and temporary increase in 2001, mostly to the US. The same effect can be observed in the import volume of the US (bottom panel in Fig. 5). This panel also shows a constant increase in Iran and Mexico’s maize imports over the decade. Fig. 6 shows, however, that the proportion of total global maize exports coming from the United States has decreased over the last decade, when compared with proportions from the 1990s and early 2000s. Taken together, these data indicate that on the whole, maize trade patterns are stable over time, although some steady increases and decrease have been seen in maize imports or exports for key players in the maize trade network.
Fig. 5.
Total maize export and import volumes for top exporters and importers across different years, 2000–2009.
Fig. 6.
Proportion of total global maize exports coming from the United States, 1990–2011. Data source: US Department of Agriculture Economic Research Service (USDA ERS).
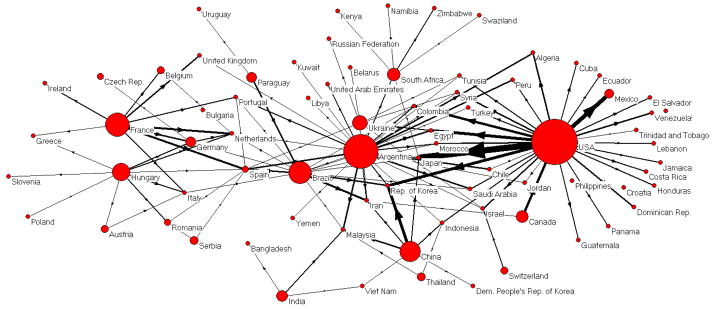
Finally, the local consumption of maize plays also an important role in the world trade. Fig. 7 displays the same network diagram as Fig. 1, but with a different representation of the nations in which the size of the nodes are proportional to maize consumption per capita in each of the nations. Some top exporters are also top consumers such as the US, China and Brazil; whereas other top exporters such as Argentina, France and Hungary have much lower local consumption. By sizing the nodes according to consumption patterns by nation, it becomes clear which nations are relatively more dependent upon maize imports: Mexico, Japan, and Egypt. However, Japan and Egypt import maize from multiple nations, while Mexico relies primarily on large amounts of maize imports from the US.
Fig. 7.
Network diagram of world maize trade emphasizing consumption. The threshold for the lines is 100K MT and the size of the nodes is proportional to maize consumption in that country. Source: faostat.fao.org.
4. DISCUSSION
Social network models are a general and simplistic, yet powerful, means of representing patterns of connections or interactions between the multiple actors within a system (17). In the case of global maize trade – its quantities and trading partners - the social network model developed in this study provides several key insights with respect to food security worldwide.
One insight is the critical role that the United States plays in global maize production, trade, and supply; particularly to a certain group of nations to which it exports maize. It is by far the largest exporter of maize worldwide, exporting over four times as much maize as the next largest exporter (Argentina). Moreover, it is exporting to the largest number of countries total. Critical to the point of food security is that, in the maize trading network, the United States is at the center of a large cluster of North, Central, and Latin American nations, which themselves are hardly connected with each other or with other nations in the global network. If anything should affect the production or use of maize such that the US could not export large quantities, then this portion of the global maize trading network may experience vulnerability to reduced food supply; and worldwide, there would be an increase in maize prices.
Indeed, this phenomenon has occurred in recent history. From about 2005 onwards, there was an enormous increase in the proportion of US maize production devoted to fuel ethanol. This diversion of maize from food and feed to fuel production, coupled with higher energy prices, attendant increases in food production costs, increased demand for grant to produce food and feed in some parts of the world, and adverse weather conditions that affected yield, led directly to sharp increases in food prices worldwide (18, 19, 20, 21). As described earlier, Fig. 6 shows the decreasing proportion of US maize in total maize trade over the last decade, when compared with proportions from the 1990s and early 2000s. Not surprisingly, Mexico – whose maize imports come primarily from the United States – was one of the nations to suffer the worst food security problems as a result (18, 21). Riots ensued, particularly amongst the poor, over unaffordable tortilla prices; and President Felipe Calderon intervened with a mandatory price cap. Aside from Mexico, other nations most affected by the US diversion of maize to ethanol production were Japan and Saudi Arabia (21). All three of these nations, as shown in our network model diagram, are large importers of US maize; with the bulk of their maize imports coming from the United States.
The reduced export supply from one maize-exporting nation does not only raise maize prices from that nation. Even if other maize-producing nations produce large crops, their prices will also be higher if there is a supply disruption in another major producer (e.g., the US). In such instances, nations that import maize from these other nations will still face higher prices, hence needing either to pay more or to import less, even if those maize-exporting nations would be able to supply any amount ordinarily demanded. Hence, maize importers other than those importing mostly from the US may also suffer as a result of reduced US maize supplies.
Because European nations have a more dense clustering pattern in the maize trade network, somewhat more isolated from the rest of the maize trade globally, they are less likely to become vulnerable to maize-related shortages if one nation were to export less in a particular year (for example, if that nation were to divert maize to uses other than food or feed). Even if much of Europe were to suffer from a climatic situation or maize disease that would drastically reduce maize production in that region of the world, many European nations also regularly import from Brazil or Argentina: two large maize producers in another part of the world that would be unlikely suffer the same climatic conditions or plant diseases as Europe. Hence, this part of the maize trade network is relatively more stable to potential fluctuations in food security risks. However, if maize supply were decreased in any part of the world (e.g., the United States), there would be a price increase that would affect all nations worldwide, including European nations; even if these nations do not import large amounts of maize directly from the US.
There are a number of limitations in the analyses presented here. First and foremost, these are descriptive analyses: the social network model and the corresponding descriptive statistics and what can be understood from them. At best, we can state what implications may be for food security risks from the results of these analyses; we cannot state with certainty what these risks will actually be. Additionally, these analyses are limited to maize trade. Even if maize supply were to change from a global standpoint, the supply of other cereal grains or legumes might allow for the recoupment of potential losses; these other commodities are not included in this analysis.
Finally, multiple factors that are not included in this analysis can influence food security. Trade agreements and policies among various trading parties play an important role in determining the social network structure of maize trade worldwide. These would affect not only which nations trade with each other, but also whether nations may be dependent upon exports or imports from certain other nations. Several studies (22–24) describe how Mexican maize imports from the US increased substantially after the North American Free Trade Agreement (NAFTA) was established; while other studies link changes in maize trade to trade agreements in Africa (25) and South America (26). Other factors than the ones mentioned above may also play a role in maize price spikes in recent years, such as speculative bubbles that appear to affect wheat, maize, and rice more than other commodities (27), depreciation of the US dollar, slower growth in agricultural productivity, and changing economic growth and demand in low- and middle-income countries (28).
A final insight concerns “target” regions of the world in terms of food security concerns in the future such as climate change. The implication is that the United States, Argentina, France, China, and Brazil – the largest maize exporters - should consider potential solutions to combat impacts of climate change on maize production, for the sake of maintaining the global maize supply. For example, investments could be made in maize breeding to withstand various environmental conditions: high temperatures, drought, heavy precipitation, and insect pest and fungal resistance (29). Likewise, major importers of maize such as Japan, Korea, Mexico, Egypt, and Taiwan should consider contingency plans for food supplies in case of shortages from their major maize suppliers in the future. This could include increased domestic food production where possible; or sourcing maize from multiple different regions worldwide, to reduce the risk that climatic conditions in one part of the world would result in a near-complete loss of maize imports. Future studies in network modeling could focus on most efficient means by which to source maize to regions of the world where needed, in food shortage events.
Acknowledgments
This work was funded by the National Cancer Institute (NCI) of the National Institutes of Health (NIH), Grant No. 5R01CA153073-2.
Footnotes
The content is solely the responsibility of the authors and does not necessarily represent the official views of NCI or NIH.
References
- 1.Godfray HC, Pretty J, Thomas SM, Warham EJ, Beddington JR. Global food supply: Linking policy on climate and food. Science. 2011;331:1013–4. doi: 10.1126/science.1202899. [DOI] [PubMed] [Google Scholar]
- 2.Gomez MI, Barrett CB, Buck LE, DeGroote H, Ferris S, Gao HO, McCullough E, Miller DD, Outhred H, Pell AN, Reardon T, Refnanestri M, Ruben R, Struebi P, Swinnen J, Toesnard MA, Weinberger K, Keatinge JD, Milstein MB, Yang RY. Agriculture: Research principles for developing country food value chains. Science. 2011;332:1154–5. doi: 10.1126/science.1202543. [DOI] [PubMed] [Google Scholar]
- 3.Foley JA, Ramankutty N, Brauman KA, Cassidy ES, Gerber JS, Johnston M, Mueller ND, O’Connell C, Ray DK, West PC, Balzer C, Bennett EM, Carpenter SR, Hill J, Monfreda C, Polasky S, Rockstrom J, Sheehan J, Siebert S, Tilman D, Zaks DP. Solutions for a cultivated planet. Nature. 2011;478:337–42. doi: 10.1038/nature10452. [DOI] [PubMed] [Google Scholar]
- 4.Romm J. Desertification: The next dust bowl. Nature. 2011;478:450–1. doi: 10.1038/478450a. [DOI] [PubMed] [Google Scholar]
- 5.FAO (Food and Agriculture Organization) Maize in Human Nutrition. Rome, Italy: Food and Agriculture Organization of the United Nations; 1992. [Google Scholar]
- 6.Tinbergen J. Shaping the world economy. New York, NY: The Twentieth Century Fund Inc; 1962. [Google Scholar]
- 7.Helpman R, Krugman P. Market structure and foreign trade. Cambridge, Massachusetts: MIT Press; 1985. [Google Scholar]
- 8.Bornschier V, Trezzini B. Social stratification and mobility in the world system: Different Approaches and Recent Research. International Sociology. 1997;12:429–455. [Google Scholar]
- 9.Wasserman S, Faust K. Social Network Analysis: Methods and Applications. Cambridge, United Kingdom: Cambridge University Press; 1994. [Google Scholar]
- 10.Ferguson NM, Cummings DAT, Fraser C, Cajka JC, Cooley PC, Burke DS. Strategies for mitigating an influenza pandemic. Nature. 2006;442:448–452. doi: 10.1038/nature04795. [DOI] [PMC free article] [PubMed] [Google Scholar]
- 11.Epstein JM, Goedecke DM, Yu F, Morris RJ, Wagener DK, Bobashev GV. Controlling pandemic flu: the value of international air travel restrictions. PLoS ONE. 2007;2:e401. doi: 10.1371/journal.pone.0000401. [DOI] [PMC free article] [PubMed] [Google Scholar]
- 12.Christakis NA, Fowler JH. The spread of obesity in a large social network over 32 years. New England Journal of Medicine. 2007;357:370–9. doi: 10.1056/NEJMsa066082. [DOI] [PubMed] [Google Scholar]
- 13.Christakis NA, Fowler JH. The collective dynamics of smoking in a large social network. New England Journal of Medicine. 2008;358:2249–58. doi: 10.1056/NEJMsa0706154. [DOI] [PMC free article] [PubMed] [Google Scholar]
- 14.Bhattacharya K, Mukherjee G, Saramaki J, Kaski K, Manna SS. The international trade network: Weighted network analysis and modeling. Journal of Statistical Mechanics. 2008:P02002. [Google Scholar]
- 15. [last accessed 5 July 2012];United Nations Commodity Trade Statistics Database (UN Comtrade) http://comtrade.un.org.
- 16.Wu F, Guclu H. Aflatoxin regulations in a network of global maize trade. PLoS ONE. 2012;7(9):e45141. doi: 10.1371/journal.pone.0045151. [DOI] [PMC free article] [PubMed] [Google Scholar]
- 17.Newman MEJ. Networks: An Introduction. New York, NY: Oxford University Press; 2010. [Google Scholar]
- 18.Boddiger D. Boosting biofuel crops could threaten food security. Lancet. 2007;370:923–4. doi: 10.1016/S0140-6736(07)61427-5. [DOI] [PubMed] [Google Scholar]
- 19.Mitchell D. World Bank Policy Research Working Paper No 4682. Washington, DC: World Bank; 2008. A note on rising food prices. [Google Scholar]
- 20.Hochman G, Rajagopal D, Timilsina G, Zilberman D. World Bank Policy Research Working Paper No 5744. Washington, DC: World Bank; 2011. The role of inventory adjustments in quantifying factors causing food price inflation. [Google Scholar]
- 21.Buntrock G. Cheap no more. The Economist. 2007 Dec 6; http://www.economist.com/node/10250420.
- 22.Levy S, van Wijnbergen S. Maize and the Free Trade Agreement between Mexico and the United States. World Bank Econ Rev. 1992;6:481–502. [Google Scholar]
- 23.Clark SE, Hawkes C, Murphy SM, Hansen-Kuhn KA, Wallinga D. Exporting obesity: US farm and trade policy and the transformation of the Mexican consumer food environment. Int J Occup Environ Health. 2012;18:53–65. doi: 10.1179/1077352512Z.0000000007. [DOI] [PubMed] [Google Scholar]
- 24.Nadal A, Wise TA. Working Group on Development and Environment in the Americas. The Environmental Costs of Agricultural Trade Liberalization: Mexico-U.S. Maize Trade Under NAFTA. Discussion Paper Number 4, 2004. [Google Scholar]
- 25.Makochekanwa A. Impacts of Regional Trade Agreements on Trade in Agrifood Products: Evidence from Eastern and Southern Africa. African Economic Conference 2012: Fostering Inclusive and Sustainable Development in Africa in an Age of Global Economic Uncertainty. [Google Scholar]
- 26.Sturzenegger A, Otrera W, Mosquera B. Trade, exchange rate, and agricultural pricing policies in Argentina. World Bank; Washington, DC: 1990. [Google Scholar]
- 27.Gutierrez L. Speculative bubbles in agricultural commodity markets. European Review of Agricultural Economics. 2013;40:217–38. [Google Scholar]
- 28.Trostle R, Marti D, Rosen S, Westcott P. Why Have Food Commodity Prices Risen Again? A Report from the Economic Research Service, United States Department of Agriculture, WRS-1103. 2011 Jun; http://www.ers.usda.gov/media/126752/wrs1103.pdf.
- 29.Wu F, Bhatnagar D, Bui-Klimke T, Carbone I, Hellmich R, Munkvold G, Paul P, Payne G, Takle E. Climate Change Impacts on Mycotoxin Risks in US Maize. World Mycotoxin Journal. 2011;4:79–93. [Google Scholar]


