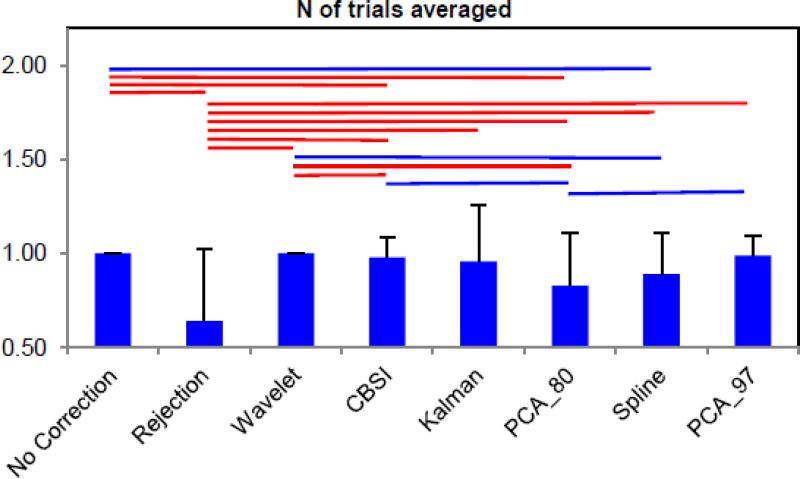
Fig.4.
Bar plots with the mean number of trials averaged for each technique normalized to the mean number of trials averaged with the no motion correction technique; the error bars represents the standard deviation. The lines above indicate whether the techniques that they link together differ significantly from each other (p<.05 if blue, p<.01 if red).

