

Abstract
Quantitative tractography may provide insights into regional heterogeneity of changes in white matter structure in normal ageing. Here we examine how brain atrophy and white matter lesions affect correlations between tract shape, tract integrity and age in a range of frontal and non-frontal tracts in 90 non-demented subjects aged over 65 years using an enhanced version of probabilistic neighbourhood tractography. This novel method for automatic single seed point placement employs unsupervised learning and streamline selection to provide reliable and accurate tract segmentation, whilst also indicating how the shape of an individual tract compares to that of a predefined reference tract. There were significant negative correlations between tract shape similarity to reference tracts derived from a young brain white matter atlas and age in genu and splenium of corpus callosum. Controlling for intracranial and lateral ventricle volume, the latter of which increased significantly with age, attenuated these correlations by 40 and 84 % respectively, indicating that this age-related change in callosal tract topology is significantly mediated by global atrophy and ventricular enlargement. In accordance with the ‘frontal ageing’ hypothesis, there was a significant positive correlation between mean diffusivity (〈D〉) and age, and a significant negative correlation between fractional anisotropy (FA) and age in corpus callosum genu; correlations not seen in splenium. Significant positive correlations were also observed between 〈D〉 and age in bilateral cingulum cingulate gyri, uncinate fasciculi and right corticospinal tract. This pattern of correlations was not, however, reproduced when those subjects with significant white matter lesion load were analyzed separately from those without. These data therefore suggest that brain atrophy and white matter lesions play a significant role in driving regional patterns of age-related changes in white matter tract shape and integrity.
Keywords: Ageing, white matter, magnetic resonance imaging, water diffusion tensor, tractography
Introduction
Structural MRI and pathological studies have identified two distinct macroscopic processes that affect white matter in normal ageing, specifically tissue loss with ventricular enlargement (Meier-Ruge et al., 1992), and white matter lesions which typically form under the cortex (subcortical or deep white matter) and adjacent to the ventricles (periventricular) (Fazekas et al., 1987). Significant elements in the loss of white matter structural integrity associated with these two processes are breakdown of myelin and a decline in the number and length of myelinated fibres, reduction in axonal density, neuronal loss and gliosis (Fazekas et al., 1993; Bartzokis et al., 2003; Marner et al., 2003; Armstrong et al., 2004).
The current method of choice for investigating white matter microstructural integrity in vivo is diffusion tensor MRI (DT-MRI). This modality provides two scalar parameters, the mean diffusivity (〈D〉) and fractional anisotropy (FA), the former indicating the magnitude and the latter the directional coherence of water molecule diffusion, which have been shown to provide useful biomarkers for probing white matter structure (Pierpaoli et al., 1996). A number of studies, typically performed using region-of-interest (ROI) or histogram analysis, have investigated the changes in white matter structure that accompany normal ageing using DT-MRI, with the general finding that 〈D〉 increases and FA decreases as structural coherence declines with advancing age, an effect which appears to be more pronounced in anterior than posterior regions (see Sullivan and Pfefferbaum (2006) for a review). However, two recent studies, one post-mortem using brains from subjects free of significant neuropathological abnormalities and one imaging using tract-based spatial statistics (TBSS) suggest that ageing reduces both anterior and posterior white matter volumes and that loss of white matter integrity arises from atrophy and lesion formation specific to distinct brain regions (Vernooij et al., 2008; Piguet et al. 2009).
Quantitative tractography may provide further insights into the regional heterogeneity of changes in white matter structure in normal ageing by allowing investigation of how water diffusion parameters measured within a specific tract vary with age (Sullivan et al., 2006; Stadlbauer et al., 2008; Sullivan et al., 2008), assuming, of course, it is possible to segment reliably the same tract from subject to subject across a population. Recently, we have introduced a novel method for automatic tract segmentation, termed probabilistic neighbourhood tractography (PNT), which aims to identify the same fasciculus in groups of subjects from single seed point tractography output using probabilistic tract shape modelling (Clayden et al., 2007). In this method, seed points are automatically placed in a neighbourhood surrounding a seed point transferred from standard space, with the tract that best matches a predefined reference tract in terms of both length and shape chosen from this group of ‘candidate’ tracts (Clayden et al., 2006). This ability to quantify how the length and shape of a specific tract differs from that of a reference tract for each subject is unique to PNT, and allows a detailed investigation into how tract topology, in addition to tract-averaged water diffusion parameters, changes with age. For example, in a group of 40 non-demented subjects aged over 65 years we found for corpus callosum genu a significant negative correlation between a PNT-derived measure of tract shape similarity to a young brain reference tract and age (Bastin et al., 2008). This latter finding for an age-related change in genu topology was tentatively attributed to lateral ventricular enlargement resulting from general brain atrophy, although the sample size in that study was not sufficient to test this hypothesis.
In this paper we extend this work by examining how brain atrophy and white matter lesions affect correlations between tract shape, tract integrity and age in a range of frontal and non-frontal tracts in a larger cohort of non-demented ageing subjects using an enhanced version of PNT. These enhancements take the form of employing reference tracts derived from a white matter atlas rather than from a single subject (Muñoz Maniega et al., 2008), applying unsupervised learning methods to fit the tract shape model automatically from the entire dataset rather than having to train the model with a set of tracts chosen by hand (Clayden et al., 2009b), and using the tract shape model to reject streamlines which are unlikely to belong to the fasciculus-of-interest (Clayden et al., 2009a). These methodological developments further improve the reliability and accuracy of tract segmentation, and hence measures of tract shape and integrity derived from them.
Materials and methods
Subjects
The study population consisted of 90 volunteers recruited from the community and aged over 65 years, without history of stroke or other neurological disorder, who were awaiting routine elective hip or knee replacement surgery. No subject had dementia as determined by a comprehensive neuropsychological assessment that included the Mini-Mental State Examination, tests of memory and executive function, and of activities of daily living. All were living independently and none had contraindications to MRI. The study was approved by the Scotland A Research Ethics Committee and informed consent was obtained from each subject.
MRI protocol
All MRI data were collected using a GE Signa LX 1.5 T (General Electric, Milwaukee, WI, USA) clinical scanner equipped with a self-shielding gradient set (33 mT/m maximum gradient strength) and manufacturer supplied ‘birdcage’ quadrature head coil. The whole brain MRI examination comprised standard structural T2-, T2*- and FLAIR-weighted imaging, a high-resolution three-dimensional T1-weighted volume scan and a diffusion MRI (dMRI) protocol based on single-shot spin-echo echo-planar (EP) imaging. The three standard structural scans had a field-of-view (FOV) of 240 × 240 mm, acquisition matrices zero filled to 256 × 256, and 26 slices of thickness 5 mm. The T1-weighted volume scan was acquired in the coronal plane with a FOV of 220 × 220 mm, an acquisition matrix of 192 × 192 (zero filled to 256 × 256), and 180 contiguous slices of thickness 1.2 mm aligned with the long axis of the hippocampus. The dMRI protocol consisted of 7 T2-weighted and sets of diffusion-weighted (b = 1000 s/mm2) axial EP volumes acquired with diffusion gradients applied in 64 non-collinear directions (Jones et al., 2002). Fifty-three contiguous slice locations were imaged with a FOV of 240 × 240 mm, an acquisition matrix of 96 × 96 (zero filled to 128 × 128) and a slice thickness of 2.5 mm, giving an acquisition voxel dimension of 2.5 × 2.5 × 2.5 mm. The repetition and echo times for each EP volume were 13.5 s and 75 ms.
Image pre-processing
All DICOM format magnitude images were transferred from the scanner to a Dell Precision 690 workstation (Dell Computers, Round Rock, TX, USA) and converted into NIfTI format (http://nifti.nimh.nih.gov). Using tools freely available in FSL (FMRIB, Oxford, UK; http://www.fmrib.ox.ac.uk), the dMRI data were pre-processed to extract the brain, and bulk patient motion and eddy current induced artefacts removed by registering the diffusion-weighted to the first T2-weighted EP volume for each subject (Jenkinson and Smith, 2001). From these MRI data, 〈D〉 and FA volumes were generated for every subject using DTIFIT. (Due to uncertainty into how the axonal and radial diffusivities should be interpreted in terms of underlying brain structure (Wheeler-Kingshott and Cercignani, 2009), measurement of these additional water diffusion parameters is not undertaken in the current study.) To generate the underlying connectivity data for each of the seed points used in the tract shape modelling described below, the BedpostX/ProbTrackX algorithm was run with its default parameters of a 2 fibre model per voxel, 5000 probabilistic streamlines for each tract with a fixed separation distance of 0.5 mm between successive points (Behrens et al., 2007).
Tract shape modelling and streamline selection
Following the method described by Muñoz Maniega et al. (2008), reference tracts and seed points for the eight fasciculi-of-interest, the genu and splenium of corpus callosum, cingulum cingulate gyri (CCG; Wakana et al., 2007), left and right projections of the pyramidal or corticospinal tract (CST), and uncinate fasciculi, were created from a digital human white matter atlas generated from tractography output of 28 young healthy adults (Hau et al., 2008). (See Fig. 1 for examples of these reference tracts.)
Figure 1.
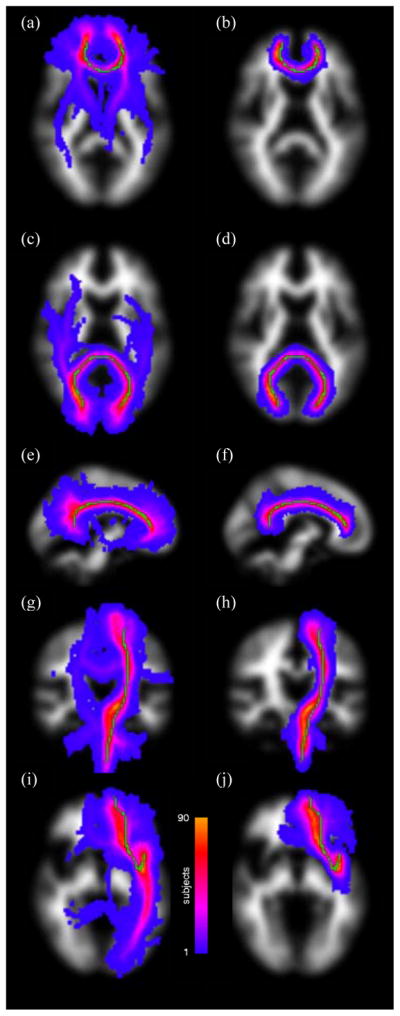
Maximum intensity projections of standard space group maps of the segmented fasciculi-of-interest overlaid on an MNI white matter volume without (first column) and with (second column) streamline selection. The tracts displayed are genu (a, b; axial), splenium (c, d; axial), and left cingulum cingulate gyrus (e, f; sagittal), left corticospinal tract (g, h; coronal) and left uncinate fasciculus (i, j; axial). The reference tract is superimposed in green in each case. Note how the significant branches heading into unrelated structures evident in the first column are almost entirely removed using streamline selection in the second column, thereby significantly improving tract segmentation.
For each subject, the tract taken to epitomise the fasciculus-of-interest was determined by generating a set of candidate tracts from a 7 × 7 × 7 neighbourhood of voxels centred on the reference seed point and evaluating their shape and length similarity to the reference using the modelling approach described in Clayden et al. (2009b) and implemented in the TractoR package for fibre tracking and analysis (http://code.google.com/p/tractor). The seed point that produced the best match tract to the reference was passed to the ProbTrackX tractography algorithm, run with its default parameters, to generate a visitation map. To reduce false positives and ameliorate noise-related falloff in connection probability with distance from the seed point, a method of culling, or pruning streamlines that do not resemble the median path was employed for the best match tract (Clayden et al., 2009a). This streamline selection step works by retaining streamlines probabilistically according to the difference between their matching probabilities and that of the median path, and removes the need to apply a user-defined arbitrary threshold to the connectivity data to exclude voxels with a very low probability of connection. A tract mask was then generated from the retained streamlines of the best match tract, truncated to the length of the reference tract, and applied to each subject’s 〈D〉 and FA volumes, and tract-averaged water diffusion parameters determined. Finally, as described in Bastin et al. (2008), a measure of the absolute goodness-of-fit of the best match tract to the reference (R) in any given subject was determined from the log-ratio between the matching likelihood of the chosen candidate tract and the matching likelihood of the reference tract to itself. Since the reference tract has, by definition, a log-ratio of zero, this measure of topological similarity (or difference) will almost always be negative for all other tracts; and the more negative it is, the less good is the fit between the reference and best match tract.
Intracranial and lateral ventricle volumes
Intracranial volume (ICV), namely all structures within the cranium and including brain, roots of cranial nerves, cerebrospinal fluid (CSF), venous sinuses and other vessels, was measured semi-automatically using Analyze 7.0 (Mayo Clinic, Rochester, MN, USA) by an experienced rater (KJF) from the axial whole brain T2*-weighted sequence starting at the first slice in which the cerebellum was visible. Using the coronal T1-weighted volume scan, lateral ventricle volume (LVV) was measured starting at the first slice in which the frontal pole was visible and finishing when the occipital pole was last visible. The temporal horns of the ventricles were included in all slices in which they were visible (Shenkin et al., 2009). This was achieved by initially thresholding each volume to separate brain from CSF. This threshold was determined by averaging the signal from four square 3 × 3 voxel ROI placed in the ventricle and superior temporal cortex on two consecutive slices, with all voxels below this threshold removed from the volume. The edges of the ventricles were then delineated by placing a seed within any voids determined by the rater (KJF) to be part of the ventricle. Limits were drawn manually where structures forming the boundaries of the ventricles, for example the septum and tela choroides of the lateral ventricle, were rendered incomplete as a result of the thresholding process.
White matter lesions
Each scan was independently quantified for white matter lesion load on the T2- and FLAIR-weighted images by a trained rater (KJF) using the Fazekas rating scale (Fazekas et al., 1987; Wardlaw et al., 2003). This rates lesions separately depending on whether they are in periventricular or deep white matter and provides a score of 0–3 for each. This scale was used because it was found to be appropriate for capturing a broad range of degrees of white matter abnormalities from mild to severe (Deary et al., 2003; Wardlaw et al., 2004). It also provides a convenient way of dividing the cohort into subjects with significant white matter lesion load (Fazekas scores of 2 or 3 on either lesion subscale) and those without (Fazekas scores of 0 or 1 on both lesion subscales) (MacLullich et al., 2009).
For those subjects with significant white matter lesion load, lesion areas, defined as regions with abnormal signal intensity typically 25 % greater than the average intensity of surrounding normal-appearing white matter (Zhan et al., 2009), were extracted from bias field corrected FLAIR images (FAST; FMRIB, Oxford, UK).
Statistical analysis
All descriptive statistics are presented as mean (SD). Normality was assessed using the Kolmogorov-Smirnov Z test. For the eight fasciculi-of-interest, the effects of normal ageing on tract shape and integrity were investigated by correlating age with the goodness-of-fit of the best match tract to the reference R (Spearman’s ρ), and tract-averaged 〈D〉 and FA (Pearson’s r), measured for the best match tract in each subject. All statistical tests were performed using SPSS 14.0 (SPSS Inc, Chicago, Ill, USA), with p < 0.05 being considered statistically significant.
Results
The cohort consisted of 51 men and 39 women of mean age 75.7 (5.1) and range 65 to 88 years. The mean ages of the male and female subjects were 75.2 (5.0) and 76.3 (5.2) years. The mean LVV and ICV were 37941 (18091) and 1443507 (140390) mm3 respectively. The numbers of participants in each category of the Fazekas scale for deep white matter lesions were 5 for category 0, 59 for category 1, 20 for category 2 and 6 for category 3. Likewise for the periventricular white matter lesion scale, 9 were in category 0, 56 in category 1, 10 in category 2 and 15 in category 3. Two thirds of participants, 58 in total (36 male), therefore had either few or no white matter lesions, that is scores of 0 or 1 on both lesion subscales. The mean age of this group (75.1 (5.0) years) was not significantly different from the 32 subjects (15 male) with significant white matter lesion load (76.7 (5.3) years).
Group comparison of tracts
Figure 1 shows the variability in tract segmentation across the cohort for genu, splenium, and left CCG, left CST and left uncinate fasciculus without (first column) and with (second column) streamline selection. In this figure, the segmented tract from each subject was transformed into Montréal Neurological Institute (MNI) standard space and overlaid as a maximum intensity projection on an MNI white matter volume to form a group map. In the main, while the segmented tracts closely follow the trajectories of the reference (overlaid in green) for each fasciculus-of-interest, there are significant branches heading into unrelated structures without streamline selection. These unwanted structures are almost entirely eliminated with streamline selection, with the result that the segmented tracts group closely round the reference.
White matter lesion location
Figure 2 displays maximum intensity projections of standard space group maps of deep and periventricular white matter lesion location in the 32 subjects with significant lesion load overlaid on an MNI whole brain volume. This figure, which was created by transforming each subject’s lesion mask into standard space, shows that lesions are predominantly situated in periventricular regions, with increased variability in surrounding tissue reflecting individual differences in deep white matter lesion location.
Figure 2.
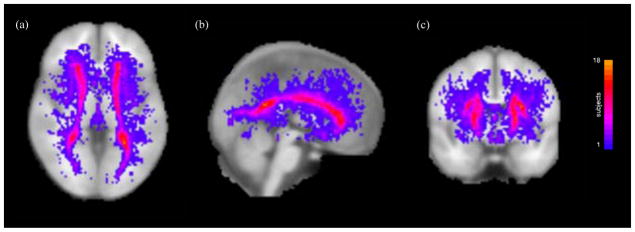
Maximum intensity projections of standard space group maps of white matter lesion location overlaid on an MNI whole brain volume for the 32 subjects with significant lesion load. The colour bar indicates the number of subjects with white matter lesions at each standard space location.
The spatial interaction between these white matter lesions and the eight fasciculi-of-interest is shown in Fig. 3 which displays maximum intensity projections of standard space group maps of the intersection of the best match tract and lesion location for the 32 subjects with significant lesion load. Although all eight fasciculi-of-interest pass through areas with white matter lesions, genu, right CCG, left CST and, in particular, splenium show regions with large interactions.
Figure 3.
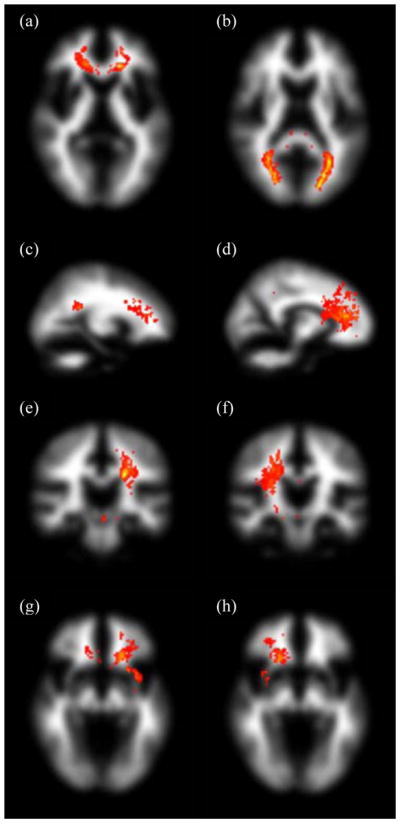
Maximum intensity projections of standard space group maps of the intersection between segmented fasciculi-of-interest and white matter lesion location overlaid on an MNI white matter volume for the 32 subjects with significant lesion load. The tracts displayed are genu and splenium (a, b; axial), left and right cingulum cingulate gyri (c, d; sagittal), left and right corticospinal tracts (e, f; coronal), and left and right uncinate fasciculi (g, h; axial). The windowing level is the same across all eight tracts, with ‘hotter’ colours indicating larger values of the product of the tract and white matter lesion group maps.
Tract-averaged diffusion parameters
Mean values of tract-averaged 〈D〉 and FA for the eight fasciculi-of-interest using streamline selection are presented in Table 1. (Kolmogorov-Smirnov Z tests indicate that these data are approximately normally distributed.) Values of 〈D〉 range from 749 (36) for left CCG to 1121 (220) μm2 s−1 for splenium, while FA ranges from 0.37 (0.03) in left uncinate to 0.52 (0.03) in right CST and 0.52 (0.08) in splenium. Differences in water diffusion parameters between the various fibre systems can be appreciated using a simple scatter plot of FA versus 〈D〉. These data are displayed in Fig. 4 for all subjects and indicate that genu and splenium, and to a degree CCG, CST and uncinate fasciculi, form distinctive clusters separate from each other. This figure therefore suggests that the values of these quantitative parameters are relatively specific to each tract system.
Table 1.
Mean (SD) values for tract-averaged mean diffusivity (〈D〉) and fractional anisotropy (FA) for the eight fasciculi-of-interest for all 90 subjects and gender groups (51 male). Bold type indicates significant differences between gender groups as assessed using independent samples t tests (p < 0.05). The units of 〈D〉 are μm2 s−1.
| Subjects | Genu | Splenium | Left CCG | Right CCG | Left CST | Right CST | Left uncinate | Right uncinate | |
|---|---|---|---|---|---|---|---|---|---|
| 〈D〉 | All | 905 (96) | 1121 (220) | 749 (36) | 759 (35) | 766 (37) | 764 (31) | 866 (45) | 829 (41) |
| Male | 921 (89) | 1081 (205) | 748 (33) | 761 (35) | 771 (38) | 762 (31) | 870 (42) | 832 (40) | |
| Female | 883 (101) | 1172 (231) | 752 (39) | 755 (35) | 760 (34) | 766 (31) | 860 (48) | 823 (42) | |
| FA | All | 0.47 (0.05) | 0.52 (0.08) | 0.44 (0.05) | 0.40 (0.04) | 0.49 (0.04) | 0.52 (0.03) | 0.37 (0.03) | 0.39 (0.03) |
| Male | 0.47 (0.05) | 0.54 (0.08) | 0.46 (0.05) | 0.41 (0.05) | 0.50 (0.04) | 0.53 (0.04) | 0.38 (0.03) | 0.40 (0.03) | |
| Female | 0.48 (0.06) | 0.50 (0.09) | 0.42 (0.05) | 0.40 (0.04) | 0.48 (0.03) | 0.51 (0.03) | 0.36 (0.03) | 0.38 (0.04) |
Figure 4.

Scatter plot of tract-averaged fractional anisotropy (FA) against mean diffusivity (〈D〉) within all segmented tracts.
Table 1 also displays tract-averaged 〈D〉 and FA values for men and women. Significant differences between gender groups are seen for 〈D〉 and FA in splenium, and for FA in left CCG, left CST and left uncinate fasciculus. For these eight fasciculi-of-interest, men have higher FA than women in all but genu.
Correlations of intracranial and lateral ventricle volume with age
No significant correlation was found between ICV and age. After controlling for ICV, there was a significant positive correlation between LVV and age (r = 0.40, p = 0.0001).
Correlations of goodness-of-fit of the best match tract to the reference with age
Significant negative correlations between R and age were found in genu (ρ = −0.40, p = 8 × 10⁻⁵) and splenium (ρ = −0.30, p = 0.004) only. When ICV and LVV were partialled out, the correlations were ρ = −0.31 (p = 0.003) and ρ = −0.12 (p = 0.27). This represents an attenuation of 40 % for genu and 84 % for splenium in the explained variance. An example of how age-related increases in LVV affects R for genu and splenium is shown in Fig. 5 for three representative female subjects aged 66, 78 and 84 years. As LVV increases with age (LVV as a percentage of ICV is shown in parentheses), the fit of the best match tract to the reference worsens, with the result that R becomes increasingly negative.
Figure 5.
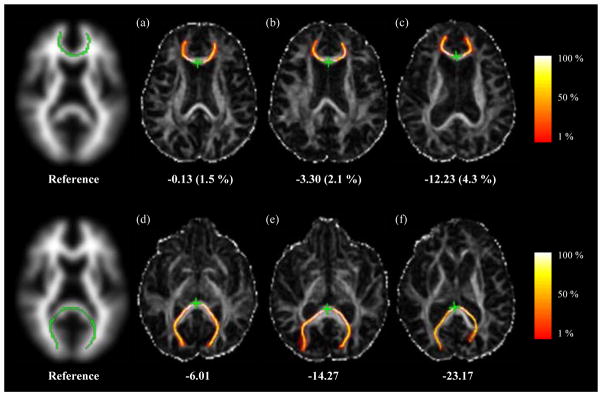
Two-dimensional axial projections of the genu (first row) and splenium (second row) overlaid on maps of FA for the atlas reference tracts and the best match tracts for three representative female subjects without significant white matter lesion load aged 66 (a, d), 78 (b, e) and 84 (c, f) years. Values of R are given for each tract, while LVV as a percentage of ICV is given in parentheses. The colours represent the proportion of probabilistic streamlines generated from the seed point (green star) passing through each voxel, as indicated by the colour bars.
The effect of white matter lesion load on correlations between R and age in genu and splenium was investigated using analysis of covariance (ANCOVA). No significant effect was found for either genu or splenium, indicating that lesion load does not play a major role in the age-related changes in R seen in these two callosal tracts.
Correlations of water diffusion parameters with age
Table 2 displays correlations between tract-averaged water diffusion parameters and age for the eight fasciculi-of-interest for all 90 subjects. Significant positive correlations exist between 〈D〉 and age in genu, bilateral CCG, bilateral uncinate fasciculi and right CST (r = 0.23 to 0.47; p = 0.031 to 4 × 10⁻⁶). Significant negative correlations between FA and age are seen only in genu (r = −0.25, p = 0.017) and right uncinate fasciculus (r = −0.24, p = 0.023). No significant age-related correlations between water diffusion parameters and age are seen in splenium and left CST. As determined by ANCOVA, there was no evidence for gender having a significant effect on correlations between 〈D〉, FA and age for any tract.
Table 2.
Correlations of tract-averaged mean diffusivity (〈D〉) and fractional anisotropy (FA) with age in the eight fasciculi-of-interest for all 90 subjects.
| 〈D〉 | FA | |||
|---|---|---|---|---|
| r | p | r | p | |
|
| ||||
| Genu | 0.23 | 0.031 | −0.25 | 0.017 |
| Splenium | −0.02 | 0.85 | −0.14 | 0.20 |
| Left CCG | 0.35 | 0.001 | −0.14 | 0.19 |
| Right CCG | 0.34 | 0.001 | −0.09 | 0.42 |
| Left CST | 0.06 | 0.55 | 0.00 | 0.99 |
| Right CST | 0.29 | 0.005 | 0.12 | 0.27 |
| Left uncinate | 0.25 | 0.019 | −0.09 | 0.42 |
| Right uncinate | 0.47 | < 0.0001 | −0.24 | 0.023 |
Correlations assessed using Pearson’s r. Bold numbers indicate correlations significant at the p < 0.05 level.
Some of these data are displayed graphically in Fig. 6, specifically 〈D〉 and FA versus age for genu, splenium and right uncinate fasciculus. In these figures those subjects with few or no white matter lesions are indicated with open circles, and those with significant lesion load with closed circles. In contrast to splenium, and to a lesser extent genu, in which there is a large variation in both water diffusion parameters, 〈D〉 and FA take a fairly narrow range of values in right uncinate fasciculus.
Figure 6.

Correlations between tract-averaged mean diffusivity (a, c, e), fractional anisotropy (b, d, f) and age for genu (first row), splenium (second row) and right uncinate fasciculus (third row). Open circles indicate subjects with few or no lesions in deep and periventricular white matter, while closed circles indicate subjects with significant lesion load.
Correlations between tract-averaged water diffusion parameters and age for the eight fasciculi-of-interest for subjects with and without significant white matter lesion load are shown in Table 3. In the former group, significant age-related correlations are seen for 〈D〉 and FA in genu (〈D〉: r = 0.41, p = 0.018; FA: r = −0.42, p = 0.016), and 〈D〉 in left CCG, and bilateral uncinate fasciculi (r = 0.36 to 0.52; p = 0.04 to 0.002). There are also trends between 〈D〉 and age in right CCG (r = 0.33, p = 0.06), and FA and age in right uncinate fasciculus (r = −0.31, p = 0.08). For the 58 subjects with few or no lesions, significant positive correlations between 〈D〉 and age are seen in bilateral CCG, right CST and right uncinate fasciculus (r = 0.32 to 0.40; p = 0.013 to 0.002). In addition, ANCOVA applied to the whole dataset showed a main effect of lesion load on 〈D〉 in right CST (F(1,86) = 7.12, p < 0.01) and a trend in right uncinate (F(1,86) = 3.09, p = 0.08).
Table 3.
Correlations of tract-averaged mean diffusivity (〈D〉) and fractional anisotropy (FA) with age in the eight fasciculi-of-interest for the group of subjects (N = 58) with few or no white matter lesions (Fazekas scores of 0 or 1 on both deep and periventricular white matter lesion subscales) and those (N = 32) with significant white matter lesion load (Fazekas scores of 2 or 3 on either lesion subscale). Note that due to differing sample sizes, p values are not directly comparable between lesion groups.
| Fazekas score | 〈D〉 | FA | ||||||
|---|---|---|---|---|---|---|---|---|
| 0,1 | 2,3 | 0,1 | 2,3 | |||||
| r | p | r | p | r | p | r | p | |
|
| ||||||||
| Genu | 0.13 | 0.35 | 0.41 | 0.018 | −0.15 | 0.28 | −0.42 | 0.016 |
| Splenium | 0.0 | 0.98 | −0.05 | 0.80 | −0.13 | 0.34 | −0.14 | 0.46 |
| Left CCG | 0.33 | 0.01 | 0.36 | 0.04 | −0.20 | 0.14 | −0.07 | 0.72 |
| Right CCG | 0.32 | 0.013 | 0.33 | 0.06 | −0.14 | 0.28 | 0.02 | 0.92 |
| Left CST | 0.00 | 0.99 | 0.12 | 0.51 | −0.03 | 0.80 | 0.08 | 0.65 |
| Right CST | 0.38 | 0.003 | 0.06 | 0.75 | 0.07 | 0.62 | 0.22 | 0.23 |
| Left uncinate | 0.13 | 0.34 | 0.45 | 0.01 | −0.03 | 0.80 | −0.18 | 0.33 |
| Right uncinate | 0.40 | 0.002 | 0.52 | 0.002 | −0.19 | 0.16 | −0.31 | 0.08 |
Correlations assessed using Pearson’s r. Bold numbers indicate correlations significant at the p < 0.05 level.
Discussion
This paper builds on our previous study of normal ageing by examining how brain atrophy and white matter lesions affect tract shape and integrity in a larger cohort of subjects utilizing several significant methodological improvements to the PNT method. The resulting data indicate that there is age-related topological change in corpus callosum genu and splenium relative to reference tracts derived from a young brain white matter atlas which is significantly mediated by global brain atrophy and ventricular enlargement, and that a number of tracts display significant correlations between water diffusion parameters and age. These correlations differ when analyzing those subjects with significant white matter lesion load separately from those without.
As discussed above, PNT is unique in that it provides a parameter, R, which indicates how the length and shape of the best match tract in each subject differs from that of the reference for a specific fasciculus-of-interest. Using this parameter, we previously found evidence for an age-related change in topology of corpus callosum genu in 40 subjects aged over 65 years (Bastin et al., 2008). Here, in a larger cohort and using reference tracts derived from a young brain white matter atlas rather than from a single young subject, we not only replicate this result, but also find evidence for an age-related change in splenium topology. In Bastin et al. (2008), it was proposed that such correlations might result from age-related global brain atrophy and ventricular enlargement, given the proximity of the various structures. This hypothesis was investigated in the current study, where the explained variance of the correlations was attenuated by 40 % for genu and 84 % for splenium after controlling for ICV and LVV. Since LVV was found to increase significantly with age after controlling for ICV, reflecting the commonly observed age-related loss of brain parenchymal tissue (Meier-Ruge et al., 1992), these data indicate that the shape of these callosal tracts, in particular splenium, is indeed significantly mediated by age-related global brain atrophy and ventricular enlargement.
Several recent studies have used quantitative tractography to assess the effects of normal ageing on white matter structure. Sullivan et al. (2006) found that 〈D〉 was significantly higher and FA lower in 10 older (65 to 79 years) compared with 10 younger (22 to 37 years) subjects in frontal callosal fibre bundles relative to posterior bundles, whilst Stadlbauer et al. (2008) found that association fibres showed the largest changes in FA per decade in 38 healthy volunteers aged 18 to 88 years. Sullivan et al. (2008), amongst other findings, reported that anterior (frontal forceps and genu) and superior lateral (longitudinal fasciculi and CCG) fibres showed more consistent age-related changes than posterior (occipital forceps and splenium) and inferior tracts in 120 healthy adults aged 20 to 81 years. They also found that ageing effects were more pronounced in 〈D〉 than FA, and that men had significantly higher FA than women in splenium. For the entire cohort, our results are consistent with these findings with significant age-related changes in 〈D〉 and FA in genu but not splenium, and 〈D〉 for bilateral CCG and uncinate fasciculi, both fibre systems with significant frontal lobe components. There are also gender differences in tract-averaged water diffusion parameters, with men having higher FA than women in seven out of the eight fibre systems investigated, most notably in the left lateralized tracts. Thus, Table 2 appears to confirm the ‘frontal ageing’ hypothesis in which anterior regions, especially callosal fibres, are more adversely affected by normal ageing than posterior regions (Pfefferbaum et al., 2005; Sullivan et al., 2006; Sullivan et al., 2008). However, the data presented above extends these previous tractography studies by investigating whether the presence of white matter lesions affects the patterns of age-related changes in water diffusion parameters seen in different brain regions.
White matter lesions, which are characterised by neuronal loss, demyelination and gliosis on neuropathological examination (Fazekas et al., 1993), have larger values of 〈D〉 and smaller values of FA, than surrounding normal-appearing white matter (Bastin et al., 2009). In addition, the pathological processes responsible for these lesions, be they ischaemic or resulting from alterations to blood-brain-barrier permeability (Fernando et al., 2006; Wardlaw et al., 2009), may produce more subtle widespread changes in white matter structure than is visible on conventional T2- and FLAIR-weighted MRI, thereby altering the values of 〈D〉 and FA for surrounding normal-appearing white matter. Thus, water diffusion parameters measured in tracts which pass through areas harbouring these lesions in individuals with high lesion load may be significantly different from those measured elsewhere in the brain or in subjects with few or no lesions. Including these data in analyses may overstate the effects of normal ageing in certain regions and lead to the observed anterior-posterior gradient in age-related water diffusion parameter changes. Support for this view comes from a recent study by Vernooij et al. (2008) who used TBSS to investigate whether loss of white matter in normal ageing is related to the ageing process itself or results from specific white matter pathology. In 832 subjects aged over 60 years, they found that multiple regions of normal-appearing white matter showed significant age-related changes in water diffusion parameters. Yet after controlling for white matter atrophy and lesions only a few regions remained significant, specifically a small bilateral region in the inferior longitudinal fasciculus. Our data provides support for the thesis that white matter lesions play a significant role in driving the observed regional heterogeneity in age-related changes in water diffusion parameters. Specifically, Table 3 suggests that the pattern of correlations between water diffusion parameters and age differs for a number of tracts when comparing the group with significant white matter lesion load to the group without. Fig. 6, however, shows a confound to understanding the role of white matter lesions here, namely the large variability of 〈D〉 and FA values in genu and, in particular, splenium across this population. Such variability, which may in part result from differing amounts of partial volume contamination of white matter signal by CSF, could be masking more subtle age-related changes in tissue microstructure. This variability may be the reason why even though Fig. 3 shows that the intersection between the group maps of the segmented fasciculi-of-interest and white matter lesion location is greater in splenium than genu, there is not a great difference in the size of water diffusion parameter versus age correlations between the two groups of subjects in this posterior tract. Finally, Table 3 shows that there are significant correlations between water diffusion parameters and age, specifically 〈D〉 in bilateral CCG, right CST and right uncinate fasciculus, even in subjects with few or no white matter lesions. This suggests that in the absence of visible pathology there is still subtle age-related deterioration in white matter integrity that affects tracts throughout the brain.
In our previous study of normal ageing (Bastin et al., 2008), we found a trend towards a significant negative correlation between tract-averaged FA and age in corpus callosum genu. However, there were no significant correlations between water diffusion parameters and age in any of the other seven tracts investigated. This is in marked contrast to the data presented above, where there are a number of significant age-related correlations, especially involving 〈D〉, spread across these same tracts. One obvious reason for this finding, in addition to the increase in statistical power provided by the current study and the potential improvement in connectivity data resulting from use of a tractography algorithm that models more than one fibre per voxel (Behrens et al., 2007), is that the methodological improvements to the PNT method described above are significantly improving tract segmentation. These enhancements take the form of using reference tracts derived from a white matter atlas rather than from a potentially unrepresentative single subject (Muñoz Maniega et al., 2008), employing unsupervised learning methods to train tract matching models directly from the dataset under study without needing separate training data (Clayden et al., 2009b), and finally using these models to select only those streamlines that are likely to belong to each fasciculus-of-interest (Clayden et al., 2009a). While these first two elements undoubtedly strengthen the robustness of the PNT method, Fig. 1 suggests that streamline selection plays the pivotal role in ensuring accurate tract segmentation. In Bastin et al. (2008), careful visual assessment of the segmented tracts for each subject showed that PNT run with reference tracts taken from a single subject and with tract matching models trained using a separate dataset was able to provide anatomically plausible representations of the tract in question in 70 to 90 % of subjects. In the remaining individuals, the tracts were most often discarded not because the main trajectory of the tract was incorrect, but because there were significant branches heading into unrelated structures. This problem is clearly evident in the first column of Fig. 1, which shows the standard space group maps for several fasciculi-of-interest produced using PNT methodology similar to that employed in Bastin et al. (2008), albeit with atlas reference tracts, models trained directly from the dataset and underlying connectivity data modelled using two rather than one fibre per voxel. As demonstrated by the second column of Fig. 1, employing streamline selection removes almost all these unwanted structures without the need to threshold the connectivity data at a user-defined arbitrary level. This improvement in the representation of each contributing tract can then be expected to provide a concomitant increase in both statistical power, since tracts no longer need to be discarded as in the previous implementation of PNT, and the accuracy of tract-averaged water diffusion parameters calculated for each fasciculus-of-interest across the population.
In summary, these data show that the recently described improvements to the PNT method allow the automatic segmentation of tracts in the ageing brain to be performed with a high degree of accuracy, which in turn translates into improved measurement of tract shape and tract-averaged water diffusion parameters. Using this enhanced methodology we found an age-related change in tract topology affecting both genu and splenium which was significantly driven by general brain atrophy and ventricular enlargement. We also found age-related changes in water diffusion parameters, particularly 〈D〉, affecting a number of tracts throughout the brain, especially those with a significant frontal lobe component. This pattern of correlations differed when analyzing those subjects with significant white matter lesion load separately from those without, showing that presence of these lesions may impact on the regional heterogeneity of changes in white matter structure previously reported in normal ageing. Future studies investigating correlations between tract integrity and age should therefore take into account the presence of white matter lesions. However, there were also positive correlations between 〈D〉 and age in several tracts in subjects without significant lesion load, suggesting that white matter structural integrity declines subtly with age even in the absence of significant visible pathology.
Acknowledgments
AMM and KJF were supported by an MRC Clinician Scientist Fellowship. JMW is supported by the Scottish Funding Council (SFC) through the SINAPSE Collaboration (Scottish Imaging Network. A Platform for Scientific Excellence; http://www.sinapse.ac.uk). We also acknowledge the support of the MRC Centre for Cognitive Ageing and Cognitive Epidemiology. Computing support was provided by NIH grant R01 EB004155-03. The neuroimaging and analysis was performed in the SFC Brain Imaging Research Centre, University of Edinburgh (http://www.sbirc.ed.ac.uk).
References
- 1.Armstrong CL, Traipe E, Hunter JV, Haselgrove JC, Ledakis GE, Tallent EM, Shera D, van Buchem MA. Age-related, regional, hemispheric, and medial-lateral differences in myelin integrity in vivo in the normal adult brain. AJNR Am J Neuroradiol. 2004;25:977–984. [PMC free article] [PubMed] [Google Scholar]
- 2.Bartzokis G, Cummings JL, Sultzer D, Henderson VW, Nuechterlein KH, Mintz J. White matter structural integrity in healthy aging adults and patients with Alzheimer disease: a magnetic resonance imaging study. Arch Neurol. 2003;60:393–398. doi: 10.1001/archneur.60.3.393. [DOI] [PubMed] [Google Scholar]
- 3.Bastin ME, Clayden JD, Pattie A, Gerrish IF, Wardlaw JM, Deary IJ. Diffusion tensor and magnetization transfer MRI measurements of periventricular white matter hyperintensities in old age. Neurobiol Aging. 2009;30:125–136. doi: 10.1016/j.neurobiolaging.2007.05.013. [DOI] [PubMed] [Google Scholar]
- 4.Bastin ME, Piatkowski JP, Storkey AJ, Brown LJ, Maclullich AM, Clayden JD. Tract shape modelling provides evidence of topological change in corpus callosum genu during normal ageing. NeuroImage. 2008;43:20–28. doi: 10.1016/j.neuroimage.2008.06.047. [DOI] [PubMed] [Google Scholar]
- 5.Behrens TE, Berg HJ, Jbabdi S, Rushworth MF, Woolrich MW. Probabilistic diffusion tractography with multiple fibre orientations: What can we gain? NeuroImage. 2007;34:144–155. doi: 10.1016/j.neuroimage.2006.09.018. [DOI] [PMC free article] [PubMed] [Google Scholar]
- 6.Clayden JD, Bastin ME, Storkey AJ. Improved segmentation reproducibility in group tractography using a quantitative tract similarity measure. NeuroImage. 2006;33:482–492. doi: 10.1016/j.neuroimage.2006.07.016. [DOI] [PubMed] [Google Scholar]
- 7.Clayden JD, King MD, Clark CA. Shape modelling for tract selection. Proceedings of the 12th International Conference on Medical Image Computing and Computer Assisted Intervention (MICCAI) Lecture Notes in Computer Science. 2009a;5762:150–157. doi: 10.1007/978-3-642-04271-3_19. [DOI] [PubMed] [Google Scholar]
- 8.Clayden JD, Storkey AJ, Bastin ME. A probabilistic model-based approach to consistent white matter tract segmentation. IEEE Trans Med Imaging. 2007;26:1555–1561. doi: 10.1109/TMI.2007.905826. [DOI] [PubMed] [Google Scholar]
- 9.Clayden JD, Storkey AJ, Muñoz Maniega S, Bastin ME. Reproducibility of tract segmentation between sessions using an unsupervised modelling-based approach. NeuroImage. 2009b;45:377–385. doi: 10.1016/j.neuroimage.2008.12.010. [DOI] [PubMed] [Google Scholar]
- 10.Deary IJ, Leaper SA, Murray AD, Staff RT, Whalley LJ. Cerebral white matter abnormalities and lifetime cognitive change: a 67-year follow-up of the Scottish Mental Survey of 1932. Psychol Aging. 2003;18:140–148. doi: 10.1037/0882-7974.18.1.140. [DOI] [PubMed] [Google Scholar]
- 11.Fazekas F, Chawluk JB, Alavi A, Hurtig HI, Zimmerman RA. MR signal abnormalities at 1.5 T in Alzheimer’s dementia and normal aging. Am J Roentgenol. 1987;149:351–356. doi: 10.2214/ajr.149.2.351. [DOI] [PubMed] [Google Scholar]
- 12.Fazekas F, Kleinert R, Offenbacher H, Schmidt R, Kleinert G, Payer F, Radner H, Lechner H. Pathologic correlates of incidental MRI white matter signal hyperintensities. Neurology. 1993;43:1683–1689. doi: 10.1212/wnl.43.9.1683. [DOI] [PubMed] [Google Scholar]
- 13.Fernando MS, Simpson JE, Matthews F, Brayne C, Lewis CE, Barber R, Kalaria RN, Forster G, Esteves F, Wharton SB, Shaw PJ, O’Brien JT, Ince PG. White matter lesions in an unselected cohort of the elderly: molecular pathology suggests origin from chronic hypoperfusion injury. Stroke. 2006;37:1391–1398. doi: 10.1161/01.STR.0000221308.94473.14. [DOI] [PubMed] [Google Scholar]
- 14.Hua K, Zhang J, Wakana S, Jiang H, Li X, Reich DS, Calabresi PA, Pekar JJ, van Zijl PC, Mori S. Tract probability maps in stereotaxic spaces: analyses of white matter anatomy and tract-specific quantification. NeuroImage. 2008;39:336–347. doi: 10.1016/j.neuroimage.2007.07.053. [DOI] [PMC free article] [PubMed] [Google Scholar]
- 15.Jenkinson M, Smith S. A global optimisation method for robust affine registration of brain images. Med Image Anal. 2001;5:143–156. doi: 10.1016/s1361-8415(01)00036-6. [DOI] [PubMed] [Google Scholar]
- 16.Jones DK, Williams SC, Gasston D, Horsfield MA, Simmons A, Howard R. Isotropic resolution diffusion tensor imaging with whole brain acquisition in a clinically acceptable time. Hum Brain Mapp. 2002;15:216–230. doi: 10.1002/hbm.10018. [DOI] [PMC free article] [PubMed] [Google Scholar]
- 17.MacLullich AM, Ferguson KJ, Reid LM, Deary IJ, Starr JM, Seckl JR, Bastin ME, Wardlaw JM. Higher systolic blood pressure is associated with increased water diffusivity in normal-appearing white matter. Stroke. 2009;40:3869–3871. doi: 10.1161/STROKEAHA.109.547877. [DOI] [PubMed] [Google Scholar]
- 18.Marner L, Nyengaard JR, Tang Y, Pakkenberg B. Marked loss of myelinated nerve fibers in the human brain with age. J Comp Neurol. 2003;462:144–152. doi: 10.1002/cne.10714. [DOI] [PubMed] [Google Scholar]
- 19.Meier-Ruge W, Ulrich J, Brühlmann M, Meier E. Age-related white matter atrophy in the human brain. Ann N Y Acad Sci. 1992;673:260–269. doi: 10.1111/j.1749-6632.1992.tb27462.x. [DOI] [PubMed] [Google Scholar]
- 20.Muñoz Maniega S, Bastin ME, McIntosh AM, Lawrie SM, Clayden JD. Atlas-based reference tracts improve automatic white matter segmentation with neighbourhood tractography. Proc Intl Soc Magn Reson Med. 2008;16:3318. [Google Scholar]
- 21.Pfefferbaum A, Adalsteinsson E, Sullivan EV. Frontal circuitry degradation marks healthy adult aging: Evidence from diffusion tensor imaging. NeuroImage. 2005;26:891–899. doi: 10.1016/j.neuroimage.2005.02.034. [DOI] [PubMed] [Google Scholar]
- 22.Pierpaoli C, Jezzard P, Basser PJ, Barnett A, Di Chiro G. Diffusion tensor MR imaging of the human brain. Radiology. 1996;201:637–648. doi: 10.1148/radiology.201.3.8939209. [DOI] [PubMed] [Google Scholar]
- 23.Piguet O, Double KL, Kril JJ, Harasty J, Macdonald V, McRitchie DA, Halliday GM. White matter loss in healthy ageing: a postmortem analysis. Neurobiol Aging. 2009;30:1288–1295. doi: 10.1016/j.neurobiolaging.2007.10.015. [DOI] [PubMed] [Google Scholar]
- 24.Shenkin SD, Rivers CS, Deary IJ, Starr JM, Wardlaw JM. Maximum (prior) brain size, not atrophy, correlates with cognition in community-dwelling older people: a cross-sectional neuroimaging study. BMC Geriatr. 2009;9:12. doi: 10.1186/1471-2318-9-12. [DOI] [PMC free article] [PubMed] [Google Scholar]
- 25.Stadlbauer A, Salomonowitz E, Strunk G, Hammen T, Ganslandt O. Age-related degradation in the central nervous system: assessment with diffusion-tensor imaging and quantitative fiber tracking. Radiology. 2008;247:179–188. doi: 10.1148/radiol.2471070707. [DOI] [PubMed] [Google Scholar]
- 26.Sullivan EV, Adalsteinsson E, Pfefferbaum A. Selective age-related degradation of anterior callosal fiber bundles quantified in vivo with fiber tracking. Cereb Cortex. 2006;16:1030–1039. doi: 10.1093/cercor/bhj045. [DOI] [PubMed] [Google Scholar]
- 27.Sullivan EV, Pfefferbaum A. Diffusion tensor imaging and aging. Neurosci Biobehav Rev. 2006;30:749–761. doi: 10.1016/j.neubiorev.2006.06.002. [DOI] [PubMed] [Google Scholar]
- 28.Sullivan EV, Rohlfing T, Pfefferbaum A. Quantitative fiber tracking of lateral and interhemispheric white matter systems in normal aging: Relations to timed performance. Neurobiol Aging. 2008 doi: 10.1016/j.neurobiolaging.2008.04.007. In press. [DOI] [PMC free article] [PubMed] [Google Scholar]
- 29.Vernooij MW, de Groot M, van der Lugt A, Ikram MA, Krestin GP, Hofman A, Niessen WJ, Breteler MM. White matter atrophy and lesion formation explain the loss of structural integrity of white matter in aging. NeuroImage. 2008;43:470–477. doi: 10.1016/j.neuroimage.2008.07.052. [DOI] [PubMed] [Google Scholar]
- 30.Wakana S, Caprihan A, Panzenboeck MM, Fallon JH, Perry M, Gollub RL, Hua K, Zhang J, Jiang H, Dubey P, Blitz A, van Zijl P, Mori S. Reproducibility of quantitative tractography methods applied to cerebral white matter. NeuroImage. 2007;36:630–644. doi: 10.1016/j.neuroimage.2007.02.049. [DOI] [PMC free article] [PubMed] [Google Scholar]
- 31.Wardlaw JM, Doubal F, Armitage P, Chappell F, Carpenter T, Muñoz Maniega S, Farrall A, Sudlow C, Dennis M, Dhillon B. Lacunar stroke is associated with diffuse blood-brain barrier dysfunction. Ann Neurol. 2009;65:194–202. doi: 10.1002/ana.21549. [DOI] [PubMed] [Google Scholar]
- 32.Wardlaw JM, Ferguson KJ, Graham C. White matter hyperintensities and rating scales-observer reliability varies with lesion load. J Neurol. 2004;251:584–590. doi: 10.1007/s00415-004-0371-x. [DOI] [PubMed] [Google Scholar]
- 33.Wardlaw JM, Sandercock PA, Dennis MS, Starr J. Is breakdown of the blood-brain barrier responsible for lacunar stroke, leukoaraiosis, and dementia? Stroke. 2003;34:806–812. doi: 10.1161/01.STR.0000058480.77236.B3. [DOI] [PubMed] [Google Scholar]
- 34.Wheeler-Kingshott CA, Cercignani M. About “Axial” and “Radial” Diffusivities. Magn Reson Med. 2009;61:1255–1260. doi: 10.1002/mrm.21965. [DOI] [PubMed] [Google Scholar]
- 35.Zhan W, Zhang Y, Mueller SG, Lorenzen P, Hadjidemetriou S, Schuff N, Weiner MW. Characterization of white matter degeneration in elderly subjects by magnetic resonance diffusion and FLAIR imaging correlation. NeuroImage. 2009;47(Suppl 2):T58–65. doi: 10.1016/j.neuroimage.2009.02.004. [DOI] [PMC free article] [PubMed] [Google Scholar]