

Abstract
Aim
In contrast to extensive reports on the roles of Nav1.5 α-subunits, there have been few studies associating the β-subunits with cardiac arrhythmogenesis. We investigated the sino-atrial and conduction properties in the hearts of Scn3b−/− mice.
Methods
The following properties were compared in the hearts of wild-type (WT) and Scn3b−/− mice: (1) mRNA expression levels of Scn3b, Scn1b and Scn5a in atrial tissue. (2) Expression of the β3 protein in isolated cardiac myocytes. (3) Electrocardiographic recordings in intact anaesthetized preparations. (4) Bipolar electrogram recordings from the atria of spontaneously beating and electrically stimulated Langendorff-perfused hearts.
Results
Scn3b mRNA was expressed in the atria of WT but not Scn3b−/− hearts. This was in contrast to similar expression levels of Scn1b and Scn5a mRNA. Immunofluorescence experiments confirmed that the β3 protein was expressed in WT and absent in Scn3b−/− cardiac myocytes. Lead I electrocardiograms from Scn3b−/− mice showed slower heart rates, longer P wave durations and prolonged PR intervals than WT hearts. Spontaneously beating Langendorff-perfused Scn3b−/− hearts demonstrated both abnormal atrial electrophysiological properties and evidence of partial or complete dissociation of atrial and ventricular activity. Atrial burst pacing protocols induced atrial tachycardia and fibrillation in all Scn3b−/− but hardly any WT hearts. Scn3b−/− hearts also demonstrated significantly longer sinus node recovery times than WT hearts.
Conclusion
These findings demonstrate, for the first time, that a deficiency in Scn3b results in significant atrial electrophysiological and intracardiac conduction abnormalities, complementing the changes in ventricular electrophysiology reported on an earlier occasion.
Keywords: atrial arrhythmias, beta3, cardiac electrophysiology, Scn3b, sodium channel
Previous studies have established that genetic modifications involving the cardiac α-subunit, SCN5A, can result in arrhythmic cardiac conditions. These include not only ventricular conditions such as the Brugada (BrS) (Roberts & Brugada 2000) and long QT syndromes (LQTS) (Wang et al. 1995), but also atrial conditions, such as atrial fibrillation (AF) (Morita et al. 2002, Olson et al. 2005, Chen et al. 2007). However, there are only a limited number of reports that have considered the possible associations of β-subunits with such human arrhythmic conditions. The mRNA encoding for these β-subunits are all expressed in human, skeletal and cardiac tissue (Makita et al. 1994, Isom et al. 1995b, Morgan et al. 2000, Stevens et al. 2001, Yu et al. 2003, Candenas et al. 2006). They have a number of possible functions. Firstly, they may regulate the membrane expression density of the Na+ channels themselves (Isom et al. 1995b, Chen et al. 2002). Secondly, the β-subunits contain extracellular immunoglobulin (Ig) loop domains that may have functions similar to those of cell adhesion molecules (CAMs) (Isom & Catterall 1996). Finally, these subunits may also modulate gating properties of the Na+ channel (Isom et al. 1992, 1995a, Morgan et al. 2000, Chen et al. 2002, Ko et al. 2005, Hakim et al. 2008).
Recent clinical studies have associated mutations in the genes encoding for β-subunits with cardiac arrhythmogenesis. One mutation involving the gene encoding for the β4 subunit (SCN4B) has been associated with LQT3 (Medeiros-Domingo et al. 2007). Three mutations involving the gene encoding for the β1 subunit (SCN1B) and one mutation in the gene encoding for the β3 subunit (SCN3B) have been associated with BrS (Watanabe et al. 2008, Hu et al. 2009). Similarly, there have been relatively few studies in murine models containing β-subunit mutations examining cardiac arrhythmogenesis. Electrocardiograms (ECGs) from mice lacking the Scn1b gene showed longer RR intervals and prolonged QT intervals compared to those shown in WT hearts (Lopez-Santiago et al. 2007). Additionally, ventricular tachycardia induced by programmed electrical stimulation was demonstrated in Langendorff-perfused hearts isolated from Scn3b−/− mice (Hakim et al. 2008).
The present study adds to the latter investigation, which was confined to examining ventricular electrophysiology. It goes on to associate the deletion of the Scn3b gene with abnormal atrial electrophysiology, as well as atrial-ventricular (A-V) block, conduction abnormalities and atrial arrhythmias. The following properties were compared in the hearts of WT and Scn3b−/− mice. Firstly, mRNA expression levels of Scn3b, Scn1b and Scn5a were explored in atrial tissue. Secondly, expression of β3 proteins was investigated in isolated cardiac myocytes using immunofluorescence methods. Thirdly, ECGs were investigated in intact anaesthetized mice. Finally, electrophysiological properties of isolated Langendorff-perfused hearts were assessed using bipolar electrogram (BEG) recordings. The latter were obtained from the atrial appendages of spontaneously beating and electrically stimulated hearts. Arrhythmogenicity and sinus node function was also investigated using atrial burst pacing (ABP) and sinus node recovery time (SNRT) protocols respectively.
Materials and methods
Experimental animals
The genetically modified mice used were first described by Hakim et al. (2008). The 129sv mice were kept in cages at a room temperature of 21 ± 1 °C in an animal facility with 12 h light/dark cycles. The mice had free access to sterilized rodent chow and water. All male and female offspring of the wild-type (WT) and Scn3b−/− mice (age 5–8 months) were randomly selected in all experiments and were killed by cervical dislocation in all real-time polymerase chain reaction and ex vivo experiments [Schedule 1: UK Animals (Scientific Procedures) Act 1986].
Analysis of Na+ channel α- and β-subunit transcripts
Analysis of mRNA expression levels of sodium channel α- and β-subunits was performed as described in a previous paper (Hakim et al. 2008), except that mRNA was isolated from atrial appendages (n = 3).
Cardiac myocyte isolation and immunolocalization of Scn3b subunits
A basic isolation buffer consisting of (in mm): 120 NaCl, 5.4 KCl, 5 MgSO4, 5.5 sodium pyruvate, 10 glucose, 20 taurine and 10 HEPES was used to make the following solutions. Firstly, a nitrilotriacetic acid (NTA) buffer consisted of the basic isolation buffer with 5 mm NTA and adjusted to pH 6.95. Secondly, a digestion buffer consisted of the basic isolation buffer to which 0.25 mm CaCl2, 1 mg mL−1 collagenase type 2 (Worthington, Lakewood, NJ, USA) and 1 mg mL−1 hyaluronidase (Sigma-Aldrich, Poole, UK) was added. Thirdly, a stop buffer consisted of the basic isolation buffer and containing 2 mg mL−1 bovine serum albumin (Sigma-Aldrich). Fourthly, a wash buffer consisted of the basic isolation buffer to which 0.6 mm CaCl2 was added. Finally, a storage buffer was similar to the wash buffer but contained 1.2 mm CaCl2. All the buffers created, except for the NTA buffer, had their pH adjusted to 7.4.
Hearts from adult mice were rapidly excised and submerged in ice-cold isolation buffer. The hearts were then retrogradely perfused for 2 min with NTA buffer using a variable speed peristaltic pump at a flow rate of 3.5 mL min−1(model EV045; Autoclude Peristaltic Pumps, Essex, UK). Before perfusion, the buffer was warmed to 37 °C with a water jacket and circulator (Techne model RB-5 A; Bibby Scientific Limited, Staffordshire, UK). Immediately following this, the NTA buffer was replaced with the digestion buffer and perfused in the same fashion for 12–15 min. Using watchmaker’s forceps, tissue was taken from the whole heart and placed in the stop buffer. After transferring into a 15 mL test tube, single myocytes were isolated from the harvested cardiac tissue through gentle trituration. After allowing 5 min for the cells to settle, the supernatant was then gently removed and the cells were washed using the wash buffer. Following a further 5 min, the isolated myocytes were resuspended and stored in the storage buffer. After each step following the harvesting of the cells, isolated myocytes were checked under a light microscope. Live myocytes appeared as smooth and rod-shaped cells.
Glass coverslips individually placed in the wells of a 24-well tissue culture plate were first coated with 0.1 mg mL−1 polylysine (Sigma-Aldrich) for 15 min at room temperature and air dried overnight. Isolated myocytes were attached to the coverslips by a brief centrifugation (900 rpm/115 g for 2–3 min). After the supernatant was carefully aspirated, cells were fixed by incubation in 1 mL 4% paraformaldehyde/phosphate-buffered saline (PBS) for 12 min at room temperature. Following this, the paraformaldehyde was removed from each well and replaced with 1 mL permeabilizing/blocking buffer solution, which contained 0.1% Triton X100, 0.02% saponin and 10% fetal calf serum in PBS. After 1 h incubation at room temperature, the solution was carefully removed. The myocytes were then incubated overnight at 4 °C in an affinity-purified rabbit anti-β3 antibody, diluted in the permeabilizing/blocking solution at a dilution of 1/50. This antibody was raised against the RPEGGKDFLIYE peptide (van Gassen et al. 2009). After aspirating the primary antibody solution, the myocytes were rinsed with a wash buffer, which contained 0.1% Triton X100 and 0.02% saponin in PBS. Following four such washes, the myocytes were incubated for 1 h at room temperature with an Alexa Fluor-labelled goat anti-rabbit antibody (Invitrogen, Paisley, UK), diluted in permeabilizing/blocking solution at a dilution of 1/1000. After a further five washes as described above, followed by a brief wash in distilled water, the coverslips were removed from the wells and air dried away from sunlight. They were then mounted on glass microscope slides using Vectastain hard mounting media (Vector Laboratories, Peterborough, UK). The myocytes were then analysed using a ×63 water-immersion objective lens and a Leica 6000 CS inverted microscope (Leica, Heidelberg, Germany). Alexa-Fluor was excited using a 488 nm argon laser and emission was collected between 500 and 580 nm. Images were obtained and analysed using the Leica AF software.
Surface ECG recordings in WT and Scn3b−/− mice
ECG recordings were recorded from randomly selected male and female mice (age 6 months). Prior to examination, each mouse was anaesthetized using an intraperitoneal injection of ketamine/xylazine (150 and 5 mg/kg respectively). Fifteen minutes after administration of the anaesthetic, the mice were placed on a custom-made heat block to maintain body temperature during data acquisition. Lead I ECGs were obtained using subcutaneous 29-gauge needle electrodes (ADInstruments, Oxfordshire, UK), inserted in the left and right foreleg. These signals were pre-amplified using an NL100AK headstage and amplified with an NL104A amplifier (Neurolog, Hertfordshire, UK). The signals were then band-pass filtered between 40 Hz and 1 kHz using an NL125/6 filter (Neurolog) and digitized using an analog to digital converter (CED 1401plus MKII; Cambridge Electronic Design, Cambridge, UK). All digitized data were captured and analysed using Spike 2 software (Cambridge Electronic Design). The electrical signals were obtained at a sampling frequency of 5 kHz and acquired over a 5-min period. From each ECG recording, a 1-min period was analysed, to minimize variations between beats. The following parameters were investigated: P wave duration, RR interval, PR interval, QTpeak and QT intervals. The latter two intervals were measured from the onset of the QRS complex to the end and the peak of the T wave respectively. These intervals were expressed both uncorrected and corrected for heart rate (HR) using the modified Bazett’s formula, QTc = QT/(RR/100)1/2, which allows for the high HR observed in mice (Mitchell et al. 1998).
Electrophysiological studies in isolated WT and Scn3b−/− hearts
The electrophysiological experiments were carried out in isolated Langendorff-perfused WT (n = 15) and Scn3b−/− (n = 15) hearts, and were set up as described in a previous study (Hakim et al. 2008). Each experiment typically lasted a period of up to 45 min to ensure that none of the electrophysiological recordings was the result of preparation deterioration. Following cannulation, all preparations were first permitted to assume their normal pattern of electrical activity over a period of 5 min. This was confirmed in BEG recordings obtained from the left atrial (LA) appendages. Atrial and ventricular contributions to such electrograms were distinguished by moving the position of the recording electrodes, from the centre to the lower extremity of the LA appendage, towards the ventricles. The ventricular contribution could then be clearly distinguished from the atrial contribution, through its relatively greater amplitude. The recording electrodes were then positioned in this lower region of the LA appendage throughout the remainder of each experiment.
Atrial BEG recordings
In all experiments analysing the atria of the isolated, perfused murine heart, paired platinum stimulating electrodes (1 mm interpole spacing) were positioned over the epicardial surface of the right atrial (RA) appendage. Spontaneous atrial activity was examined by recording from the surface of the LA appendage using a silver chloride (2 mm tip diameter) recording electrode (Linton Instrumentation, Cambridgeshire, UK), which was manually positioned on the heart. The electrical signals obtained from these hearts provided BEG recordings. These signals were amplified and high-pass filtered for electrogram recordings (30 Hz to 1 kHz) using a Gould 2400S amplifier (Gould-Nicolet Technologies, Essex, UK) and then digitized using a digital converter (CED 1401plus MKII; Cambridge Electronic Design) at a sampling frequency of 5 kHz. All digitized data were then captured and analysed using Spike 2 software (Cambridge Electronic Design).
Atrial burst pacing and SNRT
Atrial electrophysiological activity was further assessed using established stimulation techniques (Berul et al. 1996, Kovoor et al. 2001). The stimulating electrodes described above were connected to a Grass S48 stimulator (Grass-Telefactor, UK, Slough, UK), which delivered square-wave stimuli with a 2 ms duration at 1.5 to two times excitation threshold. The stimulation protocols were only applied to hearts first showing a regular spontaneous atrial rhythm. Inducibility of atrial arrhythmia and sinus dysfunction were assessed using ABP and SNRT protocols respectively. The ABP protocol imposed a drive train of 50 pulses at a cycle length (CL) of 20 ms and the resulting atrial activity observed immediately after the completion of the protocol. The SNRT protocol consisted of pacing the RA appendage for 15 s at a CL of 150 ms. The SNRT was measured as the duration between termination of the protocol and the return of spontaneous atrial activity.
Data analysis and statistical procedures
Data obtained from all experiments were first imported into Microsoft EXCEL. Single-factor analysis of variance for independent samples (anova) was used to compare data sets from WT and Scn3b−/− (Microsoft EXCEL Analysis ToolPak). All results are shown as mean ± SEM values. Calculated values of P < 0.05 were considered statistically significant.
Results
mRNA and protein expression levels of Na+ channel subunits
The real-time polymerase chain reaction (RT-PCR) was used to investigate mRNA expression levels of the Na+ channel subunits Scn3b, Scn1b and Scn5a in tissue from the RA and LA appendages of WT and Scn3b−/− mice hearts. Figure 1a demonstrates that Scn3b mRNA was expressed at similar levels (black column) in LA and RA appendages of WT hearts (RA+/+ and LA+/+; n = 3, P > 0.05). The ratio between the β3 and Nav1.5 mRNA expression levels in the LA and RA of WT murine hearts was 1 : 470 and 1 : 380, respectively, giving an overall ratio of 1 : 420 in the atrial appendages. In contrast, there was no detectable expression of Scn3b mRNA in the LA and RA appendages of the Scn3b−/− hearts (RA−/− and LA−/−; n = 3, P < 0.05). Both the LA and RA appendages showed similar and detectable expression levels of Scn1b (Fig. 1b) and Scn5a mRNA (Fig. 1c) in WT (black column) and Scn3b−/− hearts (white column, n = 3 each; P > 0.05). Furthermore, both WT and Scn3b−/− hearts showed significantly higher expression levels of Scn1b and Scn5a mRNA in the LA than in the RA appendages (n = 3 each, P < 0.05).
Figure 1.
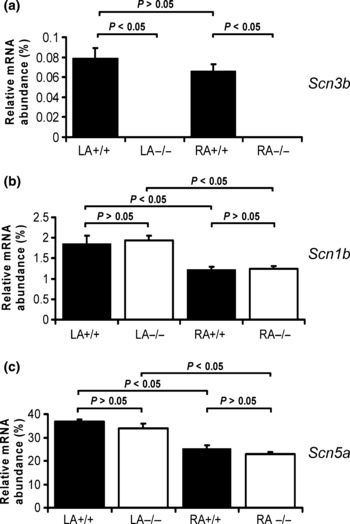
Real-time polymerase chain reaction analysis of mRNA expression. The relative expression of mRNA (normalized and calculated as percentage of GAPDH expression) of encoding Na+ channel subunit transcripts. The histograms show data from the left and right atrial appendages (LA and RA respectively) of WT (black columns) and Scn3b−/− (white columns) mice. (a) mRNA transcripts for Scn3b was shown in atrial appendages of WT (left: LA+/+; right: RA+/+; n = 3) and not detectable in atrial appendages of Scn3b−/− mice (left: LA−/−; right: RA−/−; n = 3). The levels of Scn1b and Scn5a transcripts (panels b and c respectively) in the left and right atrial appendages of Scn3b−/− hearts were similar to corresponding expression levels in the atrial appendages of WT hearts (P > 0.05). Significance levels of P < 0.05 (single factor anova) demonstrated differences between Scn3b−/− (n = 3 hearts) and WT hearts (n = 3 hearts) and the left and right atrial appendages.
Having confirmed the presence and absence of Scn3b mRNA expression in WT and Scn3b−/− myocytes, respectively, the present study used immunofluorescence methods to assess the expression of the β3 subunits in cardiac myocytes. Single ventricular myocytes were first enzymatically isolated from WT and Scn3b−/− hearts. To examine the localization of β3 subunits in these myocytes, an antibody specific to an epitope of the β3 protein was used and visualized using immunocytochemistry. These experiments confirmed the expression of β3 subunits of WT myocytes (n = 7 cells) in a striated pattern (Fig. 2a). In contrast, no such expression was shown in Scn3b−/− myocytes (n = 8 cells, Fig. 2b).
Figure 2.
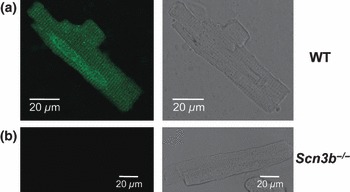
Immunostaining of β3 subunits in wild-type (WT) and Scn3b−/− myocytes. A single cardiac myocyte isolated from a WT heart showing the expression of β3 subunits in a striated pattern (a: left panel). This expression is absent in Scn3b−/− myocytes (b: left panel). The integrity of the cardiac myocytes is confirmed by the corresponding bright field images (a, b: right panels).
Scn3b−/− mice exhibit abnormal ECG characteristics
The subsequent electrophysiological studies obtained both ECGs from intact mice (Fig. 3) and BEG from isolated perfused hearts (Figs 4–8). The ECG recordings permitted detailed visualization of individual features relating to conduction through different regions of the heart. The BEG recordings permitted correlation of the timings of individual atrial and ventricular deflections. The initial electrophysiological experiments thus compared lead I ECGs from anaesthetized intact WT (n = 7) and Scn3b−/− (n = 6) mice. Figure 3a shows a single ECG complex obtained from a WT mouse. This is displayed at a rapid time base to emphasize the relevant ECG features, in which an asterisk (*) represents the P wave. It confirms previous studies, in which it was difficult to identify the QRS complex, as the early repolarization phase was distorted by the T wave (Berul et al. 1996, Doevendans et al. 1998, Chaves et al. 2003). Nevertheless, values of the following features could be obtained from these recordings from the WT and Scn3b−/− mice (Table 1): RR interval, P wave duration, PR, QTpeak, QT, QTc-peak and QTc interval. The latter two characteristics were corrected for the RR interval. These individual values were obtained over a 1-min period and averaged to minimize error due to beat to beat variations, giving mean ± SEM values.
Figure 3.
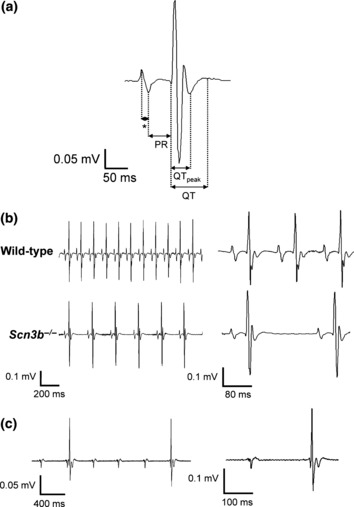
Surface ECGs from anaesthetized wild-type (WT) and Scn3b−/− mice. (a) Single electrocardiographic PQRST complex obtained from a WT mouse. The asterisk (*) represents the P wave. (b) Representative ECG recordings obtained from WT (top panel) and Scn3b−/− mice (bottom panel). Scn3b−/− mice (n = 5) consistently showed a slower heart rate and prolonged PR interval compared to those shown in WT mice (n = 7, P < 0.001). (c) ECG from a Scn3b−/− mouse that showed ventricular, QT complexes, that were independent of the atrial, P, waves. Despite the regular interval between the P waves, the intervals between the QT complexes were irregular. ECG traces are also shown at a faster time base (b and c: right panels).
Figure 8.
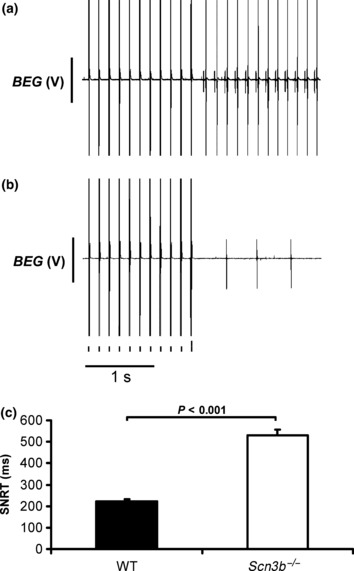
Sinus node recovery time in wild-type (WT) and Scn3b−/− hearts. Bipolar electrogram (BEG) recordings showing the sinus node recovery time (SNRT) in (a) WT and (b) Scn3b−/− hearts. (c) Mean (±SEM) SNRT values measured from WT (n = 5 hearts) and Scn3b−/− hearts (n = 5 hearts) (black and white columns respectively). Significance level of P < 0.001 (single factor anova) demonstrates differences in the SNRT of WT and Scn3b−/− hearts.
Table 1.
ECG characteristics of wild-type and Scn3b−/− mice
| Wild-type (n = 7) | Scn3b−/− (n = 5) | |
|---|---|---|
| RR (ms) | 176 ± 1 | 250 ± 1* |
| P wave duration (ms) | 9.5 ± 0.1 | 10.6 ± 0.2*† |
| PR (ms) | 38 ± 0.1 | 42.2 ± 0.3* |
| QTpeak (ms) | 29.2 ± 0.3 | 30.7 ± 1 |
| QT (ms) | 54.8 ± 0.7 | 55.8 ± 0.5 |
| QTc-peak (ms) | 22.7 ± 0.3 | 22.6 ± 1.2 |
| QTc (ms) | 41.5 ± 0.5 | 40.6 ± 0.6 |
P < 0.001.
Calculated from six mice.
Figure 3b shows ECG traces of WT (top panel) and Scn3b−/− (bottom panel) mice demonstrating sinus rhythm (SR). This figure also shows these traces at a faster time base (right panels) to allow identification of specific ECG features. Thus, every WT mouse studied showed SR with an RR interval of 176 ± 1 ms (n = 7). This RR interval corresponded to an HR of 392 ± 2 beats min−1. Five of the six Scn3b−/− mice showed SR. However, they showed a significantly longer RR interval of 250 ± 1 ms (n = 5) compared to that shown by WT mice (P < 0.001). This corresponded to a slower HR of 356 ± 8 beats min−1 (Fig. 3b, bottom panel). The remaining Scn3b−/− mouse showed P waves occurring at regular intervals and QRS complexes occurring independently at irregular intervals throughout the 5 min recording period (Fig. 3c). Closer inspection of the trace at a faster time base (right panel) demonstrates that the ECG waveforms were similar to those shown previously (Fig. 3a,b, right panels). A second Scn3b−/− mouse that showed SR initially for 3 min also showed the abnormal characteristics described above. The P waves shown in Scn3b−/− mice were similar to those shown in WT mice (Fig. 3b). However, the P wave duration in the Scn3b−/− mice was 10.6 ± 0.2 ms (n = 6), which was significantly longer than that observed in WT mice (9.5 ± 0.1 ms, n = 7; P < 0.001). The five Scn3b−/− mice that exhibited SR also showed a longer PR interval (42.2 ± 0.3 ms, n = 5) than that shown by WT mice (38 ± 0.1 ms, n = 7; P < 0.001). The QTpeak, QT, QTc-peak and QTc values were similar in WT and Scn3b−/− mice (Table 1).
Scn3b−/− hearts exhibit abnormal spontaneous atrial activity
Experiments in isolated Langendorff-perfused WT and Scn3b−/− hearts first examined spontaneously beating hearts. These involved BEG recordings that permitted the timings of atrial, and the larger ventricular deflections to be compared. This assessment permitted detection both of different degrees of heart block, as well as abnormal patterns of atrial activity. Figure 4a shows both atrial (a) and ventricular (v) deflections in a representative BEG recording obtained from a WT heart. These hearts showed a mean basic cycle length (BCL) of 168 ± 6.8 ms (n = 15 hearts). The recordings obtained from all 15 WT hearts consistently demonstrated SR, characterized by regular and closely coupled atrial and ventricular deflections at a constant A-V interval.
Figure 4.
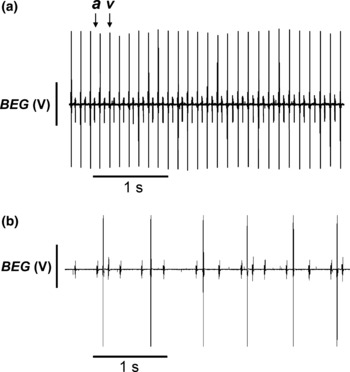
Bipolar electrogram (BEG) traces recorded from spontaneously beating wild-type (WT) and Scn3b−/− hearts. (a) Representative BEG recording from a spontaneously beating isolated, Langendorff-perfused WT murine cardiac preparation. Such preparations demonstrated closely coupled atrial (a) and ventricular (v) deflections reflecting a sinus rhythm. In all BEG recordings, the ventricular signals resulted in larger spikes than the smaller atrial spikes. (b) Representative traces of the abnormalities observed in isolated, Langendorff-perfused spontaneously beating Scn3b−/− hearts. In contrast in the WT, all Scn3b−/− heart preparations persistently demonstrated abnormal atrial and ventricular deflections, which were not synchronized with each other, suggesting third degree heart block.
In contrast to the observations in WT mice and the ECG findings in intact Scn3b−/− mice, all the Scn3b−/− hearts showed abnormal atrial activity in a pattern that was not gender specific (Table 2). Firstly, Scn3b−/− hearts showed evidence of A-V heart block. Thus, the BEG recordings from all 15 Scn3b−/− hearts studied largely consisted of successive atrial deflections which were irregularly timed (Fig. 4b). Furthermore, the ventricular deflections occurred asynchronously and at irregular intervals, giving a pattern resembling third degree heart block. Accordingly, the usual pattern of SR seen in WT hearts was the exception, rather than the rule. Thus, the BEG recordings demonstrated 12 episodes of SR in only 4 of 15 Scn3b−/− hearts. Each episode lasted a mean duration of 237.3 ± 85.2 s. These Scn3b−/− hearts then showed a BCL of 159 ± 3.8 ms that was not significantly different from the BCL shown in the SR of WT hearts (P > 0.05). These episodes of SR were accompanied by a significantly increased A-V interval compared to that shown in WT hearts. Thus, the A-V interval of the 15 WT hearts studied was 29.5 ± 0.28 ms (Fig. 5a), whereas the A-V interval measured in the Scn3b−/− hearts during such episodes of an SR was 52.5 ± 0.59 ms (4 of 15 hearts, P < 0.001) (Fig. 5b,c). These findings are consistent with A-V conduction delay and first degree heart block.
Table 2.
Atrial electrogram abnormalities observed in spontaneously beating Scn3b−/− hearts
| Electrogram features in Scn3b−/− hearts | |||||
|---|---|---|---|---|---|
| Scn3b−/− heart | Sex | Irregular atrial and ventricular deflections | Episodes of SR* | Sinus node exit block | Episodes of spontaneous AT† |
| 1 | Female | ✓ | ✓ | ||
| 2 | Female | ✓ | ✓ | ||
| 3 | Female | ✓ | Four | ✓ | Six |
| 4 | Male | ✓ | ✓ | ||
| 5 | Male | ✓ | |||
| 6 | Male | ✓ | ✓ | ||
| 7 | Female | ✓ | Two | ✓ | |
| 8 | Female | ✓ | Five | ✓ | |
| 9 | Female | ✓ | ✓ | ||
| 10 | Female | ✓ | |||
| 11 | Male | ✓ | ✓ | ||
| 12 | Male | ✓ | ✓ | Two | |
| 13 | Male | ✓ | ✓ | ||
| 14 | Female | ✓ | One | ✓ | |
| 15 | Female | ✓ | ✓ | ||
SR, sinus rhythm; AT, atrial tachycardia.
Total of 12 episodes with a mean duration of 237.3 ± 85.2 s (n = 4). All episodes were accompanied by a prolonged atrial-ventricular interval.
Total of eight episodes with a mean duration of 2.37 ± 0.7 ms (n = 2).
Figure 5.
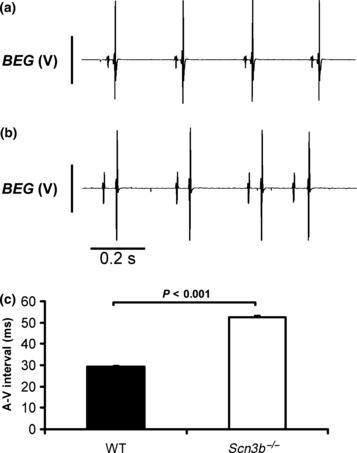
Differences in the atrio-ventricular intervals between spontaneously beating wild-type (WT) and Scn3b−/− hearts. (a) Representative bipolar electrogram (BEG) recording from a WT heart at a faster time base than shown in Figure 4. (b) Recording of an exceptional episode of sinus rhythm (SR) shown in Scn3b−/− hearts. When compared with an SR consistently shown in WT (a), a significantly longer interval was observed between the atrial and ventricular deflection and is suggestive of first degree heart block. (c) Values of the atrial-ventricular (A-V) interval (mean ± SEM) in WT and Scn3b−/− hearts (black and white columns respectively). Significance levels of P < 0.001 (single factor anova) demonstrate differences between WT (n = 15 hearts) and Scn3b−/− hearts (n = 4 hearts). In all cases, the ventricular spikes result in the larger, and the atrial spikes in the smaller deflections.
Secondly, even during such episodes of atrial deflections occurring at a normal BCL, there were missing atrial deflections in the BEG recordings (marked with an asterisk, Fig. 6a) observed in 13 of the 15 Scn3b−/− hearts studied. This phenomenon is suggestive of sinus node exit block. Thirdly, a total of eight episodes of spontaneous atrial tachycardia (AT) (Fig. 6b) occurred in 2 of the 15 Scn3b−/− hearts. Each episode had a mean duration of 2.37 ± 0.7 s. The average BCL of each episode at 44 ± 1.9 ms was significantly decreased (P < 0.001) from the BCL normally observed in atrial deflections (marked a) in hearts showing SR. Fourthly, BEG recordings of all 15 Scn3b−/− hearts demonstrated episodes of irregularly timed ventricular deflections (marked v), even during periods of regular atrial deflections that took place at a normal BCL. In the BEG recording shown in Figure 6a, the intervals separating the ventricular deflections were up to five to seven times longer than those separating the atrial deflections. Finally, none of the Scn3b−/− hearts studied showed spontaneous AF. The above findings nevertheless suggest significant abnormalities in both atrial activity and conduction between the atria and ventricles in spontaneously beating Scn3b−/− hearts.
Figure 6.
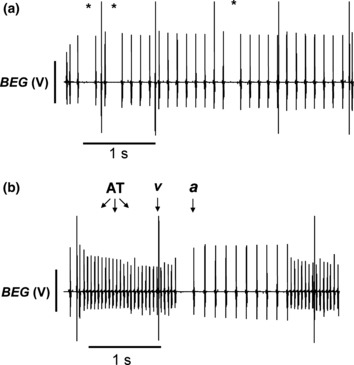
Electrogram abnormalities recorded from intrinsically paced Scn3b−/− hearts. (a) Single dropped atrial deflections (*) in bipolar electrogram (BEG) recordings from Scn3b−/− hearts, against a background of irregular ventricular activity, occurring at intervals larger than those of the atrial deflections. (b) BEG recording demonstrating a spontaneous episode of atrial tachycardia (AT) showing a frequency of ∼20 Hz. This phenomenon was observed in two of the 15 hearts studied. In all cases, the ventricular spikes result in the larger (v), and the atrial spikes in the smaller deflections (a).
Atrial burst pacing induces atrial arrhythmogenesis in Scn3b−/− hearts
The effects of electrical stimulation were then used to investigate the inducibility of atrial arrhythmias and sinus dysfunction. These experiments used stimulating electrodes positioned on the RA appendages in the same hearts as described above. The ABP experiments applied single drive trains each consisting of 50 stimuli at a CL of 20 ms, when the hearts were in periods of spontaneous and regular atrial activity. Figure 7 illustrates BEG recordings obtained before, during and immediately after the application of the ABP protocols, indicated by the closely spaced large deflections immediately above the 1 s time bar. The 15 WT hearts were subjected to a total of 622 ABP protocols, corresponding to an average of 41.5 ± 2.6 ABP protocols in each heart. All 15 hearts remained in SR following 99.2 ± 0.4% of the applied ABP protocols (617 out of a total of 622 protocols) (Fig. 7a). Closer inspection of the BEG recordings at a faster time base then demonstrated regular and consistent A-V intervals, with each of the successive atrial and ventricular deflections identical in waveform (Fig. 7b). The remaining 0.8 ± 0.4% of the applied ABP protocols (5 of the 622 protocols) induced episodes of AT. This occurred in only 4 of 15 hearts. Each episode lasted a mean duration of 1.2 ± 0.2 s. None of the 15 WT hearts studied demonstrated episodes of AF despite the application of 622 ABP protocols.
Figure 7.
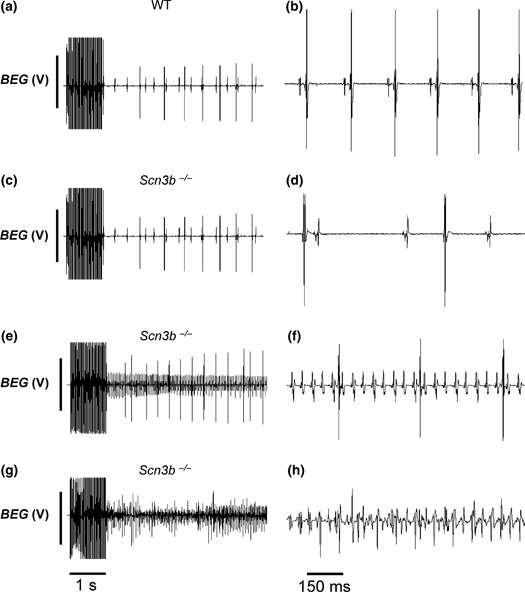
Results from atrial burst pacing (ABP) in wild-type (WT) (a, b) and Scn3b−/− (c–h) Langendorff-perfused hearts. Trace exemplifying a persistence of sinus rhythm following ABP in WT preparations in slow (a) and fast (b) time bases. (c–h) Examples of persistently regular atrial rhythm (c, d), atrial tachycardia resulting in regular deflections at a higher frequency (e, f) and atrial fibrillation resulting in irregular deflections at a higher frequency (g, h). In all cases, the ventricular spikes result in the larger, and the atrial spikes in the smaller deflections.
In contrast to WT hearts, all 13 Scn3b−/− hearts that were subject to ABP demonstrated significant subsequent atrial arrhythmogenicity. The further two hearts demonstrated spontaneous episodes of AT (hearts 3 and 12, Table 2) and were not studied using ABP. The Scn3b−/− hearts were subject to a total of 645 ABP protocols, corresponding to 49.6 ± 6.1 ABP protocols in each heart. Firstly, following the application of 51.2 ± 6.0% of the ABP protocols performed in all the hearts (308 out of the total of 645 protocols), the Scn3b−/− hearts continued to show a pattern of electrogram deflections similar to those shown prior to the application of the protocols (Fig. 7c). When displayed at a faster time base (Fig. 7d), the individual atrial deflections in such cases were similar in waveform to those shown in BEG recordings of WT hearts (Fig. 7b). Secondly, 24.7 ± 3.8% of the applied ABP protocols (169 of the total of 645 protocols) produced episodes of AT, with a mean duration of 6.92 ± 1.83 s for each episode. This phenomenon was seen in all 13 Scn3b−/− hearts. Figure 7e illustrates a BEG recording of such an episode of induced AT. Again, display of such records at a faster time base showed successive atrial deflections with similar waveforms and amplitudes (Fig. 7f). However, these occurred at a significantly shorter BCL compared to that of atrial deflections displaying SR. Finally, the remaining 24.1 ± 4.6% of all the performed ABP protocols (168 out of the 645 protocols) induced episodes of AF (Fig. 7g). Each episode lasted a mean duration of 10.7 ± 2.9 s. This was observed in all the 13 Scn3b−/− hearts. The atrial activity in these episodes was irregular, with successive atrial deflections assuming different amplitudes (Fig. 7h). This was in contrast to the regular atrial deflections shown in AT (Fig. 7f) or SR (Fig. 7b).
Scn3b−/− hearts demonstrate sinus node dysfunction
Sino-atrial conduction was assessed by analysing the SNRT in the whole heart preparations. A total of 18 such procedures were applied to each of the WT (Fig. 8a) and Scn3b−/− hearts (Fig. 8b) (n = 5 hearts each). The Scn3b−/− hearts demonstrated a significantly longer SNRT (529 ± 28.8 ms) than that of the WT hearts (221 ± 9.7 ms, P < 0.001) (Fig. 8c).
Taken together, the above findings clearly demonstrate readily inducible atrial arrhythmias and significant conduction abnormalities in Scn3b−/− hearts, in contrast to WT hearts.
Discussion
Alterations in the pore-forming α-subunits of the cardiac sodium (Na+) channel have previously been associated with cardiac arrhythmic conditions including BrS and LQTS (Brugada & Brugada 1992, Wang et al. 1995). However, mammalian Na+ channels also include one or more β-subunits whose specific associations with α-subunits have yet to be fully characterized. Nevertheless, analysis of the protein structures has suggested that on the one hand, β1 and β3 subunits can be non-covalently associated with α-subunits (Isom et al. 1992, Morgan et al. 2000). On the other hand, β2 and β4 subunits may associate with α-subunits through covalent bonds (Isom et al. 1995a, Yu et al. 2003). Furthermore, immunofluorescence studies have demonstrated that the β1 and β3 subunits are expressed along with the neuronal Nav1.1, Nav1.3 and Nav1.6 α-subunits in the transverse-tubules of mouse ventricular myocytes. In contrast, Nav1.5 α-subunits were expressed in the intercalated discs along with the remaining β2 and β4 subunits (Maier et al. 2004). All four β-subunits are also expressed in the mouse sinus node (Maier et al. 2003).
β-subunits have been shown to regulate the level of Na+ channel expression in the plasma membrane (Isom et al. 1995b) and may also have roles similar to those of CAMs (Isom & Catterall 1996). In addition, mutations in or the absence of β-subunits have been associated with alterations in the gating kinetics of the Na+ channel. Such effects were demonstrated in whole cell patch-clamp studies in mouse ventricular myocytes (Lopez-Santiago et al. 2007, Hakim et al. 2008), human embryonic kidney (HEK293) cells (Medeiros-Domingo et al. 2007), Chinese hamster ovary (CHO) cells (Watanabe et al. 2008) and Xenopus oocytes (Makita et al. 2000). Similar results were also obtained from two-electrode voltage clamp studies in Xenopus oocytes (Morgan et al. 2000) and CHO cells (Ko et al. 2005).
However, only three clinical studies have thus far related alterations in β-subunits to ventricular arrhythmogenesis. Thus, mutations in the SCN4B gene resulting in altered β4 subunits were linked to LQTS (Medeiros-Domingo et al. 2007). These mutations appeared to alter the gating properties of the Na+ channel in HEK293 cells expressing both the Nav1.5 and the altered form of the β4 subunit (Medeiros-Domingo et al. 2007). Such co-expression resulted in larger late Na+ window currents than shown by cells expressing WT β4 and Nav1.5 subunits. This could account for the LQTS-like clinical features (Bennett et al. 1995, Abriel et al. 2001). Mutations in the SCN1B and SCN3B genes, resulting in altered β1 and β3 subunits, respectively, were associated with human BrS (Watanabe et al. 2008, Hu et al. 2009). CHO cells transfected with WT-SCN5A and the mutated SCN1B gene showed significant decreases in the size of the Na+ current (Watanabe et al. 2008). Transfection of the mutated form of the SCN3B gene with WT SCN5A and SCN1B genes appeared to prevent the localization of the Na+ channel to the surface membrane in modified human embryonic kidney cells, TSA201 (Hu et al. 2009). This also resulted in a significantly reduced Na+ current compared to that shown in cells transfected with WT SCN5A, SCN1B and SCN3B genes.
Similarly, there has only been one report associating modifications of β-subunits with clinical changes in atrial electrophysiology. Thus, in 480 patients with AF, two mutations in the SCN1B gene and two mutations in the SCN2B gene were identified (Watanabe et al. 2009). Each mutation occurred separately in four AF patients. Transfection of the Nav1.5 subunit with either of the mutated β1 or β2 subunits in CHO cells demonstrated reduced Na+ currents when compared with currents shown in cells transfected with WT Nav1.5 subunit and β-subunits.
The present experiments demonstrate, for the first time, an atrial arrhythmic and conduction phenotype in a genetically modified murine model deficient in the β3 subunit of the Na+ channel. A previous report had described the generation of the Scn3b−/− mice, using homologous recombination in embryonic stem cells (Hakim et al. 2008). Firstly, RT-PCR experiments demonstrated a significant expression of Scn3b mRNA in both the RA and LA appendages of WT, but not of Scn3b−/− hearts. In contrast, the expression levels of Scn5a and Scn1b mRNA were similar in both WT and Scn3b−/− hearts, despite the 57% identity between the Scn1b and Scn3b genes (Morgan et al. 2000). Furthermore, ratios between the β3 and Nav1.5 mRNA expression levels in the LA and RA appendages of WT murine hearts were 1 : 470 and 1 : 380 respectively. The overall ratio in the atria of WT murine hearts was thus 1 : 420. This larger mRNA expression level of α-subunits than β-subunits confirms an earlier report, which examined the mRNA expression levels of ion channel subunits, including β1, β3 and Nav1.5 subunits in WT murine hearts (Marionneau et al. 2005). However, Marionneau et al. (2005) reported a smaller ratio of 1 : 200 between the β3 and Nav1.5 mRNA expression levels, suggesting a larger β3 mRNA expression level in WT atrial tissue.
Secondly, immunofluorescence experiments confirmed the expression, or otherwise, of the β3 subunit in the WT and Scn3b−/− myocytes respectively. These experiments applied an antibody specific to the β3 protein to isolated cardiac myocytes from WT and Scn3b−/− mice. Confocal microscopic visualization then demonstrated that the β3 subunit was expressed in a striated pattern in WT myocytes. This confirms a previous study which showed a similar expression pattern of β3 subunits in WT myocytes (Maier et al. 2004). In contrast, no such expression was observed in Scn3b−/− myocytes. The above findings confirm the results of the expression studies of Scn3b mRNA.
Thirdly, the surface ECG findings show, for the first time, conduction abnormalities in the atria and ventricles of anaesthetized Scn3b−/− mice. On the one hand, all seven WT mice demonstrated SR. They showed an RR interval corresponding to an HR of 392 ± 2 beats min−1. This is lower than the HR observed in conscious WT mice, which typically ranges from 450 to 750 beats min−1. However, this observation is consistent with the lower HR demonstrated in mice anaesthetized with ketamine and xylazine (Chaves et al. 2003, Xu et al. 2007). On the other hand, five of the six Scn3b−/− mice also showed SR. Under the same anaesthetic conditions, these mice showed a slower HR of 356 ± 8 beats min−1. This is consistent with a previous finding in Scn1b−/− hearts (Lopez-Santiago et al. 2007). Scn3b−/− mice also showed longer P wave durations and more prolonged PR intervals compared to those shown in WT mice, suggesting conduction abnormalities. These findings are similar to a previous clinical report, which associated alterations in the β1 subunit with conduction abnormalities. Thus, patients with mutations in the SCN1B gene demonstrated prolonged PR and His-ventricular intervals (Watanabe et al. 2008). Two Scn3b−/− mice showed abnormal ventricular rhythms, with one mouse showing abnormalities throughout the 5 min recording period and the second mouse showing such abnormalities after an initial 3 min period of SR.
Fourthly, ex vivo experiments in isolated Langendorff-perfused hearts demonstrated marked abnormalities in the electrophysiology of Scn3b−/− hearts. They directly recorded BEGs from the LA appendages of spontaneously beating WT and Scn3b−/− hearts. WT hearts then demonstrated SR, which consisted of regular and closely coupled atrial and ventricular deflections. In contrast, Scn3b−/− hearts showed first and third degree heart block. They also showed dropped atrial deflections, consistent with sinus node exit block. Perfused hearts were then subjected to an ABP protocol, to assess provoked atrial arrhythmogenesis. WT hearts persistently showed SR following the application of the protocol. In contrast, Scn3b−/− hearts demonstrated AT and fibrillation in response to the protocol. Finally, SNRT was measured to assess the function of the sinus node, which maintains the normal SR. The Scn3b−/− hearts demonstrated a significantly longer SNRT compared to that shown in WT hearts.
In summary, we provide empirical evidence that normal expression of Na+ channel β3 subunits is important in atrial function and conduction between the atria and ventricles. Thus, both ex vivo and in vivo Scn3b−/− preparations agreed in showing evidence of heart block and conduction abnormalities. This phenotype was significantly more marked in the ex vivo hearts. These findings at the whole heart level might now be followed by further investigations at the cellular level possibly for direct interactions of β3 with either tetrodotoxin (TTX)-resistant Nav1.5 or TTX-sensitive α-subunit isoforms.
Acknowledgments
This study was supported by grants from the British Heart Foundation, the Medical Research Council, the Wellcome Trust, the Helen Kirkland Fund for Cardiac Research and the Papworth Hospital Trust.
Conflicts of interest
We report no conflicts of interest.
References
- Abriel H, Cabo C, Wehrens XH, Rivolta I, Motoike HK, Memmi M, Napolitano C, Priori SG, Kass RS. Novel arrhythmogenic mechanism revealed by a long-QT syndrome mutation in the cardiac Na+ channel. Circ Res. 2001;88:740–745. doi: 10.1161/hh0701.089668. [DOI] [PubMed] [Google Scholar]
- Bennett PB, Yazawa K, Makita N, George AL., Jr Molecular mechanism for an inherited cardiac arrhythmia. Nature. 1995;376:683–685. doi: 10.1038/376683a0. [DOI] [PubMed] [Google Scholar]
- Berul CI, Aronovitz MJ, Wang PJ, Mendelsohn ME. In vivo cardiac electrophysiology studies in the mouse. Circulation. 1996;94:2641–2648. doi: 10.1161/01.cir.94.10.2641. [DOI] [PubMed] [Google Scholar]
- Brugada P, Brugada J. Right bundle branch block, persistent ST segment elevation and sudden cardiac death: a distinct clinical and electrocardiographic syndrome. A multicenter report. J Am Coll Cardiol. 1992;20:1391–1396. doi: 10.1016/0735-1097(92)90253-j. [DOI] [PubMed] [Google Scholar]
- Candenas L, Seda M, Noheda P, Buschmann H, Cintado CG, Martin JD, Pinto FM. Molecular diversity of voltage-gated sodium channel alpha and beta subunit mRNAs in human tissues. Eur J Pharmacol. 2006;541:9–16. doi: 10.1016/j.ejphar.2006.04.025. [DOI] [PubMed] [Google Scholar]
- Chaves AA, Dech SJ, Nakayama T, Hamlin RL, Bauer JA, Carnes CA. Age and anesthetic effects on murine electrocardiography. Life Sci. 2003;72:2401–2412. doi: 10.1016/s0024-3205(03)00137-1. [DOI] [PubMed] [Google Scholar]
- Chen C, Bharucha V, Chen Y, Westenbroek RE, Brown A, Malhotra JD, Jones D, Avery C, Gillespie PJ, 3rd, Kazen-Gillespie KA, et al. Reduced sodium channel density, altered voltage dependence of inactivation, and increased susceptibility to seizures in mice lacking sodium channel beta-2 subunits. Proc Natl Acad Sci USA. 2002;99:17072–17077. doi: 10.1073/pnas.212638099. [DOI] [PMC free article] [PubMed] [Google Scholar]
- Chen LY, Ballew JD, Herron KJ, Rodeheffer RJ, Olson TM. A common polymorphism in SCN5A is associated with lone atrial fibrillation. Clin Pharmacol Ther. 2007;81:35–41. doi: 10.1038/sj.clpt.6100016. [DOI] [PMC free article] [PubMed] [Google Scholar]
- Doevendans PA, Daemen MJ, De Muinck ED, Smits JF. Cardiovascular phenotyping in mice. Cardiovasc Res. 1998;39:34–49. doi: 10.1016/s0008-6363(98)00073-x. [DOI] [PubMed] [Google Scholar]
- Van Gassen KL, De Wit M, Van Kempen M, Saskia van der Hel W, Van Rijen PC, Jackson AP, Lindhout D, De Graan PN. Hippocampal Na(v) beta3 expression in patients with temporal lobe epilepsy. Epilepsia. 2009;50:957–962. doi: 10.1111/j.1528-1167.2008.02015.x. [DOI] [PubMed] [Google Scholar]
- Hakim P, Gurung IS, Pedersen TH, Thresher R, Brice N, Lawrence J, Grace AA, Huang CL-H. Scn3b knockout mice exhibit abnormal ventricular electrophysiological properties. Prog Biophys Mol Biol. 2008;98:251–266. doi: 10.1016/j.pbiomolbio.2009.01.005. [DOI] [PMC free article] [PubMed] [Google Scholar]
- Hu D, Barajas-Martinez H, Burashnikov E, Springer M, Wu Y, Varro A, Pfeiffer R, Koopmann TT, Cordeiro JM, Guerchicoff A, Pollevick GD, Antzelevitch C. A mutation in the beta-3 subunit of the cardiac sodium channel associated with Brugada ECG phenotype. Circ Cardiovasc Genet. 2009;2:270–278. doi: 10.1161/CIRCGENETICS.108.829192. [DOI] [PMC free article] [PubMed] [Google Scholar]
- Isom LL, Catterall WA. Na+ channel subunits and Ig domains. Nature. 1996;383:307–308. doi: 10.1038/383307b0. [DOI] [PubMed] [Google Scholar]
- Isom LL, De Jongh KS, Patton DE, Reber BF, Offord J, Charbonneau H, Walsh K, Goldin AL, Catterall WA. Primary structure and functional expression of the beta 1 subunit of the rat brain sodium channel. Science. 1992;256:839–842. doi: 10.1126/science.1375395. [DOI] [PubMed] [Google Scholar]
- Isom LL, Ragsdale DS, De Jongh KS, Westenbroek RE, Reber BF, Scheuer T, Catterall WA. Structure and function of the beta 2 subunit of brain sodium channels, a transmembrane glycoprotein with a CAM motif. Cell. 1995a;83:433–442. doi: 10.1016/0092-8674(95)90121-3. [DOI] [PubMed] [Google Scholar]
- Isom LL, Scheuer T, Brownstein AB, Ragsdale DS, Murphy BJ, Catterall WA. Functional co-expression of the beta 1 and type IIA alpha subunits of sodium channels in a mammalian cell line. J Biol Chem. 1995b;270:3306–3312. doi: 10.1074/jbc.270.7.3306. [DOI] [PubMed] [Google Scholar]
- Ko SH, Lenkowski PW, Lee HC, Mounsey JP, Patel MK. Modulation of Na(v)1.5 by beta1- and beta3-subunit co-expression in mammalian cells. Pflugers Arch. 2005;449:403–412. doi: 10.1007/s00424-004-1348-4. [DOI] [PubMed] [Google Scholar]
- Kovoor P, Wickman K, Maguire CT, Pu W, Gehrmann J, Berul CI, Clapham DE. Evaluation of the role of I(KACh) in atrial fibrillation using a mouse knockout model. J Am Coll Cardiol. 2001;37:2136–2143. doi: 10.1016/s0735-1097(01)01304-3. [DOI] [PubMed] [Google Scholar]
- Lopez-Santiago LF, Meadows LS, Ernst SJ, Chen C, Malhotra JD, McEwen DP, Speelman A, Noebels JL, Maier SK, Lopatin AN, Isom LL. Sodium channel Scn1b null mice exhibit prolonged QT and RR intervals. J Mol Cell Cardiol. 2007;43:636–647. doi: 10.1016/j.yjmcc.2007.07.062. [DOI] [PMC free article] [PubMed] [Google Scholar]
- Maier SK, Westenbroek RE, Yamanushi TT, Dobrzynski H, Boyett MR, Catterall WA, Scheuer T. An unexpected requirement for brain-type sodium channels for control of heart rate in the mouse sinoatrial node. Proc Natl Acad Sci USA. 2003;100:3507–3512. doi: 10.1073/pnas.2627986100. [DOI] [PMC free article] [PubMed] [Google Scholar]
- Maier SK, Westenbroek RE, McCormick KA, Curtis R, Scheuer T, Catterall WA. Distinct subcellular localization of different sodium channel alpha and beta subunits in single ventricular myocytes from mouse heart. Circulation. 2004;109:1421–1427. doi: 10.1161/01.CIR.0000121421.61896.24. [DOI] [PubMed] [Google Scholar]
- Makita N, Sloan-Brown K, Weghuis DO, Ropers HH, George AL., Jr Genomic organization and chromosomal assignment of the human voltage-gated Na+ channel beta 1 subunit gene (SCN1B. Genomics. 1994;23:628–634. doi: 10.1006/geno.1994.1551. [DOI] [PubMed] [Google Scholar]
- Makita N, Shirai N, Wang DW, Sasaki K, George AL, Jr, Kanno M, Kitabatake A. Cardiac Na(+) channel dysfunction in Brugada syndrome is aggravated by beta(1)-subunit. Circulation. 2000;101:54–60. doi: 10.1161/01.cir.101.1.54. [DOI] [PubMed] [Google Scholar]
- Marionneau C, Couette B, Liu J, Li H, Mangoni ME, Nargeot J, Lei M, Escande D, Demolombe S. Specific pattern of ionic channel gene expression associated with pacemaker activity in the mouse heart. J Physiol. 2005;562:223–234. doi: 10.1113/jphysiol.2004.074047. [DOI] [PMC free article] [PubMed] [Google Scholar]
- Medeiros-Domingo A, Kaku T, Tester DJ, Iturralde-Torres P, Itty A, Ye B, Valdivia C, Ueda K, Canizales-Quinteros S, Tusie-Luna MT, Makielski JC, Ackerman MJ. SCN4B-encoded sodium channel beta4 subunit in congenital long-QT syndrome. Circulation. 2007;116:134–142. doi: 10.1161/CIRCULATIONAHA.106.659086. [DOI] [PMC free article] [PubMed] [Google Scholar]
- Mitchell GF, Jeron A, Koren G. Measurement of heart rate and Q-T interval in the conscious mouse. Am J Physiol. 1998;274:H747–H751. doi: 10.1152/ajpheart.1998.274.3.H747. [DOI] [PubMed] [Google Scholar]
- Morgan K, Stevens EB, Shah B, Cox PJ, Dixon AK, Lee K, Pinnock RD, Hughes J, Richardson PJ, Mizuguchi K, Jackson AP. beta 3: an additional auxiliary subunit of the voltage-sensitive sodium channel that modulates channel gating with distinct kinetics. Proc Natl Acad Sci USA. 2000;97:2308–2313. doi: 10.1073/pnas.030362197. [DOI] [PMC free article] [PubMed] [Google Scholar]
- Morita H, Kusano-Fukushima K, Nagase S, Fujimoto Y, Hisamatsu K, Fujio H, Haraoka K, Kobayashi M, Morita ST, Nakamura K, et al. Atrial fibrillation and atrial vulnerability in patients with Brugada syndrome. J Am Coll Cardiol. 2002;40:1437–1444. doi: 10.1016/s0735-1097(02)02167-8. [DOI] [PubMed] [Google Scholar]
- Olson TM, Michels VV, Ballew JD, Reyna SP, Karst ML, Herron KJ, Horton SC, Rodeheffer RJ, Anderson JL. Sodium channel mutations and susceptibility to heart failure and atrial fibrillation. JAMA. 2005;293:447–454. doi: 10.1001/jama.293.4.447. [DOI] [PMC free article] [PubMed] [Google Scholar]
- Roberts R, Brugada R. Genetic aspects of arrhythmias. Am J Med Genet. 2000;97:310–318. doi: 10.1002/1096-8628(200024)97:4<310::aid-ajmg1282>3.0.co;2-7. [DOI] [PubMed] [Google Scholar]
- Stevens EB, Cox PJ, Shah BS, Dixon AK, Richardson PJ, Pinnock RD, Lee K. Tissue distribution and functional expression of the human voltage-gated sodium channel beta3 subunit. Pflugers Arch. 2001;441:481–488. doi: 10.1007/s004240000449. [DOI] [PubMed] [Google Scholar]
- Wang Q, Shen J, Splawski I, Atkinson D, Li Z, Robinson JL, Moss AJ, Towbin JA, Keating MT. SCN5A mutations associated with an inherited cardiac arrhythmia, long QT syndrome. Cell. 1995;80:805–811. doi: 10.1016/0092-8674(95)90359-3. [DOI] [PubMed] [Google Scholar]
- Watanabe H, Koopmann TT, Le Scouarnec S, Yang T, Ingram CR, Schott JJ, Demolombe S, Probst V, Anselme F, Escande D, et al. Sodium channel beta1 subunit mutations associated with Brugada syndrome and cardiac conduction disease in humans. J Clin Invest. 2008;118:2260–2268. doi: 10.1172/JCI33891. [DOI] [PMC free article] [PubMed] [Google Scholar]
- Watanabe H, Darbar D, Kaiser DW, Jiramongkolchai K, Chopra S, Donahue BS, Kannankeril PJ, Roden DM. Mutations in sodium channel beta1 and beta2 subunits associated with atrial fibrillation. Circ Arrhythmia Electrophysiol. 2009;108:779181. doi: 10.1161/CIRCEP.108.779181. [DOI] [PMC free article] [PubMed] [Google Scholar]
- Xu Q, Ming Z, Dart AM, Du XJ. Optimizing dosage of ketamine and xylazine in murine echocardiography. Clin Exp Pharmacol Physiol. 2007;34:499–507. doi: 10.1111/j.1440-1681.2007.04601.x. [DOI] [PubMed] [Google Scholar]
- Yu FH, Westenbroek RE, Silos-Santiago I, McCormick KA, Lawson D, Ge P, Ferriera H, Lilly J, DiStefano PS, Catterall WA, Scheuer T, Curtis R. Sodium channel beta4, a new disulfide-linked auxiliary subunit with similarity to beta2. J Neurosci. 2003;23:7577–7585. doi: 10.1523/JNEUROSCI.23-20-07577.2003. [DOI] [PMC free article] [PubMed] [Google Scholar]