Abstract
Karyopherin alpha 2 (KPNA2), a member of the karyopherin family, has a central role in nucleocytoplasmic transport and is overexpressed in many cancers. Our previous study identified KPNA2 as significantly upregulated in epithelial ovarian carcinoma (EOC), correlating with poor survival of patients. However, the precise mechanism of this effect remains unclear. The aim of the present study was to examine the role of KPNA2 in the proliferation and tumorigenicity of EOC cells, and its clinical significance in tumor progression. Real-time quantitative RT-PCR analysis revealed high expression levels of KPNA2 in 162 out of 191 (84.8%) fresh EOC tissues, which was significantly correlated with International Federation of Gynecology and Obstetrics (FIGO) stage, differentiation, histological type, recurrence, and prognosis of EOC patients. Our results showed that upregulation of KPNA2 expression significantly increased the proliferation and tumorigenicity of EOC cells (EFO-21 and SK-OV3) in vitro and in vivo, by promoting cell growth rate, foci formation, soft agar colony formation, and tumor formation in nude mice. By contrast, knockdown of KPNA2 effectively suppressed the proliferation and tumorigenicity of these EOC cells in vitro and in vivo. Our results also indicated that the molecular mechanisms of the effect of KPNA2 in EOC included promotion of G1/S cell cycle transition through upregulation of c-Myc, enhanced transcriptional activity of c-Myc, activation of Akt activity, suppression of FOXO3a activity, downregulation of cyclin-dependent kinase (CDK) inhibitor p21Cip1 and p27Kip1, and upregulation of CDK regulator cyclin D1. Our results show that KPNA2 has an important role in promoting proliferation and tumorigenicity of EOC, and may represent a novel prognostic biomarker and therapeutic target for this disease.
Keywords: KPNA2, epithelial ovarian carcinoma, proliferation, tumorigenicity, c-Myc, FOXO3a
Epithelial ovarian carcinoma (EOC) accounts for 90% of all ovarian malignancies and is the most fatal gynecological malignancy in women worldwide. The high mortality rate of EOC is related to the delay in diagnosis, partly caused by the late clinical manifestation of ovarian tumors. Therefore, early detection is critical for improving the long-term survival of patients with ovarian cancer.
Nucleocytoplasmic transport occurs through large nuclear pore complexes in the nuclear membrane. Whereas some factors are able to diffuse passively through the pores, the transport of macromolecules larger than ∼40 kDa must be mediated by shuttle proteins, such as karyopherins.1 A family of karyopherin α heterodimers mediated the classical nuclear import pathway, which recognize cargo proteins via their nuclear localization signals (NLSs). Karyopherin alpha 2 (KPNA2) is one of seven known karyopherin α proteins2 that have central roles in nucleocytoplasmic transport. The KPNA2 protein (also known as importin α-1 or RAG cohort 1) is ∼58 kDa and comprises 529 amino acids. Its domain structure was defined between 1995 and 1996.3, 4, 5, 6 The protein comprises an N-terminal hydrophilic importin β-binding domain; a central hydrophobic region consisting of 10 armadillo repeats, which binds to the NLS site of the cargo protein; and a short acidic C terminus, which has no reported function.
Elevated levels of KPNA2 have been reported in a variety of malignancies, including melanoma,7 cervical cancer,8 esophageal cancer,9 lung cancer,10 ovarian cancer,11 prostate cancer,12 brain cancer,13 liver cancer,14 and bladder cancer.15 In addition, KPNA2 has been reported to be an important factor in the tumorigenesis and progression of breast cancer8, 16, 17, 18 by influencing the transport of tumor-suppressor BRCA1 proteins from the cytoplasm into the nucleus. Interesting, high levels of KPNA2 were observed in patient serum in lung cancer.10 This raises the possibility that adverse KPNA2 levels could also be detected in blood samples from other cancers; however, the molecular mechanisms underlying KPNA2 activity in cancer remain to be established.
In our previous study, cDNA microarrays were used to screen for tumor-specific genes in EOC, and KPNA2 was observed to be upregulated in EOC tissues compared with paired normal human ovarian surface epithelial (HOSE) tissues. Immunohistochemistry revealed that overexpression of KPNA2 in EOC was correlated with poor prognosis;11 however, the precise mechanism underlying the correlation is unknown.
In the present study, we found that expression of KPNA2 was significantly upregulated in human EOC cell lines and tissues, leading to significant increases in the proliferation and tumorigenicity of EOC cells in vitro and in vivo. By contrast, knockdown of KPNA2 suppressed the proliferation and tumorigenicity of EOC cells in vitro and in vivo. Furthermore, we showed that KPNA2 promoted G1/S cell cycle transition, through upregulation of c-Myc; enhanced transcriptional activity of c-Myc and Akt activity, and suppression of FOXO3a; downregulated cyclin-dependent kinase (CDK) inhibitors p21Cip1 and p27Kip1; and upregulated CDK regulator cyclin D1. Taken together, our findings indicated that KPNA2 has an important role in the proliferation and tumorigenicity of human EOC and suggests that KPNA2 may be a potential target for human EOC treatment.
Results
KPNA2 is upregulated in EOC tissues and cell lines
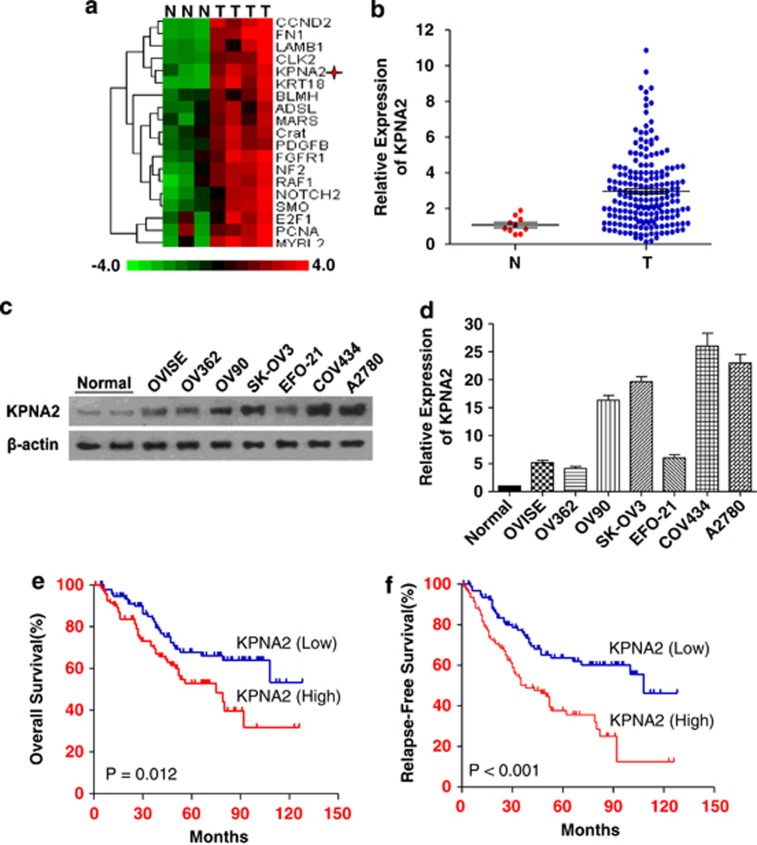
Of the 26 863 genes detected by the Affymetrix GeneChip (Human Genome U133 Plus 2.0 Array) microarray, 19 genes were found to be upregulated in EOC cells (fold change ≥8), including KPNA2 (fold change =10), compared with HOSE tissues. The hierarchical cluster analysis of these genes is shown in Figure1a. Results from real-time quantitative RT-PCR (qRT-PCR) assays of KPNA2 expression in EOC and HOSE samples were consistent with the gene expression patterns for KPNA2 detected by the microarray experiments (Figure 1b). Western blotting analysis revealed that expression of the KPNA2 protein was markedly higher in all seven EOC cell lines compared with HOSE samples (Figures 1c and d).
Figure 1.
KPNA2 is overexpressed in EOC cells and tissue samples; and KPNA2 upregulation is associated with poor prognosis. (a) Gene expression microarray analysis showing that KPNA2 was upregulated (10-fold) compared with HOSE samples. (b) Real-time qRT-PCR analysis showing the average expression levels of KPNA2 in EOC (n=191) and HOSE (n=10) tissue samples. Expression levels are normalized to β-actin mRNA. Error bars represent S.E. (c) Western blot analysis of KPNA2 protein expression in two HOSE samples and seven EOC cell lines; β-actin was used as a loading control. (d) KPNA2 protein expression in two HOSE samples and seven EOC cell lines was quantitated using ImageJ software (Wayne Rashband). (e) Kaplan–Meier analysis showing that the expression of KPNA2 was significantly associated with poor overall survival in 191 EOC cases (P=0.012, log-rank test). (f) Kaplan–Meier analysis showing that expression of KPNA2 was significantly associated with poor relapse-free survival in 191 EOC cases (P<0.001, log-rank test)
High levels of KPNA2 expression predict poor prognosis for EOC patients
qRT-PCR assays detected high expression levels of KPNA2 in 191 EOC specimens versus 10 HOSE specimens: 3.52±0.23 (mean±S.E.) at 2−ΔΔCt of KPNA2 (Figure 1b).
We ranked patients according to their expression levels and divided them into a high expression group (n=95) or low expression group (n=96) using the median expression level of KPNA2 as the cutoff point. Correlations between KPNA2 expression levels and clinicopathological characteristics of the EOC patients are summarized in Table 1. High levels of KPNA2 expression were detected in 66.3% (63/95) of stage III/IV patients and in 33.7% (32/95) of stage I/II patients. High levels of KPNA2 expression were significantly associated with advanced clinical stage EOC, histological type, differentiation, recurrence, and suboptimal cytoreductive surgery. The 5-year overall survival rates and 5-year relapse-free survival rates of patients expressing low levels of KPNA2 were significantly higher than those of patients expressing high levels of KPNA2 (68.2% versus 52.3%, P=0.012; 62.5% versus 38.9%, P<0.001) (Figures 1e and f). Furthermore, multivariate analysis indicated that a high level of KPNA2 expression was an independent predictor of EOC in patients, and was associated with a 1.832-fold increased risk of a poor prognosis (Table 2).
Table 1. Correlations between KPNA2 expression and clinicopathological features of patients with epithelial ovarian cancer.
|
KPNA2 expression |
|||
|---|---|---|---|
| Patient and tumor characteristics | High (%) | Low (%) | P-value |
| Age, years | |||
| ≤45 | 30 (31.6) | 33 (34.4) | |
| >45 | 65 (68.4) | 63 (65.6) | 0.681 |
| Histological type | |||
| Serous | 71 (74.7) | 48 (50.0) | |
| Mucinous | 21 (22.1) | 41 (42.7) | |
| Others | 3 (3.2) | 7 (7.3) | 0.002 |
| FIGO stage | |||
| I/II | 32 (33.7) | 60 (62.5) | |
| III/IV | 63 (66.3) | 36 (37.5) | <0.001 |
| Differentiation | |||
| Well | 23 (24.2) | 49 (51.0) | |
| Moderate | 26 (27.4) | 29 (30.2) | |
| Poor | 46 (48.4) | 18 (18.8) | <0.001 |
| Distant metastasis | |||
| Yes | 7 (7.4) | 4 (4.2) | |
| No | 88 (92.6) | 91 (95.8) | 0.351 |
| Recurrence | |||
| Yes | 46 (48.4) | 26 (27.1) | |
| No | 49 (51.6) | 70 (72.9) | 0.002 |
| Cytoreductive surgery | |||
| Optimal cytoreduction | 66 (69.5) | 87 (90.6) | |
| Suboptimal cytoreduction | 19 (30.5) | 9 (9.4) | 0.016 |
Bold P-values indicate significance (P<0.05)
Table 2. Univariate and multivariate analysis of factors associated with overall survival.
| Clinical variable | Subset | Hazard ratio (95% CI) | P-value |
|---|---|---|---|
| Univariate analysis | |||
| Histology | Others versus mucinous versus serious | 0.672 (0.426–1.058) | 0.086 |
| FIGO stage | III/IV versus I/II | 3.905 (2.439–6.252) | <0.001 |
| Differentiation | Poor versus moderate versus well | 1.701 (1.326–2.181) | <0.001 |
| Cytoreductive surgery | Suboptimal cytoreduction versus optimal cytoreduction | 3.302 (2.032–5.364) | <0.001 |
| Expression of KPNA2 | High versus low | 2.404 (1.563–3.697) | <0.001 |
| Multivariate analysis | |||
| FIGO stage | III/IV versus I/II | 3.570 (1.984–6.424) | <0.001 |
| Cytoreductive surgery | Suboptimal cytoreduction versus optimal cytoreduction | 1.819 (1.096–3.018) | 0.021 |
| Expression of KPNA2 | High versus low | 1.832 (1.137–2.951) | 0.013 |
Abbreviations: CI, confidence interval; FIGO, International Federation of Gynecology and Obstetrics.
Bold P-values indicate significance (P<0.05)
KPNA2 is essential for EOC cell proliferation
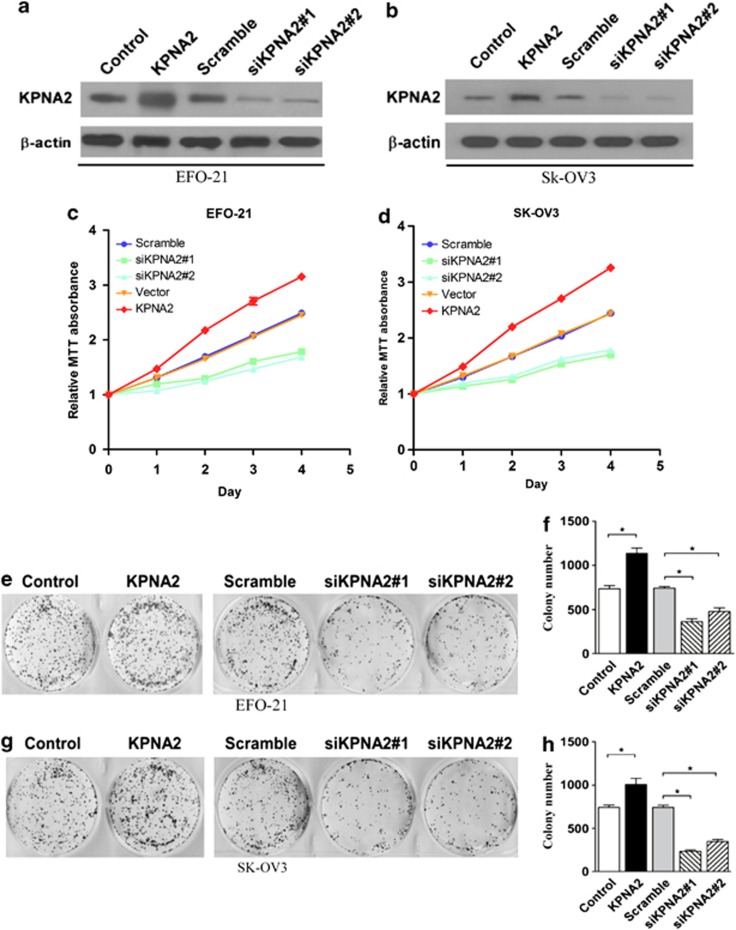
On the basis of these findings, we hypothesized that KPNA2 may have a role in EOC pathogenesis and could, therefore, be a novel therapeutic target. To identify the role of KPNA2 in the progression of EOC, two cell lines were constructed (using EFO-21 and SK-OV3 cell lines) to stably express the KPNA2 cDNA (EFO-21/KPNA2 and SK-OV3/KPNA2) and KPNA2 small-hairpin RNAs (shRNAs) (EFO-21/siKPNA2#1, EFO-21/siKPNA2#2, SK-OV3/siKPNA2#1, and SK-OV3/siKPNA2#2) (Figures 2a and b). The 3-(4,5-dimethylthiazol-2-yl)-2,5-diphenyltetrazolium bromide (MTT) assay supported our hypothesis by showing that downregulation of KPNA2 expression significantly reduced the viability of both EFO-21 and SK-OV3 EOC cell lines (Figures 2c and d). This was further confirmed by colony formation assays (Figures 2e–h), which showed that KPNA2 is overexpressed in highly proliferative EOC cells.
Figure 2.
KPNA2 is essential for EOC cell proliferation. Western blotting analysis of KPNA2 overexpression and KPNA2 knockdown in (a) EFO-21 and (b) SK-OV3 cell lines with two specific shRNAs; β-actin was used as a loading control. MTT assays of KPNA2 overexpression and KPNA2 knockdown in (c) EFO-21 and (d) SK-OV3 cell lines. Each bar represents the mean (± S.D.) of three independent experiments. (e–h) Representative micrographs (left panel) and quantifications (right panel) of the following crystal violet-stained cell lines: EFO-21-vector, EFO-21-KPNA2, EFO-21-si-scramble, EFO-21-siKPNA2 #1, EFO-21-siKPNA28 #2; and SK-OV3-vector, SK-OV3-KPNA2, SK-OV3-si-vector, SK-OV3-siKPNA2 #1, SK-OV3-siKPNA2 #2, *P<0.05
KPNA2 is essential for EOC cell tumorigenicity
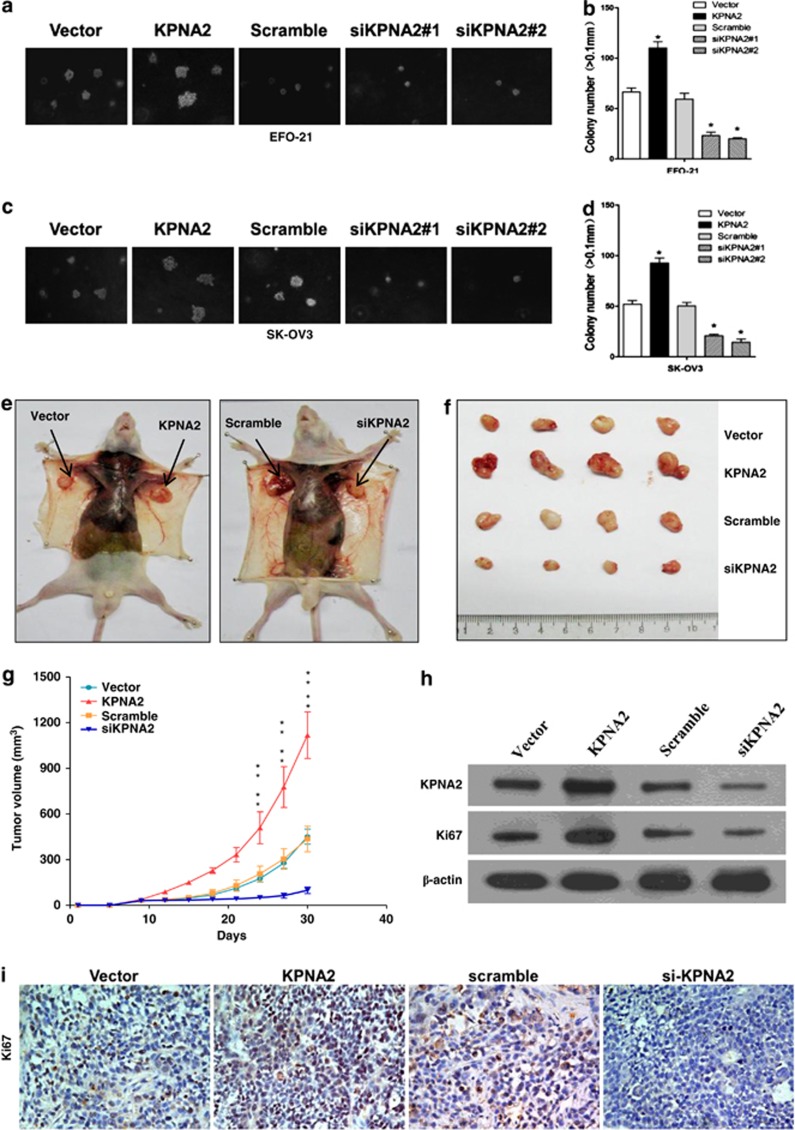
Based on the correlation between KPNA2 expression and the clinical staging of EOC (Table 1), we carried out further investigations to evaluate the effect of KPNA2 on the tumorigenic activity of EOC cells in vitro and in vivo. Downregulation of KPNA2 in EFO-21 and SK-OV3 cell lines dramatically reduced both the number and size of colonies on soft agar in an anchorage-independent growth assay (Figures 3a–d). By contrast, expression of KPNA2 in EFO-21 and SK-OV3 cells increased proliferation and anchorage-independent growth (Figures 3a–d). To determine whether upregulation or downregulation of KPNA2 influenced the tumorigenicity of EOC cells in vivo, nude mice were inoculated subcutaneously with EFO-21/KPNA2 (KPNA2) cells or EFO-21/siKPNA2#1 (siKPNA2) cells (Figure 3e). The tumors that formed from EFO-21/siKPNA2#1 cells grew more slowly than those from EFO-21/KPNA2 cells (Figure 3f). This was consistent with our cell proliferation results in vitro. Furthermore, the average volume of the tumors induced by EFO-21/KPNA2 cells (279.3±38.0 mm3, n=4) were significantly larger than those induced by vector control cells (112.8±12.4 mm3, n=4, P<0.01), whereas depletion of endogenous KPNA2 in EFO-21 cells significantly inhibited tumor growth (average volume: 24.5±5.3 mm3 versus 108.8±20.8 mm3, n=4, P<0.01) (Figure 3g). KPNA2 expression in xenograft tumors was analyzed by western blotting; the results showed that KPNA2 expression was upregulated in tumors induced by EFO-21/KPNA2 cells, but downregulated in tumors induced by EFO-21/siKPNA2#1cells (Figure 3h). This was consistent with our immunohistochemical (IHC) analysis, which found that tumor sections with high levels of KPNA2 also stained strongly for Ki67, whereas those corresponding to low KPNA2 expression levels only showed marginal levels of Ki67 expression (Figure 3i). Collectively, our results showed that KPNA2 is overexpressed in highly proliferative EOC cells, indicating that KPNA2 has an important role in enhancing the tumorigenicity of EOC cells both in vitro and in vivo.
Figure 3.
KPNA2 is essential for EOC cell tumorigenicity in vitro and in vivo. Representative micrographs (left panel) and quantifications (right panel) of soft agar colony formation assays for the following cell lines, relative to the control: (a and b) EFO-21-vector, EFO-21-KPNA2, EFO-21-si-scramble, EFO-21-siKPNA2 #1, EFO-21-siKPNA2 #2; and (c and d) SK-OV3-vector, SK-OV3-KPNA2, SK-OV3-si-vector, SK-OV3-siKPNA2 #1, SK-OV3-siKPNA2 #2. Each bar represents the mean (± S.D.) of three independent experiments. Xenograft model in nude mice. (e) EFO-21-vector, EFO-21/KPNA2 (KPNA2), EFO-21-si-scramble, and EFO-21/siKPNA2 #1 (siKPNA2) cells were injected subcutaneously into the left and right flanks of the mice. (f) Representative pictures of tumor growth 30 days after inoculation. (g) Tumor volumes were measured on the indicated days. All data are shown as mean±S.D. (h) Western blotting analysis of KPNA2 expression in EFO-21-vector, EFO-21/KPNA2 (KPNA2), EFO-21-si-scramble, and EFO-21/siKPNA2 #1 (siKPNA2) generated tumors 30 days after injection. (i) Immunohistochemical analysis of EFO-21-vector, EFO-21/KPNA2 (KPNA2), EFO-21-si-scramble, and EFO-21/siKPNA2 #1 (siKPNA2) generated tumors 30 days after injection. Sections obtained from tumors were incubated with anti-ki67 antibody. Representative fields are shown ( × 200 magnification) *P<0.05; **P<0.01
Depletion of KPNA2 induces G1/S cell cycle arrest in EOC cells
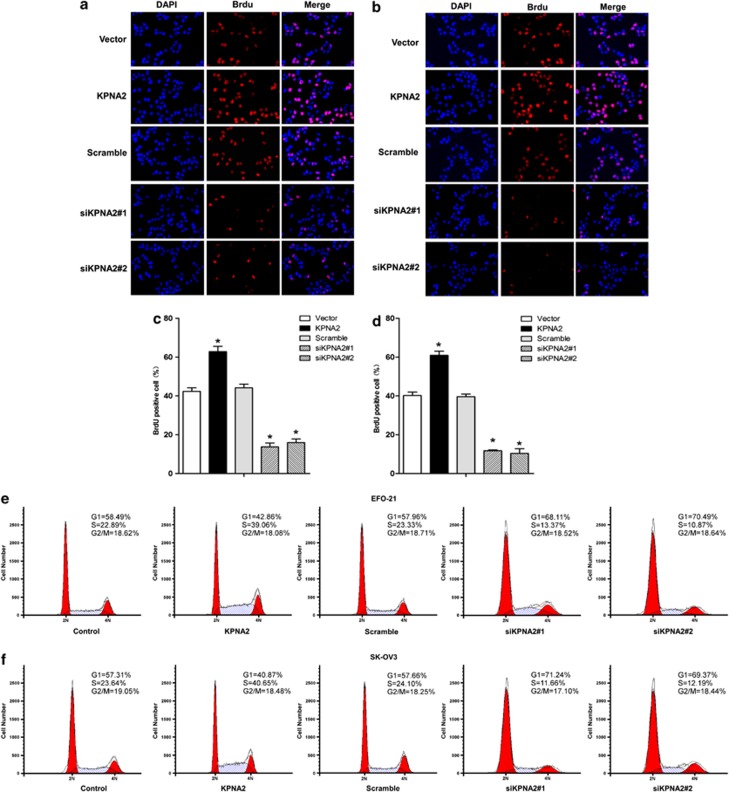
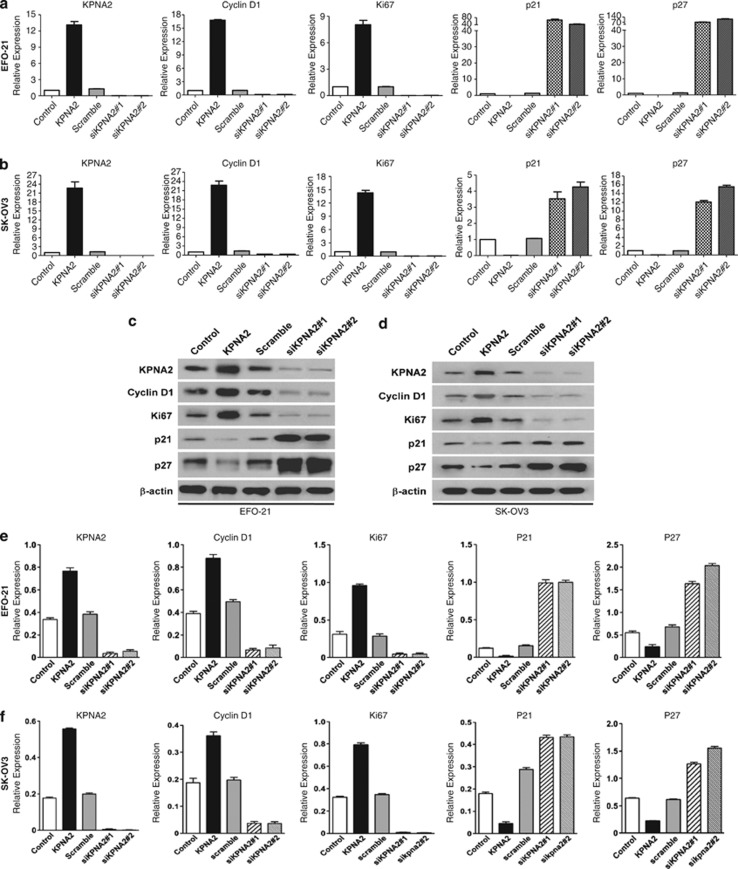
The mechanism underlying the promotion of cellular proliferation by KPNA2 was investigated by a 5-bromo-2′-deoxyuridine (BrdU) incorporation assay. As shown in Figures 4a–d, downregulation of KPNA2 in EFO-21 and SK-OV3 cell lines significantly decreased the percentage of BrdU-positive cells, significantly increased the percentage of cells at G0/G1 phase and decreased the percentage of cells at S phase of the cell cycle (Figures 4e and f). These results suggested that silencing of KPNA2 induced G1/S-phase arrest in EOC cells. Further investigations by real-time qRT-PCR and western blotting analyses revealed that the expressions of CDK inhibitors, p21Cip1 and p27Kip1, were dramatically upregulated, whereas expression of the CDK regulator cyclin D1 was downregulated in KPNA2-knockdown cells at both the mRNA (Figures 5a and b) and protein levels compared with control cells (Figures 5c–f). This finding further supported our supposition that KPNA2 is involved in the regulation of EOC cell proliferation.
Figure 4.
Depletion of KPNA2 induces G1/S arrest of EOC cells (BrdU incorporation assay). (a and b) Representative micrographs (top panel), and (c and d) quantification (middle panel) of BrdU-incorporating cells in KPNA2-overexpressing and two KPNA2 shRNA(s)-infected cell lines, relative to the control. The cells were fixed, subjected to BrdU staining, and visualized under a fluorescence microscope. Data were obtained from three independent experiments and showed similar results. Red, BrdU; blue, DAPI. (e and f) Flow cytometry analysis of the indicated EOC cells transfected with the KPNA2 overexpression construct or KPNA2 shRNA(s). The proportion of S-phase cells as significantly reduced in KPNA2 shRNA(s)-transfected cell lines (P<0.05) compared with the control group; in contrast, the proportion of S-phase cells in the line transfected with the KPNA2 construct clearly increased (P<0.05) *P<0.05
Figure 5.
Depletion of KPNA2 induces G1/S arrest of EOC cells (by real-time qRT-PCR analysis). (a and b) Relative mRNA expression of KPNA2, cyclin D1, ki-67, p21Cip1, and p27Kip1 in the indicated EOC cells was determined by real-time qRT-PCR. Expression levels were normalized to β-actin. (c and d) Western blotting analysis of KPNA2, cyclin D1, ki-67, p21Cip1, and p27Kip1 proteins (top) in the indicated EOC cells. (e and f) Expression levels were quantitated using ImageJ software (Wayne Rashband; bottom); β-actin was used as a loading control. Error bars represent the S.D. of three independent experiments
Upregulation of KPNA2 enhances c-Myc transcriptional activity and suppresses FOXO3a activity
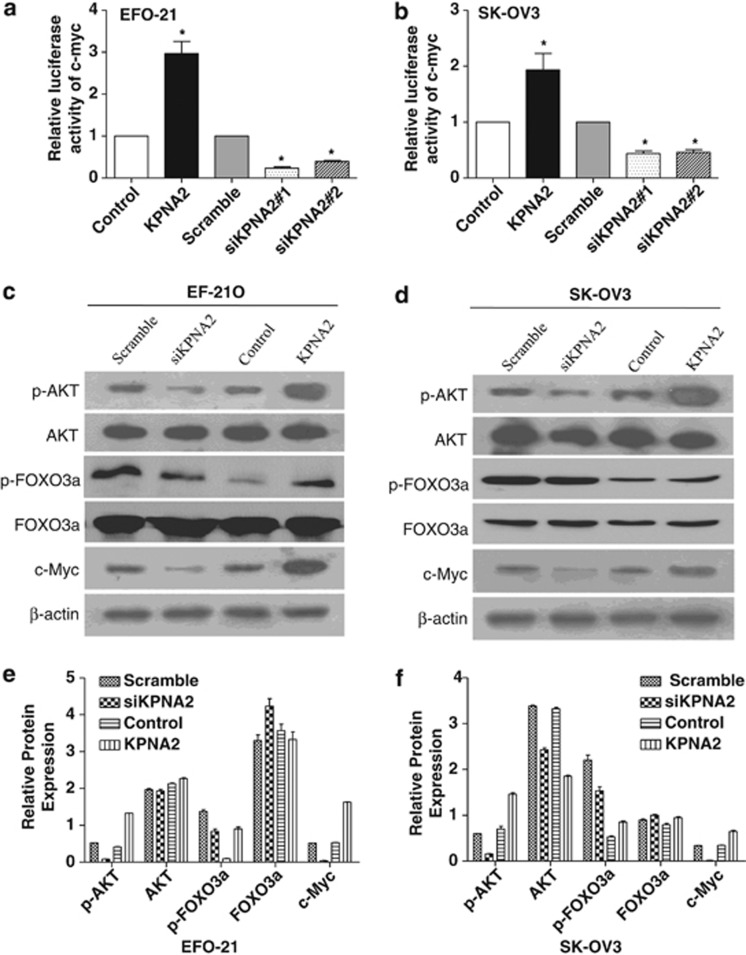
To further investigate the molecular mechanism mediating the cell cycle arrest effect of downregulating KPNA2, the levels of cell cycle-related proteins c-Myc, AKT, and FOXO3a were examined, because the above identified altered cell cycle genes (p21Cip1, p27Kip1, and cyclin D1) are known downstream targets of c-Myc and FOXO3a.19, 20 As shown in Figures 6a and b, a c-Myc reporter assay showed that KPNA2 upregulation significantly increased c-Myc transcriptional transactivating activity in both EFO-21 and SK-OV3 cell lines. By contrast, downregulation of KPNA2 attenuated c-Myc transcriptional transactivating activity. Furthermore, western blotting analysis showed that c-Myc, phosphorylated AKT, and phosphorylated FOXO3a significantly increased in KPNA2-overexpressing EOC cells and were reduced in KPNA2-knockdown EOC cells, compared with control cells (Figures 6c–f). These results suggest that the effect of KPNA2 on cell proliferation and tumorigenicity may be effected through upregulation of c-Myc transcriptional activity and activation of Akt.
Figure 6.
Downregulation of KPNA2 decreases transcriptional activity of c-Myc and the activity of Akt, and increases the activity of FOXO3a. (a and b) c-Myc reporter activity in EOC cells transduced with vector KPNA2; si-scramble; siKPNA2 #1; and siKPNA2 #2, relative to the control. (c and d) Western blotting analysis of phosphorylated Akt (p-Akt), total Akt, phosphorylated FOXO3a (p- FOXO3a), total FOXO3a, and c-Myc proteins in the indicated EOC cells. (e and f) Expression levels were quantitated using ImageJ software (Wayne Rashband; bottom); β-actin was used as a loading control. Error bars represent the S.D. from three independent experiments. *P<0.05 compared with the control
Knockdown of KPNA2 causes subcellular redistribution of c-Myc in EOC cells
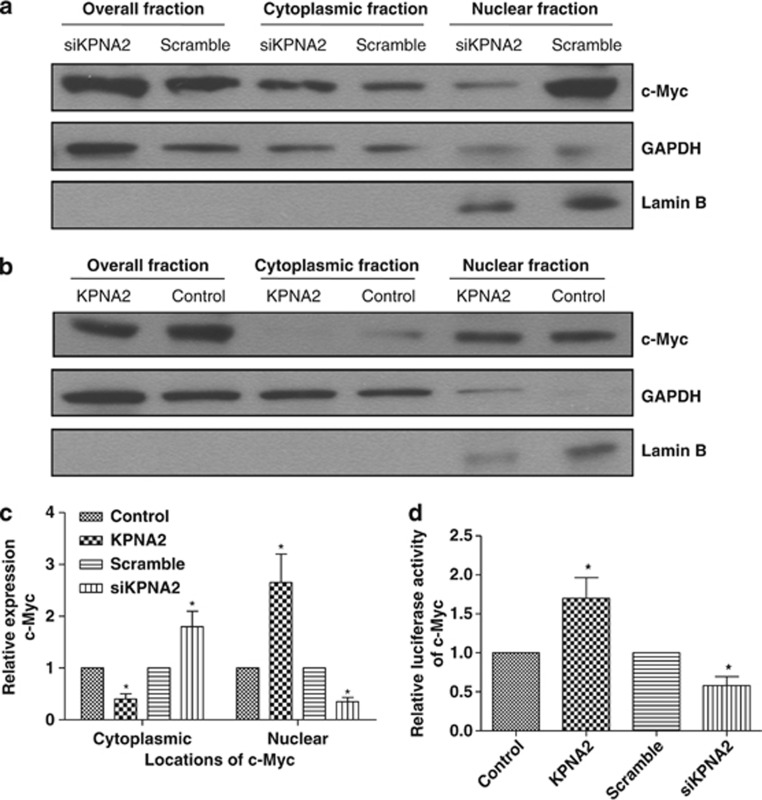
There are some recent reports21, 22 that KPNA2 can interact with c-Myc; therefore, we were interested in determining whether KPNA2 mediates nuclear translocation of c-Myc. To examine the effect of KPNA2 on the subcellular distribution of c-Myc in EOC cells, we further upregulated the expression of c-Myc in KPNA2-overexpressing and -knockdown EOC cells. We confirmed this regulation by subcellular fractionation, followed by western blotting analysis. We further examined the expression of c-Myc in KPNA2-overexpressing and -knockdown EOC cells by subcellular fractionation, followed by western blotting analysis. Fractionation efficacy was validated by the detection of GAPDH and lamin B in the cytosolic and nuclear fractions, respectively. The protein level of c-Myc was normalized to that of the two marker proteins. We found that c-Myc was increased in the cytoplasmic fraction in KPNA2-knockdown EOC cells and reduced in KPNA2-overexpressing EOC cells, compared with control cells (Figures 7a–c). To confirm the role of c-Myc in KPNA2-mediated cell proliferation and tumorigenicity, we further analyzed the transcriptional activity of c-Myc in KPNA2-knockdown and -overexpressing EOC cells via transfection with a c-Myc-luciferase reporter plasmid. As expected, the luciferase activity from the c-Myc reporter was dramatically reduced in KPNA2-silenced cells and increased in KPNA2-overexpressing EOC cells compared with control cells (Figure 7d), suggesting that c-Myc has an important role in the cell proliferative and tumorigenic effect of KPNA2.
Figure 7.
Knockdown of KPNA2 causes subcellular redistribution of E2F1 in EOC cells. KPNA2-knockdown (a) and -overexpressing (b) SK-OV3 cells transfected with pMSCV-c-Myc plasmid. At 48 h after transfection, cells were lysed and fractionated into nuclear and cytoplasmic fractions, followed by western blotting. GAPDH was used as the cytosolic control and lamin B as the nuclear control. (c) Quantification analysis of subcellular distribution acquired from western blotting using ImageJ software (Wayne Rashband). (d) c-Myc reporter activity in KPNA2-knockdown and -overexpressing SK-OV3 cells transfected with pMSCV-c-Myc plasmid, relative to the control. Error bars indicate the S.D. from three independent experiments. *P<0.05 compared with the control
Discussion
We report the characterization of KPNA2 as a candidate oncogene in EOC. The pivotal finding of our study was the detection of KPNA2 upregulation in 84.8% (162/191) of primary EOC tumors that were significantly associated with poor prognosis in EOC patients. This led us to propose that KPNA2 might have an important role in EOC development and progression. This was supported by our findings: knockdown of endogenous KPNA2 inhibited the proliferation and tumorigenicity of EOC cells in vitro and in vivo, and silencing of KPNA2 with RNAi resulted in inhibition of c-Myc transactivity and Akt kinase activity, and suppression of FOXO3a activity, leading to upregulation of CDK inhibitors p21Cip1 and p27Kip1 and downregulation of CDK regulator cyclin D1. These findings provided strong evidence that upregulation of KPNA2 has an important role in promoting cell proliferation and tumorigenicity, and imply that KPNA2 may function as an oncogenic protein in the development and progression of EOC.
Nucleocytoplasmic transport mechanisms have been the target of numerous studies because of their role in key cellular processes, such as gene expression, cell cycle progression, and signal transduction. Increasing evidence suggests that these mechanisms contribute to malignant cell transformation, thereby highlighting the potential of these proteins as therapeutic targets.23 KPNA2 is an adaptor protein that mediates the import of signaling factors into the nucleus and the export of response molecules to the cytoplasm.24 Although the potential oncogenic functions of KPNA2 have been implicated in a variety of malignancies, the precise mechanism remains unclear.7, 9, 10, 11, 12, 13, 14, 15 In the present study, we provided evidence that knockdown of KPNA2 downregulates c-Myc and decreases the transcriptional activity of c-Myc in both EFO-21 and SK-OV3 cell lines. A plausible mechanism by which KPNA2 could affect carcinogenesis is through the translocation of cancer-associated cargo proteins. It has previously been demonstrated that KPNA2 interacts with a variety of proteins that are associated with cancer, including checkpoint kinase 2;25 NBS1, thought to be involved in DNA repair and meiotic recombination;26 and the tumor-suppressor p53.27 KPNA2 has also been implicated in the translocation of transcription factors, including E2F1,26 c-Myc,22 PLAG1,28 and LOT1.29 Previous reports identified a potential molecular link between KPNA2 and c-Myc, involving TGF-β1 and IFN-γ. Expression of KPNA2 was specifically regulated by TGF-β1 and IFN-γ: TGF-β1 induced reversible growth arrest at the G1 phase of the cell cycle,30, 31, 32 while IFN-γ induced irreversible growth arrest in cultured keratinocytes and promoted aberrant terminal differentiation.33 In addition, KPNA2 is a target of c-Myc; the expression and nuclear localization of c-Myc is rapidly downregulated when keratinocytes are treated with TGF-β1.34, 35 In addition, the transcription factor c-Myc downregulates p21Cip1 and p27Kip1, and upregulates cyclin D1 at the transcriptional level.19, 20 The results of the present study are consistent with these reports. We found that c-Myc was reduced in the nuclear fraction in KPNA2-knockdown EOC cells and increased in KPNA2-overexpressing EOC cells, which led us to hypothesize that KPNA2 transports c-Myc into the nucleus where it accumulates, thereby inhibiting transcription of p21Cip1 and p27Kip1, and inducing G1/S-phase arrest. However, further studies are needed to establish what role KPNA2 has in the translocation and regulation of the critical transcriptional factor c-Myc.
FOXO3a is a critical tumor suppressor that transcriptionally regulates multiple proteins, including p21Cip1, p27Kip1, and cyclin D1.36, 37 There is considerable evidence that Akt kinase, which acts upstream of FOXO3a, has important roles in cell cycle control.38 In the current study, we found that KPNA2 knockdown decreased the level of phosphorylated Akt and phosphorylated FOXO3a, indicating that downregulation of KPNA2 may arrest EOC cells at the G1 phase through the Akt/FOXO3a pathway. A study by Brysk et al.33 reported that the MRE11–RAD50–NBS1 complex serves as a sensor and a mediator in cell cycle checkpoint signaling. NBS1 functions as a tumor suppressor by preserving genome integrity in the nucleus, and may also have an oncogenic role in the cytoplasm associated with the PI3-kinase/Akt-activation pathway. Experimental evidence has demonstrated that NBS1 is translocated into the nucleus by importin KPNA2, which mediates NBS1 subcellular localization and its functions in tumorigenesis, as part of the MRE11–RAD50–NBS1 complex.33 However, we did not find changes in NBS1 expression or location in KPNA2-knockdown and -overexpressing EOC cells. We speculate that KPNA2 may contribute to other mechanisms in Akt activation, which require further investigation.
In summary, we have clearly shown that KPNA2 is overexpressed in EOC, and that its upregulation is associated with poor prognosis. Furthermore, knockdown of KPNA2 inhibited the proliferation and tumorigenicity of EOC cells by inhibiting c-Myc transactivation activity and by enhancing FOXO3a activity, revealing a new mode of action in the molecular mechanisms underlying tumorigenesis of EOC. Our characterization of the oncogenic functions and mechanisms of KPNA2 will not only increase our understanding of EOC development and progression but also presents a novel therapeutic target for EOC treatment.
Materials and Methods
Cell culture
Ovarian cancer cell lines (OVSAHO, OV56, OV90, COV644, CaO3, COVAR4, SKOV3, and EFO21) were grown in DMEM medium (Invitrogen, Carlsbad, CA, USA) supplemented with 10% fetal bovine serum (HyClone, Logan, UT, USA) and 1% penicillin–streptomycin. Cells were maintained at 37 °C in a humidified atmosphere of 5% CO2.
Plasmids
A KPNA2 expression construct was generated by subcloning the PCR-amplified full-length human KPNA2 cDNA into the pMSCV plasmid. For depletion of KPNA2, two human shRNAs sequences were cloned into the pSuper-retro-puro plasmid to generate pSuper-retro-KPNA2-RNAi(s) (Langri, GangZhou, China) with the following sequences: RNAi#1, 5′-ATTTACAGTGCCCTGGTTG-3′ RNAi#2, 5′-TTAACGAAGCC TTATACAC-3′. Stable cell lines expressing KPNA2 or KPNA2 shRNAs were selected for 10 days with 0.5 mg/ml puromycin. A c-Myc expression construct was generated by subcloning the PCR-amplified full-length human c-Myc cDNA into the pMSCV plasmid. Transfection of plasmids was carried out using Lipofectamine 2000 reagent (Invitrogen), according to the manufacturer's instructions.
Patients and tissue specimens
Snap-frozen tissues were obtained from 191 EOC patients between January 2001 and October 2007, and preserved at −80 °C. All patients had undergone oophorosalpingectomy, or surgical debulking, before chemotherapy at the Cancer Center, Sun Yat-Sen University, Guangzhou, PR China. EOC tissues were dissected from the resected tumors; HOSE specimens were obtained from the ovarian surface epithelium of the normal-appearing ovary removed from patients, where only one ovary had been classed as EOC (stage IA), based on the principles of surgical management of cancer. This was confirmed by histopathological review. EOC patients were staged according to the FIGO 1994 classification guidelines. An experienced pathologist performed the grading and histopathological subtyping of specimens, based on World Health Organization (WHO) criteria. Clinical information of the samples is summarized in Table 1. The Ethical Committee of the Cancer Center, Sun Yat-Sen University, approved this study.
RNA extraction and real-time qRT-PCR
Total RNA from cultured cells and fresh frozen EOC tissues was extracted using Trizol reagent (Invitrogen), according to the manufacturer's instructions. Reverse transcriptase reactions using MMLV reverse transcriptase reagents (Promega Corporation, Madison, WI, USA) were performed following the manufacturer's protocol. Real-time qRT-PCR was performed using Platinum SYBR Green qPCR SuperMix-UDG reagents (Invitrogen) in an Applied Biosystems PRISM 7900HT, according to the manufacturer's protocol. The following primers were selected: KPNA2, forward 5′-ATTGCAGGTGATGGCTCAGT-3′ and reverse 5′-CTGCTCAACAGCATCTATCG-3′ β-actin, forward 5′-TGGCACCCAGCACAATGAA-3′ and reverse 5′-CTAAGTCATAGTCCGCCTAGAAGCA-3′ cyclinD1, forward 5′-TCTGTGCCACAGATGTGAAG-3′ and reverse 5′-AGCGTGTGAGGCGGTAGTAG-3′ Ki67, forward 5′-CATCAAGGAACAGCCTCAAC-3′ and reverse 5′-GTTGACTTCGGCTGATAGAC-3′ p21, forward 5′-GATGTGCCTATGGTCCTAGT-3′ and reverse 5′-CATCGTCAACACCCTGTCTT-3′ and p27, forward 5′-GCGGCAGAAGATTCTTCTTCG-3′ and reverse 5′-TGCTCCACAGTGCCAGCATT-3′. ABI PRISM Cycler software (ABI, Foster City, CA, USA) was used to calculate the threshold cycle number (Ct) value for β-actin and KPNA2 during the log phase of each cycle. KPNA2 levels were normalized to the expression level of β-actin (ΔCt=CtKPNA2−Ctβ-actin). These values were compared with values obtained from a testis sample, which served as a positive control, according to the formula: 2−ΔΔCt, where ΔΔCt=ΔCtunknown−ΔCtpositive control. To minimize experimental variability, each sample was analyzed in triplicate and the mean expression level was calculated.
Western blotting
The western blotting analysis was performed according to standard methods, as previously described,39 using anti-KPNA2 (Abcam, Cambridge, UK), anti- total Akt, anti-p-Akt, anti-total FOXO3a, anti-p-FOXO3a (Ser253), anti-ki67, anti-p21Cip1, anti-p27Kip1, anti-cyclinD1, and anti-c-Myc antibodies (Cell Signaling Technology, Danvers, MA, USA). The polyvinylidene fluoride membranes were stripped and re-blotted with an anti-β-actin monoclonal antibody (Sigma, St. Louis, MO, USA) as a loading control.
Subcellular fractionation
KPNA2-knockdown and -overexpressing SK-OV3 cells transfected with pMSCV-c-Myc plasmid were subjected to subcellular fractionation using the cytoplasmic and nuclear protein extraction kit P0028 (Beyotime Biotechnology, Shang Hai, China), according to the manufacturer's instructions. The efficacy of fractionation was determined via western blotting using anti-GAPDH antibodies (Sigma) as the cytosolic control and anti-Lamin B antibodies (Cell Signaling Technology) as the nuclear control protein. The experiment was performed in triplicate.
MTT assays
Cells (2000 cells/well) were seeded in 96-well plates and stained at specified time points with 100 ml sterile MTT dye (0.5 mg/ml, Sigma) for 4 h at 37 °C. The culture medium was removed and 150 ml of dimethyl sulfoxide (Sigma) was added. The absorbance was measured at 570 nm, with 655 nm as the reference wavelength. All experiments were performed in triplicate.
Anchorage-independent growth ability assay
Cells (500 cells/plate) were trypsinized and suspended in 2 ml complete medium plus 0.3% agar (Sigma). The agar–cell mixture was plated on top of a bottom layer with 1% complete medium agar mixture. After 10 days, viable colonies that contained more than 50 cells or were larger than 0.1 mm in diameter were counted. Colony sizes were measured using an ocular micrometer. The experiment was performed in triplicate for each cell line.
Colony formation assays
Cells were plated on 6-well (500 cells/plate) plates and cultured for 10 days. The colonies were fixed with 10% formaldehyde for 5 min and then stained with 1.0% crystal violet for 30 s. Colonies larger than 0.1 mm diameter were scored. The experiment was performed in triplicate for each cell line.
BrdU labeling and immunofluorescence
Cells were grown on coverslips (Fisher, Pittsburgh, PA, USA) and incubated with BrdU for 1 h and stained with anti-BrdU antibody (Upstate, Temecula, CA, USA), according to the manufacturer's instructions. Gray level images were acquired under a laser scanning microscope (Axioskop 2 plus, Carl Zeiss Co. Ltd., Jena, Germany).
Flow cytometry cell cycle analysis
Cultured cells were harvested by trypsinization, washed in ice-cold PBS, and fixed in 75% ice-cold ethanol. Cell cycle analysis was performed by flow cytometry. Briefly, the fixed cells were centrifuged at 1000 r.p.m. and washed twice with ice-cold PBS. RNase A (20 mg/ml, final concentration) and propidium iodide staining solution (50 mg/ml, final concentration) were then added and the cells were incubated at 37 °C for 30 min in the dark. Cell cycle analysis (50 000 cells per sample) was carried out in a flow cytometer (FACSCalibur; BD Biosciences, Lexington, KY, USA). ModFit LT 3.1 trial cell cycle analysis software (Beckman Coulter Inc., Brea, CA, USA) was used to determine the percentage of cells at each phase of the cell cycle.
Luciferase assay
Briefly, 50 000 cells per plate were seeded in 6-well plates in triplicate, and allowed to settle for 12 h. EOC cells were transfected with 100 ng c-Myc-responsive 4 × E-box reporter-luciferase plasmid or 100 ng control-luciferase plasmid, plus 10 ng pRL-TK renilla plasmid using Lipofectamine 2000 reagent (Invitrogen). Media were replaced at 6 h, and the luciferase and the renilla signals were measured 48 h after transfection using the Dual Luciferase Reporter Assay Kit (Promega Corporation), according to the manufacturer's protocol.
Animal experiments
Eight female BALB/c-nu mice (4–5 weeks of age, 18–20 g) were purchased from the Center of Experimental Animals of Guangzhou University of Chinese Medicine. The mice were housed in barrier facilities on a 12-h light/dark cycle. Animal experiments were carried out in compliance with the Welfare of Experimental Animals guidelines at Sun Yat-Sen University. Cells (2 × 10⁶ EFO-21/vector versus 2 × 10⁶ EFO-21/KPNA2; and 2 × 10⁶ EFO-21/Scramble versus 2 × 10⁶ EFO-21/siKPNA2 #1) were suspended in RPMI 1640 medium and injected subcutaneously into the left and right flanks of mice (n=4, respectively). The resulting tumors were examined every 3 days for 30 days. Tumor size was measured using calipers, and tumor volumes were calculated (V=0.5 × L × W2). The mice were killed and the tumors were excised, fixed in 10% formalin, and embedded in paraffin blocks for IHC study.
Statistical analysis
The χ2 test was used for correlation analysis between clinicopathological features of patients with EOC and KPNA2 expression profiles. Survival curves were plotted by the Kaplan–Meier method and compared using the log-rank test. Survival data were evaluated by univariate and multivariate Cox regression analyses. Student's t-test (two-tailed) was used to evaluate significant differences between pairs of experimental data where appropriate. SPSS version 16.0 statistical software package (SPSS Inc., Chicago, IL, USA) was used for the statistical analyses. Statistical significance was set at P<0.05.
Acknowledgments
This work was supported by grants from the National Natural Science Foundation of China (Grant No. 81171948), the Key Program of Natural Science Foundation of Guangdong Province, China (Grant No. S2012020011060), and the Project of State Key Laboratory of Oncology in South China (Grant No. 030041060004).
Glossary
- BrdU
5-bromo-20 -deoxyuridine
- CDK
cyclin dependent kinase
- EOC
epithelial ovarian carcinoma
- IHC
immunohistochemical
- KPNA2
Karyopherin alpha 2
- MTT
3-(4,5-dimethylthiazol- 2-yl)-2, 5-diphenyltetrazolium bromide
- qRT-PCR
real-time quantitative RT-PCR
- WHO
World Health Organization
The authors declare no conflict of interest.
Footnotes
Edited by G Raschellà
References
- Stewart M. Molecular mechanism of the nuclear protein import cycle. Nat Rev Mol Cell Biol. 2007;8:195–208. doi: 10.1038/nrm2114. [DOI] [PubMed] [Google Scholar]
- Kelley JB, Talley AM, Spencer A, Gioeli D, Paschal BM. Karyopherin alpha 7 (KPNA7), a divergent member of the importin alpha family of nuclear import receptors. BMC Cell Biol. 2010;11:63. doi: 10.1186/1471-2121-11-63. [DOI] [PMC free article] [PubMed] [Google Scholar]
- Radu A, Blobel G, Moore MS. Identification of a protein complex that is required for nuclear protein import and mediates docking of import substrate to distinct nucleoporins. Proc Natl Acad Sci USA. 1995;92:1769–1773. doi: 10.1073/pnas.92.5.1769. [DOI] [PMC free article] [PubMed] [Google Scholar]
- Weis K, Mattaj IW, Lamond AI. Identification of hSRP1 alpha as a functional receptor for nuclear localization sequences. Science. 1995;268:1049–1053. doi: 10.1126/science.7754385. [DOI] [PubMed] [Google Scholar]
- Gorlich D, Henklein P, Laskey RA, Hartmann EA. 41 amino acid motif in importin-alpha confers binding to importin-beta and hence transit into the nucleus. EMBO J. 1996;15:1810–1817. [PMC free article] [PubMed] [Google Scholar]
- Weis K, Ryder U, Lamond AI. The conserved amino-terminal domain of hSRP1 alpha is essential for nuclear protein import. EMBO J. 1996;15:1818–1825. [PMC free article] [PubMed] [Google Scholar]
- Winnepenninckx V, Lazar V, Michiels S, Dessen P, Stas M, Alonso SR, et al. Gene expression profiling of primary cutaneous melanoma and clinical outcome. J Natl Cancer Inst. 2006;98:472–482. doi: 10.1093/jnci/djj103. [DOI] [PubMed] [Google Scholar]
- Watt PJ, Maske CP, Hendricks DT, Parker MI, Denny L, Govender D, et al. The karyopherin proteins, Crm1 and karyopherin beta1, are overexpressed in cervical cancer and are critical for cancer cell survival and proliferation. Int J Cancer. 2009;124:1829–1840. doi: 10.1002/ijc.24146. [DOI] [PMC free article] [PubMed] [Google Scholar]
- Sakai M, Sohda M, Miyazaki T, Suzuki S, Sano A, Tanaka N, et al. Significance of karyopherin-{alpha} 2 (KPNA2) expression in esophageal squamous cell carcinoma. Anticancer Res. 2010;30:851–856. [PubMed] [Google Scholar]
- Wang CI, Wang CL, Wang CW, Chen CD, Wu CC, Liang Y, et al. Importin subunit alpha-2 is identified as a potential biomarker for non-small cell lung cancer by integration of the cancer cell secretome and tissue transcriptome. Int J Cancer. 2011;128:2364–2372. doi: 10.1002/ijc.25568. [DOI] [PubMed] [Google Scholar]
- Zheng M, Tang L, Huang L, Ding H, Liao WT, Zeng MS, et al. Overexpression of karyopherin-2 in epithelial ovarian cancer and correlation with poor prognosis. Obstet Gynecol. 2010;116:884–891. doi: 10.1097/AOG.0b013e3181f104ce. [DOI] [PubMed] [Google Scholar]
- Mortezavi A, Hermanns T, Seifert HH, Baumgartner MK, Provenzano M, Sulser T, et al. KPNA2 expression is an independent adverse predictor of biochemical recurrence after radical prostatectomy. Clin Cancer Res. 2011;17:1111–1121. doi: 10.1158/1078-0432.CCR-10-0081. [DOI] [PubMed] [Google Scholar]
- Gousias K, Becker AJ, Simon M, Niehusmann P. Nuclear karyopherin a2: a novel biomarker for infiltrative astrocytomas. J Neurooncol. 2012;109:545–553. doi: 10.1007/s11060-012-0924-2. [DOI] [PubMed] [Google Scholar]
- Yoshitake K, Tanaka S, Mogushi K, Aihara A, Murakata A, Matsumura S, et al. Importin-alpha1 as a novel prognostic target for hepatocellular carcinoma. Ann Surg Oncol. 2011;18:2093–2103. doi: 10.1245/s10434-011-1569-7. [DOI] [PubMed] [Google Scholar]
- Jensen JB, Munksgaard PP, Sorensen CM, Fristrup N, Birkenkamp-Demtroder K, Ulhoi BP, et al. High expression of karyopherin-alpha2 defines poor prognosis in non-muscle invasive bladder cancer and in patients with invasive bladder cancer undergoing radical cystectomy. Eur Urol. 2011;59:841–848. doi: 10.1016/j.eururo.2011.01.048. [DOI] [PubMed] [Google Scholar]
- Dahl E, Kristiansen G, Gottlob K, Klaman I, Ebner E, Hinzmann B, et al. Molecular profiling of laser-microdissected matched tumor and normal breast tissue identifies karyopherin alpha2 as a potential novel prognostic marker in breast cancer. Clin Cancer Res. 2006;12:3950–3960. doi: 10.1158/1078-0432.CCR-05-2090. [DOI] [PubMed] [Google Scholar]
- Dankof A, Fritzsche FR, Dahl E, Pahl S, Wild P, Dietel M, et al. KPNA2 protein expression in invasive breast carcinoma and matched peritumoral ductal carcinoma in situ. Virchows Arch. 2007;451:877–881. doi: 10.1007/s00428-007-0513-5. [DOI] [PubMed] [Google Scholar]
- Gluz O, Wild P, Meiler R, Diallo-Danebrock R, Ting E, Mohrmann S, et al. Nuclear karyopherin alpha2 expression predicts poor survival in patients with advanced breast cancer irrespective of treatment intensity. Int J Cancer. 2008;123:1433–1438. doi: 10.1002/ijc.23628. [DOI] [PubMed] [Google Scholar]
- Baudino TA, Cleveland JL. The Max network gone mad. Mol Cell Biol. 2001;21:691–702. doi: 10.1128/MCB.21.3.691-702.2001. [DOI] [PMC free article] [PubMed] [Google Scholar]
- Grandori C, Cowley SM, James LP, Eisenman RN. The Myc/Max/Mad network and the transcriptional control of cell behavior. Annu Rev Cell Dev Biol. 2000;16:653–699. doi: 10.1146/annurev.cellbio.16.1.653. [DOI] [PubMed] [Google Scholar]
- Nadler SG, Tritschler D, Haffar OK, Blake J, Bruce AG, Cleaveland JS. Differential expression and sequence-specific interaction of karyopherin alpha with nuclear localization sequences. J Biol Chem. 1997;272:4310–4315. doi: 10.1074/jbc.272.7.4310. [DOI] [PubMed] [Google Scholar]
- Wang CI, Chien KY, Wang CL, Liu HP, Cheng CC, Chang YS, et al. Quantitative proteomics reveals regulation of karyopherin subunit alpha-2 (KPNA2) and its potential novel cargo proteins in non-small cell lung cancer. Mol Cell Proteomics. 2012;11:1105–1122. doi: 10.1074/mcp.M111.016592. [DOI] [PMC free article] [PubMed] [Google Scholar]
- Chook YM, Blobel G. Karyopherins and nuclear import. Curr Opin Struc Biol. 2001;11:703–715. doi: 10.1016/s0959-440x(01)00264-0. [DOI] [PubMed] [Google Scholar]
- Poon IK, Jans DA. Regulation of nuclear transport: central role in development and transformation. Traffic. 2005;6:173–186. doi: 10.1111/j.1600-0854.2005.00268.x. [DOI] [PubMed] [Google Scholar]
- Zannini L, Lecis D, Lisanti S, Benetti R, Buscemi G, Schneider C, et al. Karyopherin-alpha2 protein interacts with Chk2 and contributes to its nuclear import. J Biol Chem. 2003;278:42346–42351. doi: 10.1074/jbc.M303304200. [DOI] [PubMed] [Google Scholar]
- Tseng SF, Chang CY, Wu KJ, Teng SC. Importin KPNA2 is required for proper nuclear localization and multiple functions of NBS1. J Biol Chem. 2005;280:39594–39600. doi: 10.1074/jbc.M508425200. [DOI] [PubMed] [Google Scholar]
- Kim IS, Kim DH, Han SM, Chin MU, Nam HJ, Cho HP, et al. Truncated form of importin alpha identified in breast cancer cell inhibits nuclear import of p53. J Biol Chem. 2000;275:23139–23145. doi: 10.1074/jbc.M909256199. [DOI] [PubMed] [Google Scholar]
- Braem CV, Kas K, Meyen E, Debiec-Rychter M, Van De Ven WJ, Voz ML. Identification of a karyopherin alpha 2 recognition site in PLAG1, which functions as a nuclear localization signal. J Biol Chem. 2002;277:19673–19678. doi: 10.1074/jbc.M112112200. [DOI] [PubMed] [Google Scholar]
- Huang H, Tindall DJ. Dynamic FoxO transcription factors. J Cell Sci. 2007;120:2479–2487. doi: 10.1242/jcs.001222. [DOI] [PubMed] [Google Scholar]
- Shipley GD, Pittelkow MR, Wille JJ, Scott RE, Moses HL. Reversible inhibition of normal human prokeratinocyte proliferation by type ¦β transforming growth factor-growth inhibitor in serum-free medium. Cancer Res. 1986;46:2068–2071. [PubMed] [Google Scholar]
- Alexandrow MG, Kawabata M, Aakre M, Moses HL. Overexpression of the c-Myc oncoprotein blocks the growth-inhibitory response but is required for the mitogenic effects of transforming growth factor b1. Proc Natl Acad Sci USA. 1995;92:3239–3243. doi: 10.1073/pnas.92.8.3239. [DOI] [PMC free article] [PubMed] [Google Scholar]
- Saunders NA, Jetten AM. Control of growth regulatory and differentiation-specific genes in human epidermal keratinocytes by interferon gamma. Antagonism by retinoic acid and transforming growth factor beta 1. J Biol Chem. 1994;269:2016–2022. [PubMed] [Google Scholar]
- Brysk MM, Bell T, Hoida C, Tyring SK, Rajaraman S. Interferon-gamma modulates terminal differentiation and the expression of desquamin in cultured keratinocytes. Exp Cell Res. 1991;197:140–147. doi: 10.1016/0014-4827(91)90415-q. [DOI] [PubMed] [Google Scholar]
- Tamai K, Li K, Silos S, Rudnicka L, Hashimoto T, Nishikawa T, et al. Interferon-gamma-mediated inactivation of transcription of the 230-kDa bullous pemphigoid antigen gene (BPAG1) provides novel insight into keratinocyte differentiation. J Biol Chem. 1995;270:392–396. doi: 10.1074/jbc.270.1.392. [DOI] [PubMed] [Google Scholar]
- Coffey RJ, Bascom CC, Sipes NJ, Graves-Deal R, Weissman BE, Moses HL. Selective inhibition of growth-related gene expression in murine keratinocytes by transforming growth factor b. Mol Cell Biol. 1988;8:3088–3093. doi: 10.1128/mcb.8.8.3088. [DOI] [PMC free article] [PubMed] [Google Scholar]
- Huang SM, Huang SP, Wang SL, Liu PY. Importin alpha1 is involved in the nuclear localization of Zac1 and the induction of p21WAF1/CIP1 by Zac1. Biochem J. 2007;402:359–366. doi: 10.1042/BJ20061295. [DOI] [PMC free article] [PubMed] [Google Scholar]
- Chatterjee A, Chatterjee U, Ghosh MK. Activation of protein kinase CK2 attenuates FOXO3a functioning in a PML-dependent manner: implications in human prostate cancer. Cell Death Dis. 2013;4:e543. doi: 10.1038/cddis.2013.63. [DOI] [PMC free article] [PubMed] [Google Scholar]
- Luo H, Yang Y, Duan J, Wu P, Jiang Q, Xu C. PTEN-regulated AKT/FoxO3a/Bim signaling contributes to reactive oxygen species-mediated apoptosis in selenite-treated colorectal cancer cells. Cell Death Dis. 2013;4:e481. doi: 10.1038/cddis.2013.3. [DOI] [PMC free article] [PubMed] [Google Scholar]
- Li J, Zhang N, Song LB, Liao WT, Jiang LL, Gong LY, et al. Astrocyte elevated gene-1 is a novel prognostic maker for breast cancer progression and overall patient survival. Clin cancer Res. 2008;14:3319–3326. doi: 10.1158/1078-0432.CCR-07-4054. [DOI] [PubMed] [Google Scholar]


