

Abstract
This study aimed to assess the association between household socioeconomic position and tuberculosis (TB) infection in two communities of Zambia. For this purpose we implemented a cross-sectional investigation, nested within a larger case control study. Infection was assessed using Quantiferon-TB Gold. A socioeconomic position index was constructed through principal component analysis combining data on human resources, food availability, housing quality, and access to services and infrastructures. In this study, higher socioeconomic position, rather than lower, was associated with significantly higher risk of TB infection. None of the traditional risk factors for TB infection mediated this association, suggesting that in these two communities TB transmission may occur through exposure to as yet undefined risk factors that are associated with higher socioeconomic position. Although further studies are needed, these results suggest emerging new patterns of TB transmission and a role of socioeconomic position on the risk of TB infection opposite to that expected.
INTRODUCTION
Tuberculosis (TB) is considered to be a disease of poverty. 1 Its association with low socioeconomic position (SEP) is well established at the ecologic level: 17 of the 22 highest burden countries accounting for 80% of the world’s TB cases are classified as low income. 2 The World Health Organization (WHO) estimates that 98% of the 2 million annual TB deaths and 95% of the 8.4 million new TB cases occur in developing countries. 3 Furthermore, recent data from the United States suggest that socioeconomic factors act independently from the human immunodeficiency virus (HIV) epidemic. 4,5
In contrast, the association between TB and low SEP at the individual level is less well characterized and studies provide more conflicting results. 5,6 This is probably because living conditions are time- and setting-specific and because of the inconsistency of the measurement strategies adopted. In TB studies, the most frequently used SEP indicators are median household income, expenditure, crowding, level of education, and housing quality. 4,7–17 Composite indicators have also been used, such as the Townsend deprivation index 8 and the Jarman index. 9
Results interpretation is also made difficult by the two-stage nature of TB, characterized by an infection and a disease stage. Often studies do not clearly differentiate between TB infection and TB disease, and it is not yet clear how SEP is associated with the risk of becoming infected, the risk of developing the disease, or both.
Understanding the association between SEP and risk of TB infection (rather than disease) is further complicated by the fact that TB infection has traditionally been assessed by the tuberculin skin test, a tool in which TB extracts are injected and skin induration 2 days later is considered a sign of TB infection. Tuberculin skin test is prone to false positive results as a consequence of bacilli Calmette-Guérin (BCG) vaccination and exposure to environmental bacteria, 18,19 both of which are associated with SEP. 20–22
These problems in assessing SEP and TB infection may explain the conflicting results of the few published studies. Research in North America and Europe showed that tuberculin skin test positivity was least frequent in households with higher educational level, income, skilled occupations, and room size. 7,23,24 In contrast, studies in the Gambia, 10 Malawi, 11 and Peru 25 found that the risk of tuberculin skin test positivity was not associated with socioeconomic indicators.
Recently, an easier and more standardized approach in the assessment of SEP has been proposed by Filmer and Pritchet, 26 whereby households are ranked according to the ownership of assets. In this approach, the relative weight of each asset is computed through principal component analysis, a data reduction strategy used to reduce a number of exposures to a single proxy measure. 26,27 Principal component analysis produces a set of linear combinations of the original variables and typically the first combination is the composite index extracted, having the largest amount of information common to all the variables. The creation of this composite index results in the computation of a SEP score. 27,28
The diagnosis of TB infection has also recently been enhanced with an in-vitro interferon-gamma (IFN)-γ release assay that is unaffected by BCG vaccination and environmental mycobacteria, allowing more accurate assessment of TB infection. 29,30
The aim of this study was to use these improved methods of measuring SEP and TB infection to investigate the association between SEP and risk of TB infection in Zambia, which has one of the highest tuberculosis incidences in the world. 31
METHODS
Study design
Between June 2005 and March 2006 a population-based HIV-tuberculosis prevalence survey was conducted among all residents over 15 years of age from two Zambian communities: one rural (~13.000 inhabitants) and one urban (~11.000 inhabitants). Both areas are located in the Lusaka province, where ~40% of the population live in extreme poverty. 32 The prevalence of TB was estimated to be 650/100,000 (95% confidence interval [CI] 360–940/100,000) in the rural and 1200/100,000 (95% CI 750–1640/100,000) in the urban area (Ayles H and others, unpublished data).
We conducted a case control study nested in the previous population-based prevalence survey, recruiting 106 prevalent cases and 318 controls aimed to assess the effect of household SEP on the risk of prevalent tuberculosis. A case was defined as any person enrolled in the prevalence survey from which Mycobacterium tuberculosis was grown in at least one sputum culture. A control was defined as any person whose sputum culture was negative for M. tuberculosis. Controls were frequency matched to the cases by age group and area of residence (i.e., urban versus rural). For the selection of these general-population controls, all individuals enumerated in the prevalence survey have been first stratified by area and age groups and then randomly selected from each category according to the age group and area distribution of the cases.
In order to assess the effect of household SEP on the risk of TB infection we adopted an unusual, but opportunistic design: we restricted the analysis only to these 318 controls and considered them as an age and rural/urban stratified random cross-sectional sample of the population. Each subject was classified as tuberculosis infected or non-tuberculosis infected and these groups were compared in terms of their socioeconomic characteristics.
Because this analysis was a secondary analysis, restricted only to these controls available from the case control study, formal a priori power calculations were not made in respect of the exploratory hypothesis we investigate here.
Informed written consent was requested for study participation. Ethical approval was obtained both from the University of Zambia and the London School of Hygiene and Tropical Medicine research ethics committee.
Infection status assessment
Infection status was assessed using Quantiferon®—TB Gold (In Tube), (Cellestis; Carnagie, Australia), an in vitro laboratory test using a whole blood specimen for the diagnosis M. tuberculosis complex infection. The test is based on the measurement of INF-γ released by sensitized T cells after stimulation with tuberculosis antigens. 30 Blood samples were collected, stored, tested, and results interpreted according to the instructions (Cellestis; Carnegie, Australia).
Because of health and safety considerations, blood samples were collected in two clinics in the urban and rural area. To better monitor participation, consenting people were given an appointment for blood testing. Each participant giving consent, but not coming to the clinic on the agreed date, was visited three times before being excluded from blood collection.
Prevalence of infection was defined as the number of Quantiferon positives divided by the total number of participants with interpretable results. Individuals having indeterminate Quantiferon results were excluded from the analysis.
Definition of socioeconomic position
SEP was defined only at household level. For the construction of the SEP index we took into account four different dimensions or aspects relevant to the definition of SEP in this context: 1) human resources, 2) food availability and vulnerability, 3) assets ownership and housing quality, 4) access to community infrastructures and facilities (Figure 1). This latter domain describes features of the area and neighborhood more than household characteristics.
Figure 1.

Conceptual framework showing the hypothesized relationship between SEP (a) and tuberculosis infection. * Variables included in the first principal component extracted (i.e., the SEP composite index). (a) For each domain of SEP considered, only some of the SEP proxies characterized in the questionnaire are included in the figure. (b) Coping strategies were defined as the number of activities implemented in time of hardship during the 12 months prior to the study. (c) Durable assets included radio, TV, bicycle, fridge, car, or motorbike. (d) Housing material included roof, floor, and wall quality. (e) Variables in this domain are more area/neighborhood features rather than household characteristics. (f) Crowding was defined according to the number of people sharing the same sleeping room. Three levels of crowding were identified: less crowded (< 3 people sharing the same sleeping room), crowded (3–4 people sharing the same sleeping room), more crowded (> 4 people sharing the same sleeping room). The cutoffs were decided according to the average number of people per sleeping room in the sample (i.e., ~3 people per sleeping room).
Analysis was conducted combining households from both areas. Variables from across all four domains were included in a principal component analysis 26 (PCA) and screened out according to their loading factor (i.e., strength of correlation with each other). A total of 21 variables were considered for inclusion, of which 11 were included into PCA. The principal component so generated was used to assign to each household a SEP score in relation to all other households in the sample. Finally, households were grouped into SEP groups: very poor, poor, and less poor. To convert the SEP scoring into categories made the results more easily interpretable, because a unit increase of the SEP score does not correspond to any meaningful level of SEP.
Data collection and data analysis
Data was collected during visits to respondents’ homes and used two different structured questionnaires: one assessed individual socio-demographic characteristics (i.e., age, gender, education, occupation) and known risk factors for TB infection and disease (i.e., HIV status, contact with TB cases, smoking, alcohol, migration, past disease history); the second questionnaire assessed the household SEP, including the variables discussed previously.
Data were collected over 12 months (March 2006–March 2007), double entered and checked using Epi-Info Software, and analyzed with Stata Software (Version 9; Stata Corporation, College Station, TX). Odds ratios (OR) with 95% Confidence Intervals (CI) for determinants of infection were assessed through univariable and multivariable logistic regression analysis. The likelihood ratio test was used to assess the overall significance of risk factors, test for trend, and test for interaction.
Figure 1 outlines the conceptual framework we used to guide our investigation of the possible association between SEP (and each composing domain) and TB infection. Two pathways have been hypothesized: one affecting the risk of TB infection directly; and the other one indirectly through the effect of mediating factors (i.e., more proximal risk factors) that are on the causal pathway leading from SEP to TB infection. 33 In researching the mediating pathway, we seek to explore the extent to which variation of TB infection risk across SEP terciles is explained by differential exposure to these risk factors across SEP groups. The list of mediating factors explored is illustrated in Figure 1.
The association between SEP and TB infection was explored looking both at the composite index and the individual SEP proxies from which the composite index was derived. This second approach allowed us to explore whether any of the domains were more important in explaining the association between SEP and TB infection.
The association between SEP and TB infection was first adjusted for BCG vaccination and HIV status, considered to be potential confounding factors because both are associated with SEP and the likelihood of TB infection and Quantiferon positivity. The mediation effect was assessed through the construction of a multivariable model containing SEP, the outcome of interest and, one by one, each of the risk factors explored. A reduction in the OR for SEP associated with TB infection upon inclusion of any of these variables was considered suggestive of mediation. Each model was always adjusted for age, gender, and area of residence. The same approach was used for each of the SEP proxies investigated.
RESULTS
Population sampled
Consent to blood testing was given by 265 out of the 318 participants (83.3%) originally enrolled as controls in the case control study. Blood samples were collected from 188 of these subjects (Figure 2) and Quantiferon analysis performed on 174 of the 188 (92.4%) available samples. The remaining samples (N = 14) were not tested because of insufficient blood collection or because they were not incubated within the required time.
Figure 2.

Flow diagram of study participation. * Bad weather conditions and poor road access.
Eighty-three out of 174 participants (47.7%) whose samples were available were Quantiferon positive and therefore classified as TB infected. Seven participants were classified as indeterminate (4.0%) and excluded from further analysis. The difference in the estimated proportion of infection between areas (45.9% and 51.9%, respectively, for the rural and urban area) was not statistically significant (P = 0.5).
Compared with individuals for whom blood samples were unavailable (N = 144), subjects included in the final analysis (N = 174) were more likely to be literate (OR = 2.9, 95% CI: 1.5–5.6, P < 0.001), to come from the urban area (OR = 5.6, 95% CI: 3.4–9.2, P < 0.001), and to be less poor (OR = 2.0, 95% CI: 1.2–3.6 and OR = 4.4, 95% CI: 2.5–7.9, P < 0.001, respectively, for the poor and less poor compared with those classified as more poor); However, after these variables were included in a logistic regression model together with gender and age, only coming from the urban area was independently associated with an increase odds of having given blood (OR = 3.8, 95% CI: 2.2–6.7, P < 0.001).
Risk factors for TB infection
In the univariable analysis relatively wealthier household SEP was associated with higher prevalence of TB infection (Figure 3A, Table 1).
Figure 3.
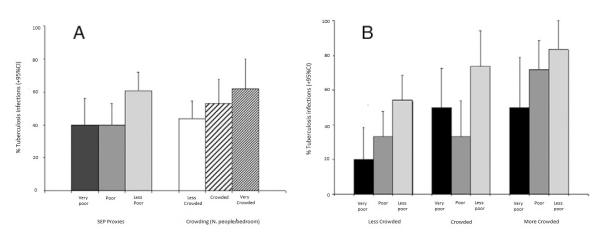
Associations between tuberculosis (TB) infection, socioeconomic position (SEP), and crowding. (A) Associations shown separately. (B) Association between TB (and SEP by level of crowding).
Table 1.
Risk factors for tuberculosis (TB) infection: univariable analysis (N. 84 Quantiferon negative; N. 83 Quantiferon positive)*
| Exposures | Quantiferon positives n/N (%) |
Unadjusted odds ratio (95% CI) |
P value |
|---|---|---|---|
| SEP index | |||
| Less poor | 47/77 (61.0) | 1.0 | 0.02 |
| Poor | 21/53 (39.6) | 0.4 (0.2–0.8) | |
| Very poor | 15/37 (40.5) | 0.4 (0.2–0.9) | |
| Gender | |||
| Male | 36/76 (47.4) | 1.0 | 0.6 |
| Female | 47/91 (50.0) | 1.2 (0.6–2.2) | |
| Age group (years) | |||
| 15–29 | 29/58 (50.0) | 1.0 | 0.9 |
| 30–44 | 37/76 (48.7) | 0.9 (0.5–1.9) | |
| ≥ 45 | 17/33 (51.5) | 1.1 (0.4–2.5) | |
| Area of residence | |||
| Rural | 38/61 (45.9) | 1.0 | 0.5 |
| Urban | 55/106 (51.9) | 1.3 (0.7–2.4) | |
| BCG vaccination | |||
| Yes | 78/160 (48.7) | 1.0 | 0.6 |
| No | 3/5 (60.0) | 1.6 (0.2–9.7) | |
| HIV status | |||
| Positive | 24/49 (49.0) | 1.0 | 0.9 |
| Negative | 59/118 (50.0) | 1.0 (0.5–1.9) | |
| Alcohol consumption† | |||
| No | 58/118 (49.1) | 1.0 | 0.8 |
| Yes | 25/49 (51.0) | 1.1 (0.6–2.1) | |
| Smoking‡ | |||
| No | 72/144 (50.0) | 1.0 | 0.8 |
| Yes | 11/23 (47.8) | 0.9 (0.4–2.2) | |
| Known contact with TB | |||
| No | 59/120 (49.2) | 1.0 | 0.9 |
| Yes | 16/32 (50.0) | 1.0 (0.5–2.2) | |
| Weekly number of meals containing proteins§ | |||
| 0 | 14/40 (35.0) | 1.0 | 0.04 |
| 1 | 25/46 (54.3) | 2.2 (0.9–5.3) | |
| 2 | 17/37 (46.0) | 1.6 (0.6–3.9) | |
| > 2 | 27/44 (61.4) | 3.0 (1.2–7.2) | |
| Crowding | |||
| Less crowded | 37/85 (45.5) | 1.0 | 0.09¶ |
| Crowded | 35/47 (53.2) | 1.5 (0.7–3.0) | |
| More crowded | 21/35 (60.0) | 1.9 (0.9–4.3) | |
CI = confidence interval; SEP = socioeconomic position; BCG = bacilli Calmette-Guérin; HIV = human immunodeficiency virus.
Drinking more than 3 drinks containing alcohol per day.
Including current or past smo king.
Weekly consumption of meals containing protein as reported by the respondent.
Test for trend.
Infection status was not associated with any other sociodemographic variables considered, including gender (P = 0.6) and age (P = 0.9). Among the known risk factors explored, only people having more than two meals containing proteins per week were more likely to be TB infected (P = 0.04) (Table 1), and there was a weak association of TB infection with increased crowding (P = 0.09).
There was little evidence that the association between TB infection and SEP was confounded by any of the confounding factors considered (Model 2, Table 2). There was also little evidence that the hypothesized mediating variables explained any part of the association between TB infection and SEP (as suggested by the unchanged value of the OR of SEP in the multivariable models, including SEP, age, gender, area of residence, and each of the potential mediators considered) (Model 3, Table 2). Crowding showed no mediation effect, but when included in the same model, became significantly associated with TB infection independently from SEP (OR = 1.8, 95% CI: 0.9–3.9 and OR = 3.0, 95% CI: 1.2–7.4 for crowded and very crowded households, P = 0.01, compared with less crowded ones) (Table 2). When the relationship between crowding and SEP was explored further, data showed that prevalence of TB infection increased with SEP across all levels of crowding (Figure 3B).
Table 2.
Testing the conceptual framework: Association between tuberculosis infection and socioeconomic position in multivariable models accounting for confounding and mediating effect of risk factors for tuberculosis infection (N. 84 Quantiferon negative and N. 83 Quantiferon positive)
| Adjusted odds ratio (95% CI) |
P value | ||
|---|---|---|---|
| Model 1* | |||
| SEP index | Less poor | 0.4 (0.1–1.1) | 0.01 |
| Poor | 0.4 (0.2–0.8) | ||
| Very poor | 1.0 | ||
| Model 2† | |||
| SEP index | Less poor | 0.3 (0.1–1.0) | 0.01 |
| Poor | 0.4 (0.2–0.8) | ||
| Very poor | 1.0 | ||
| Model 3‡ | |||
| SEP index | Less poor | 0.4 (0.1–1.0) | 0.02 |
| Poor | 0.4 (0.2–0.8) | ||
| Very poor | 1.0 | ||
| Alcohol consumption | No | 1.0 | 0.6 |
| Yes | 1.2 (0.6–2.4) | ||
| SEP index | Less poor | 0.4 (0.1–1.0) | 0.02 |
| Poor | 0.4 (0.2–0.8) | ||
| Very poor | 1.0 | ||
| Smoking | No | 1.0 | 0.7 |
| Yes | 1.2 (0.4–3.4) | ||
| SEP index | Less poor | 0.2 (0.08–0.9) | 0.01 |
| Poor | 0.4 (0.2–0.9) | ||
| Very poor | 1.0 | ||
| Known contact with TB | No | 1.0 | 0.5 |
| Yes | 1.4 (05–3.3) | ||
| SEP index | Less poor | 0.5 (0.2–1.5) | 0.09 |
| Poor | 0.4 (0.2–0.9) | ||
| Very poor | 1.0 | ||
| Weekly number of meals containing proteins |
0 | 1.0 | 0.2 |
| 1 | 2.0 (0.8–4.9) | ||
| 2 | 1.2 (0.4–3.3) | ||
| > 2 | 2.1 (0.8–5.9) | ||
| SEP index | Less poor | 0.3 (0.09–0.8) | 0.005 |
| Poor | 0.4 (0.2–0.8) | ||
| Very poor | 1.0 | ||
| Crowding | Less crowded | 1.0 | 0.01§ |
| Crowded | 1.9 (0.9–4.0) | ||
| More crowded | 3.0 (1.2–7.4) |
Model 1: Socioeconomic position (SEP) adjusted for demographic variables (i.e., gender, age, and area of residence).
Model 2: SEP adjusted for potential confounding factors (i.e., bacilli Calmette-Guérin (BCG) vaccination status, human immunodeficiency virus (HIV) infection status)
Model 3: SEP adjusted demographic variables and each potential mediator. A reduction in the odds ratio (OR) of SEP upon inclusion of each previous variable is suggestive of mediation.
Test for trend.
Association between socioeconomic position proxies and TB infection
We also explored the association between each of the SEP proxies and TB infection after adjustment for age, gender, and area of residence. Crowding was also included in each model as the only other variable significantly associated with TB infection. Because of the high number of variables considered in the analysis, Table 3 presents the results only for SEP variables associated with TB infection at a value of P ≤ 0.2 in the univariable analysis. Of the four domains considered, variables from the domains “food availability and vulnerability” (e.g., weekly number of meals containing proteins and number of coping strategies) and “access to infrastructures” (e.g., having electricity, walking distance from the market) were significantly associated with TB infection. By contrast, variables considered as indicators of “human resources” and “housing quality” were not generally associated with TB infection. Consistent with the analysis based on the SEP composite index, prevalence of TB infection tended to be higher in wealthier categories for each of the SEP proxy analyzed, and for several individual SEP proxies this association between relative wealth and TB infection reached statistical significance.
Table 3.
Association between tuberculosis (TB) infection and proxies* of socioeconomic position (N. 84 Quantiferon negative and N. 83 Quantiferon positive)
| Exposures | Quantiferon positives n/N (%) |
Unadjusted Odds ratio (95% CI) |
P value | Adjusted Odds ratio (95% CI) † |
P value | |
|---|---|---|---|---|---|---|
| Human resources | ||||||
| Occupation of the head of the household |
Self used | 33/62 (53.2) | 2.3 (0.6–8.3) | 0.2 | 4.1 (0.9–18.7) | 0.07 |
| Used | 46/93 (49.5) | 1.9 (0.6–6.9) | 3.9 (0.6–17.0) | |||
| Unemployed | 4/12 (3.3) | 1.0 | 1.0 | |||
| Food availability and vulnerability | ||||||
| Weekly number of meals containing proteins† |
0 | 12/34 (35.3) | 1.0 | 0.2 | 1.0 | 0.04§ |
| 1 | 23/47 (48.9) | 1.7 (0.7–4.3) | 1.9 (0.7–5.1) | |||
| 2 | 23/40 (57.5) | 2.5 (1.0–6.3) | 3.2 (1.1–9.0) | |||
| 3 | 25/46 (54.3) | 2.2 (0.9–5.4) | 2.9 (1.0–8.1) | |||
| Daily number of meals in the household |
≤ 2 | 21/49 (42.9) | 1.0 | 0.2 | 1.0 | 0.2 |
| > 2 | 62/118 (52.5) | 1.5 (0.7–2.9) | 1.5 (0.7 3.1) | |||
| Number of coping strategies† | > 3 | 21/51 (41.2) | 1.0 | 0.07 | 1.0 | 0.03§ |
| 1–3 | 25/55 (45.4) | 1.2 (0.5–2.6) | 1.3 (0.6–3.0) | |||
| 0 | 37/61 (60.7) | 2.2 (1.0–4.7) | 2.5 (1.1–5.9) | |||
| Assets ownership and housing quality | ||||||
| Having animals | Yes | 19/48 (39.6) | 1.0 | 0.09 | 1.0 | 0.1 |
| No | 64/119(53.8) | 1.8 (0.9–3.5) | 0.5 (0.2–1.2) | |||
| Floor material† | Dirt/earth | 28/64 (43.7) | 1.0 | 0.2 | 1.0 | 0.2 |
| Cement | 55/103 (53.4) | 1.5 (0.8–2.7) | 1.7 (0.8–3.5) | |||
| Roof material† | Grass | 10/20 (50.0) | 1.0 | 0.08 | 1.0 | 0.1 |
| Iron sheet | 30/74 (40.5) | 0.7 (0.2–1.8) | 0.7 (0.2–2.2) | |||
| Asbestos | 43/73 (58.9) | 1.4 (0.5–3.9) | 1.6 (0.5–5.3) | |||
| Type of water supply† | Piped outside house | 52/109 (47.7) | 1.0 | 0.1 | 1.0 | 0.7 |
| Piped inside house | 30/57 (52.6) | 1.2 (0.6–2.3) | 1.1 (0.6–2.4) | |||
| Type of water sanitation | Latrines | 67/143 (46.8) | 1.0 | 0.07 | 1.0 | 0.08 |
| Flush toilets/other | 16/24 (66.7) | 2.3 (0.9–5.6) | 2.3 (0.9–5.9) | |||
| Access to infrastructures and facilities | ||||||
| Having electricity† | No | 49/112 (43.7) | 1.0 | 0.03 | 1.0 | 0.03 |
| Yes | 34/55 (61.8) | 2.1 (1.1–4.0) | 2.2 (1.1–4.6) | |||
| Walking distance from the market (minutes)† |
> 15 | 31/80 (38.7) | 1.0 | 0.07 | 1.0 | < 0.001 |
| 0–15 | 52/87 (60.0) | 2.3 (1.2–4.6) | 2.7 (1.3–5.6) |
SEP proxies are grouped by dimension considered in the conceptual framework.
Variables included in the principal component analysis.
Multivariable analysis including gender, age group, area of residence, and crowding.
Test for trend.
DISCUSSION
This study describes the association between SEP and TB infection using a quantitative, validated method for measuring SEP and a more specific test for TB infection (Quantiferon) in a general population sample.
Despite TB being historically associated with deprivation, in this study TB infection was more frequent among individuals from households with relatively higher SEP. This observation was confirmed when looking at single SEP covariates: TB infection was consistently associated with markers of higher SEP.
In this study the risk factors traditionally researched in tuberculosis epidemiology were not significantly associated with TB infection. It was therefore not surprising that we found little evidence that these variables mediated the association between SEP and TB infection. It is unclear why these factors were not associated with risk of TB in our study. A reason could be that in this study we were able to detect that part of TB transmission occurring among relatively wealthier people and therefore explained by risk factors associated with higher SEP.
Although these risk factors have not been yet identified in this study, a possible interpretation of our results comes from the analysis of indicators of SEP grouped into different conceptual domains: we found that the strongest association was observed for SEP proxies linked to “food security and vulnerability” and “access to infrastructures and facilities,” such as having electricity and living closer to infrastructures. These last two variables describe characteristics of the local context rather than of households or individuals.
Historically, the industrial revolution in the 19th Century in Europe and the associated urbanization were accompanied by an initial increase in TB disease and death as a result of TB. 34–38 One possible dynamic underlying our findings is that in modern-day developing countries relatively wealthier living conditions could increase TB infection: living in apparently better equipped households (e.g., having electricity) made with more solid materials is a marker of wealth, but it could also mean poor air quality if houses are built without ensuring adequate ventilation. Despite the differences in setting and study design, analogous conclusions can be found in two other studies where TB transmission occurrence was more frequent in newer apartment buildings, located in blocks with high residential density, characterized by inadequate ventilation, even after adjustment for key socio-demographic factors. 39,40
Similar interpretation can be given to the findings on the distance from main infrastructures: households closer to facilities are likely to be wealthier, but also likely to reflect a more urban-type setting, characterized by greater population density and a higher chance of human interaction, fostering TB transmission. This has been demonstrated in previous studies, showing that in high TB prevalence settings, especially high densely populated settings like this one, extensive TB transmission can occur via complex social networks that are likely to be as important as households contact in maintaining transmission.41,42
One may argue that the pattern observed in this study reflects the higher prevalence of HIV, and thus perhaps of TB infection, in relatively more educated individuals that has been described in Zambia in previous studies. 43–45 However, we did not observe a higher prevalence of infection among HIV-positive individuals; furthermore, in this study population HIV was not associated with higher SEP (data not shown). Our study also confirmed the importance of crowding in the epidemiology of tuberculosis.
As in other studies, 46–48 our data suggest a strong independent effect of both crowding and SEP on the risk of TB infection. Crowding and SEP perhaps represent two key forces, acting in different contexts and explaining different cases of TB infection: 1) those infected at household level through overcrowding in poor households, and 2) those infected at community level because of dynamics reflecting higher SEP described previously. Thus, there may be aspects of SEP that act over and above the role played by household overcrowding in fostering TB transmission.
The study had potential limitations. The small sample size, imposed by the nested design in the case control study, limited the power of the study. We therefore advise caution in the interpretation of our findings. However, because low study power most seriously increases the potential for false negative conclusions in studies, it does not provide a highly plausible explanation for the unusual and interesting pattern of infection we report here.
The people who participated in the study were more likely to come from the urban area compared with the rural one. This raises issues on the generalizability of these findings and, most importantly, about the possibility of selection biases (as people living in urban areas are generally wealthier compared with the residents in urban ones). Nonetheless, once the effect of the area of residence was taken into account, we found no significant difference in terms of demographics, SEP, any risk factors increasing the likelihood of TB infection (i.e., known contact with tuberculosis cases), or immune system impairment and therefore Quantiferon response (i.e., HIV status, food intake, alcohol consumption) between people who gave blood and those who did not.
It has been suggested that malnutrition may reduce the expression of INF-γ and other mycobactericidal substances. 49,50 If this were to be the case, our study may have missed infected individuals among the poor (i.e., false negatives) and may have been more likely to detect TB infection among better nourished, wealthier individuals potentially biasing our results. However, a better immunologic response probably can only help in providing an interpretable result, but does not necessarily translate into a positive Quantiferon result. Most importantly, we have shown that almost all markers of high SEP were associated with higher risk for TB infection, suggesting that the false negative bias is unlikely to be relevant.
Finally, the importance of previous contact with a TB case in the household (considered to be one of the most important risk factor for TB infection), 51–56 could have been underestimated as our data were based only on respondent recall.
In conclusion, our findings suggest that unexpectedly, higher SEP, rather than lower, was associated with TB infection in two Zambian communities.
None of the traditional risk factor variables that we explored appeared to mediate this association, suggesting that in this setting TB transmission may occur through the exposure to risk factors for TB other than those traditionally explored and associated with poverty, such as alcohol consumption, inadequate nutrition, smoking, and contact with a TB case. It is possible that, especially in urban settings, higher SEP is associated with housing characteristics that reduce ventilation and life-styles that increase social mixing and therefore the likelihood of contact between cases and susceptible people.
Further studies are needed to test these hypotheses and to verify whether even increasing the household SEP may not be sufficient to reduce the risk of TB infection, if it is not accompanied by the improvement of community living conditions (including better housing quality, crowding reduction, and access to public services) and a strong TB control program.
Contributor Information
Delia Boccia, Infectious Diseases Epidemiology Unit, Department of Epidemiology and Population Health, London School of Hygiene and Tropical Medicine, Keppel Street, London, WC1 E 7HT, United Kingdom, Tel: +44(0)20-7958-8145, Fax: +44(0)20-7612-7860, delia.boccia@lshtm.ac.uk..
James Hargreaves, Infectious Diseases Epidemiology Unit, Department of Epidemiology and Population Health, London School of Hygiene and Tropical Medicine, Keppel Street, London, WC1E 7HT, United Kingdom, Tel: +44(0)20-7927-2955, Fax: +44(0)20-7612-7860, james.hargreaves@lshtm.ac.uk..
Helen Ayles, Clinical Research Unit, Department of Infectious and Tropical Diseases, London School of Hygiene and Tropical Medicine, Keppel Street, London, WC1E 7HT, United Kingdom, ZAMBART Project, Ridgeway Campus, University of Zambia, Lusaka, Zambia, Tel: +260-1-254710, Fax: +260-1-254710, helen@zambart.org.zm..
Katherine Fielding, Infectious Diseases Epidemiology Unit, Department of Epidemiology and Population Health, London School of Hygiene and Tropical Medicine, Keppel Street, London, WC1E 7HT, United Kingdom, Tel: +44(0)20-7927-2889, Fax: +44(0)20-7636-8739, katherine.fielding@lshtm.ac.uk..
Musonda Simwinga, ZAMBART Project, Ridgeway Campus, University of Zambia, Lusaka, Zambia, Tel: +260-1-254710, Fax: +260-1-254710, musonda@zambart.org.zm..
Peter Godfrey-Faussett, Clinical Research Unit, Department of Infectious and Tropical Diseases, London School of Hygiene and Tropical Medicine, Keppel Street, London, WC1E 7HT, United Kingdom, Tel: +44(0)20-7958-8127, Fax: +44(0)20-7612-7860, peter.godfrey-faussett@lshtm.ac.uk..
REFERENCES
- 1.Dubos RJ. The White Plague: Tuberculosis, Man, and Society. Rutgers University Press; Piscataway, NJ: 1987. [Google Scholar]
- 2.Bank W. World Development Indicators. The World Bank; Washington, DC: 2000. [Google Scholar]
- 3.WHO . Addressing Poverty in TB Control: Options for National TB Control Programmes. WHO; Geneva: 2005. [Google Scholar]
- 4.Cantwell MF, McKenna MT, McCray E, Onorato IM. Tuberculosis and race/ethnicity in the United States: impact of socioeconomic status. Am J Respir Crit Care Med. 1998;157:1016–1020. doi: 10.1164/ajrccm.157.4.9704036. [DOI] [PubMed] [Google Scholar]
- 5.CDC Prevention and control of tuberculosis in U.S. communities with at-risk minority populations. Recommendations of the Advisory Council for the Elimination of Tuberculosis. MMWR Recomm Rep. 1992;41:1–11. [PubMed] [Google Scholar]
- 6.Hanson C. Tuberculosis, Poverty and Inequity: A Review of the Literature and Discussion of Issues. World Bank; Washington, DC: 2002. [Google Scholar]
- 7.Kuemmerer JM, Comstock GW. Sociologic concomitants of tuberculin sensitivity. Am Rev Respir Dis. 1967;96:885–892. doi: 10.1164/arrd.1967.96.5.885. [DOI] [PubMed] [Google Scholar]
- 8.Spence DP, Hotchkiss J, Williams CS, Davies PD. Tuberculosis and poverty. BMJ. 1993;307:759–761. doi: 10.1136/bmj.307.6907.759. [DOI] [PMC free article] [PubMed] [Google Scholar]
- 9.Bhatti N, Law MR, Morris JK, Halliday R, Moore-Gillon J. Increasing incidence of tuberculosis in England and Wales: a study of the likely causes. BMJ. 1995;310:967–969. doi: 10.1136/bmj.310.6985.967. [DOI] [PMC free article] [PubMed] [Google Scholar]
- 10.Lienhardt C, Fielding K, Sillah J, Tunkara A, Donkor S, Manneh K, Warndorff D, McAdam KP, Bennett S. Risk factors for tuberculosis infection in sub-Saharan Africa: a contact study in The Gambia. Am J Respir Crit Care Med. 2003;168:448–455. doi: 10.1164/rccm.200212-1483OC. [DOI] [PubMed] [Google Scholar]
- 11.Claessens NJ, Gausi FF, Meijnen S, Weismuller MM, Salaniponi FM, Harries AD. High frequency of tuberculosis in households of index TB patients. Int J Tuberc Lung Dis. 2002;6:266–269. [PubMed] [Google Scholar]
- 12.Schoeman JH, Westaway MS, Neethling A. The relationship between socioeconomic factors and pulmonary tuberculosis. Int J Epidemiol. 1991;20:435–440. doi: 10.1093/ije/20.2.435. [DOI] [PubMed] [Google Scholar]
- 13.Sanchez-Perez H, Flores-Hernandez J, Jansa J, Cayla J, Martin-Mateo M. Pulmonary tuberculosis and associated factors in areas of high levels of poverty in Chiapas, Mexico. Int J Epidemiol. 2001;30:386–393. doi: 10.1093/ije/30.2.386. [DOI] [PubMed] [Google Scholar]
- 14.Glynn JR, Warndorff DK, Malema SS, Mwinuka V, Ponnighaus JM, Crampin AC, Fine PE. Tuberculosis: associations with HIV and socioeconomic status in rural Malawi. Trans R Soc Trop Med Hyg. 2000;94:500–503. doi: 10.1016/s0035-9203(00)90065-8. [DOI] [PubMed] [Google Scholar]
- 15.Tekkel M, Rahu M, Loit HM, Baburin A. Risk factors for pulmonary tuberculosis in Estonia. Int J Tuberc Lung Dis. 2002;6:887–894. [PubMed] [Google Scholar]
- 16.Coker R, McKee M, Atun R, Dimitrova B, Dodonova E, Kuznetsov S, Drobniewski F. Risk factors for pulmonary tuberculosis in Russia: case-control study. BMJ. 2006;232:85–87. doi: 10.1136/bmj.38684.687940.80. [DOI] [PMC free article] [PubMed] [Google Scholar]
- 17.Mangtani P, Jolley DJ, Watson JM, Rodrigues LC. Socioeconomic deprivation and notification rates for tuberculosis in London during 1982–91. BMJ. 1995;310:963–966. doi: 10.1136/bmj.310.6985.963. [DOI] [PMC free article] [PubMed] [Google Scholar]
- 18.Farhat M, Greenaway C, Pai M, Menzies D. False-positive tuberculin skin tests: what is the absolute effect of BCG and non-tuberculous mycobacteria? Int J Tuberc Lung Dis. 2006;10:1192–1204. [PubMed] [Google Scholar]
- 19.Villate JI, Ibanez B, Cabriada V, Pijoan JI, Taboada J, Urkaregi A. Analysis of latent tuberculosis and Mycobacterium avium infection data using mixture models. BMC Public Health. 2006;6:240. doi: 10.1186/1471-2458-6-240. [DOI] [PMC free article] [PubMed] [Google Scholar]
- 20.Kerr-Pontes LR, Barreto ML, Evangelista CM, Rodrigues LC, Heukelbach J, Feldmeier H. Socioeconomic, environmental, and behavioural risk factors for leprosy in North-east Brazil: results of a case-control study. Int J Epidemiol. 2006;35:994–1000. doi: 10.1093/ije/dyl072. [DOI] [PubMed] [Google Scholar]
- 21.Kerr-Pontes LR, Montenegro AC, Barreto ML, Werneck GL, Feldmeier H. Inequality and leprosy in Northeast Brazil: an ecological study. Int J Epidemiol. 2004;33:262–269. doi: 10.1093/ije/dyh002. [DOI] [PubMed] [Google Scholar]
- 22.Raghunathan PL, Whitney EA, Asamoa K, Stienstra Y, Taylor TH, Jr, Amofah GK, Ofori-Adjei D, Dobos K, Guarner J, Martin S, Pathak S, Klutse E, Etuaful S, van der Graaf WT, van der Werf TS, King CH, Tappero JW, Ashford DA. Risk factors for Buruli ulcer disease (Mycobacterium ulcerans infection): results from a case-control study in Ghana. Clin Infect Dis. 2005;40:1445–1453. doi: 10.1086/429623. [DOI] [PubMed] [Google Scholar]
- 23.Engel A, Roberts J. Tuberculin skin test reaction among adults 25–74 years, United States, 1971–72. Vital Health Stat 11. 1977;204:1–40. [PubMed] [Google Scholar]
- 24.Reichman LB, O’Day R. Tuberculous infection in a large urban population. Am Rev Respir Dis. 1978;117:705–712. doi: 10.1164/arrd.1978.117.4.705. [DOI] [PubMed] [Google Scholar]
- 25.Pelly TF, Santillan CF, Gilman RH, Cabrera LZ, Garcia E, Vidal C, Zimic MJ, Moore DA, Evans CA. Tuberculosis skin testing, anergy and protein malnutrition in Peru. Int J Tuberc Lung Dis. 2005;9:977–984. [PMC free article] [PubMed] [Google Scholar]
- 26.Filmer D, Pritchett LH. Estimating wealth effects without expenditure data–or tears: an application to educational enrollments in states of India. Demography. 2001;38:115–132. doi: 10.1353/dem.2001.0003. [DOI] [PubMed] [Google Scholar]
- 27.Bartholomew DJSF, Moustaki I, Galbraith JI. Principal Component Analysis: The Analysis and Interpretation of Multivariate Data for Social Scientists. CRC; Chapman & Hall: 2002. pp. 115–142. [Google Scholar]
- 28.CGAP . Assessing the Relative Poverty of Microfinance Clients: A CGAP Operational Tool. CGAP; Washington, DC: 2002. [Google Scholar]
- 29.Lalvani A. Diagnosing tuberculosis infection in the 21st century: new tools to tackle an old enemy. Chest. 2007;131:1898–1906. doi: 10.1378/chest.06-2471. [DOI] [PubMed] [Google Scholar]
- 30.Pai M, Kalantri S, Dheda K. New tools and emerging technologies for the diagnosis of tuberculosis: part I. Latent tuberculosis. Expert Rev Mol Diagn. 2006;6:413–422. doi: 10.1586/14737159.6.3.413. [DOI] [PubMed] [Google Scholar]
- 31.World Health Organization . WHO Report 2008. Geneva, Switzerland: 2008. Global tuberculosis control: surveillance, planning, financing. [Google Scholar]
- 32.LCMS . Living Conditions Monitoring Survey Report, 2002–2003. Central Statistical Office, Republic of Zambia; Lusaka, Zambia: Nov, 2004. [Google Scholar]
- 33.Victora CG, Huttly SR, Fuchs SC, Olinto MT. The role of conceptual frameworks in epidemiological analysis: a hierarchical approach. Int J Epidemiol. 1997;26:224–227. doi: 10.1093/ije/26.1.224. [DOI] [PubMed] [Google Scholar]
- 34.Kass EH. Infectious diseases and social change. J Infect Dis. 1971;123:110–114. doi: 10.1093/infdis/123.1.110. [DOI] [PubMed] [Google Scholar]
- 35.Springett VH. An interpretation of statistical trends in tuberculosis. Lancet. 1952;1:575–580. doi: 10.1016/s0140-6736(52)90096-2. [DOI] [PubMed] [Google Scholar]
- 36.Hunter JM, Thomas MO. Hypothesis of leprosy, tuberculosis and urbanization in Africa. Soc Sci Med. 1984;19:27–57. doi: 10.1016/0277-9536(84)90134-5. [DOI] [PubMed] [Google Scholar]
- 37.Enarson DA, Wang JS, Dirks JM. The incidence of active tuberculosis in a large urban area. Am J Epidemiol. 1989;129:1268–1276. doi: 10.1093/oxfordjournals.aje.a115246. [DOI] [PubMed] [Google Scholar]
- 38.Drucker E, Alcabes P, Bosworth W, Sckell B. Childhood tuberculosis in the Bronx, New York. Lancet. 1994;343:1482–1485. doi: 10.1016/s0140-6736(94)92588-7. [DOI] [PubMed] [Google Scholar]
- 39.Acevedo-Garcia D. Zip code-level risk factors for tuberculosis: neighborhood environment and residential segregation in New Jersey, 1985–1992. Am J Public Health. 2001;91:734–741. doi: 10.2105/ajph.91.5.734. [DOI] [PMC free article] [PubMed] [Google Scholar]
- 40.Wanyeki I, Olson S, Brassard P, Menzies D, Ross N, Behr M, Schwartzman K. Dwellings, crowding, and tuberculosis in Montreal. Soc Sci Med. 2006;63:501–511. doi: 10.1016/j.socscimed.2005.12.015. [DOI] [PubMed] [Google Scholar]
- 41.Klovdahl AS, Graviss EA, Yaganehdoost A, Ross MW, Wanger A, Adams GJ, Musser JM. Networks and tuberculosis: an undetected community outbreak involving public places. Soc Sci Med. 2001;52:681–694. doi: 10.1016/s0277-9536(00)00170-2. [DOI] [PubMed] [Google Scholar]
- 42.McElroy PD, Rothenberg RB, Varghese R, Woodruff R, Minns GO, Muth SQ, Lambert LA, Ridzon R. A network-informed approach to investigating a tuberculosis outbreak: implications for enhancing contact investigations. Int J Tuberc Lung Dis. 2003;7:S486–S493. [PubMed] [Google Scholar]
- 43.Michelo C, Sandoy IF, Dzekedzeke K, Siziya S, Fylkesnes K. Steep HIV prevalence declines among young people in selected Zambian communities: population-based observations (1995–2003) BMC Public Health. 2006;6:279. doi: 10.1186/1471-2458-6-279. [DOI] [PMC free article] [PubMed] [Google Scholar]
- 44.Fylkesnes K, Musonda RM, Kasumba K, Ndhlovu Z, Mluanda F, Kaetano L, Chipaila CC. The HIV epidemic in Zambia: socio-demographic prevalence patterns and indications of trends among childbearing women. AIDS. 1997;11:339–345. doi: 10.1097/00002030-199703110-00012. [DOI] [PubMed] [Google Scholar]
- 45.Fylkesnes K, Musonda RM, Sichone M, Ndhlovu Z, Tembo F, Monze M. Declining HIV prevalence and risk behaviours in Zambia: evidence from surveillance and population-based surveys. AIDS. 2001;15:907–916. doi: 10.1097/00002030-200105040-00011. [DOI] [PubMed] [Google Scholar]
- 46.Clark M, Riben P, Nowgesic E. The association of housing density, isolation and tuberculosis in Canadian First Nations communities. Int J Epidemiol. 2002;31:940–945. doi: 10.1093/ije/31.5.940. [DOI] [PubMed] [Google Scholar]
- 47.Barker RD, Millard FJ, Malatsi J, Mkoana L, Ngoatwana T, Agarawal S, de Valliere S. Traditional healers, treatment delay, performance status and death from TB in rural South Africa. Int J Tuberc Lung Dis. 2006;10:670–675. [PubMed] [Google Scholar]
- 48.Elender F, Bentham G, Langford I. Tuberculosis mortality in England and Wales during 1982–1992: its association with poverty, ethnicity and AIDS. Soc Sci Med. 1998;46:673–681. doi: 10.1016/s0277-9536(97)00178-0. [DOI] [PubMed] [Google Scholar]
- 49.van Lettow M, West CE, van der Meer JW, Wieringa FT, Semba RD. Low plasma selenium concentrations, high plasma human immunodeficiency virus load and high interleukin-6 concentrations are risk factors associated with anemia in adults presenting with pulmonary tuberculosis in Zomba district, Malawi. Eur J Clin Nutr. 2005;59:526–532. doi: 10.1038/sj.ejcn.1602116. [DOI] [PubMed] [Google Scholar]
- 50.Macallan DC. Malnutrition in tuberculosis. Diagn Microbiol Infect Dis. 1999;34:153–157. doi: 10.1016/s0732-8893(99)00007-3. [DOI] [PubMed] [Google Scholar]
- 51.Rathi SK, Akhtar S, Rahbar MH, Azam SI. Prevalence and risk factors associated with tuberculin skin test positivity among household contacts of smear-positive pulnionary tuberculosis cases in Umerkot, Pakistan. Int J Tuberc Lung Dis. 2002;6:851–857. [PubMed] [Google Scholar]
- 52.Lienhardt C. From exposure to disease: the role of environmental factors in susceptibility to and development of tuberculosis. Epidemiol Rev. 2001;23:288–301. doi: 10.1093/oxfordjournals.epirev.a000807. [DOI] [PubMed] [Google Scholar]
- 53.Kenyon TA, Creek T, Laserson K, Makhoa M, Chimidza N, Mwasekaga M, Tappero J, Lockman S, Moeti T, Binkin N. Risk factors for transmission of Mycobacterium tuberculosis from HIV-infected tuberculosis patients, Botswana. Int J Tuberc Lung Dis. 2002;6:843–850. [PubMed] [Google Scholar]
- 54.Tornee S, Kaewkungwal J, Fungladda W, Silachamroon U, Akarasewi P, Sunakorn P. Risk factors for tuberculosis infection among household contacts in Bangkok, Thailand. Southeast Asian J Trop Med Public Health. 2004;35:375–383. [PubMed] [Google Scholar]
- 55.Singh M, Mynak ML, Kumar L, Mathew JL, Jindal SK. Prevalence and risk factors for transmission of infection among children in household contact with adults having pulmonary tuberculosis. Arch Dis Child. 2005;90:624–628. doi: 10.1136/adc.2003.044255. [DOI] [PMC free article] [PubMed] [Google Scholar]
- 56.Sinfield R, Nyirenda M, Haves S, Molyneux EM, Graham SM. Risk factors for TB infection and disease in young childhood contacts in Malawi. Ann Trop Paediatr. 2006;26:205–213. doi: 10.1179/146532806X120291. [DOI] [PubMed] [Google Scholar]