

Abstract
Hippocampal population bursts (“sharp wave–ripples”) occur during rest and slow-wave sleep and are thought to be important for memory consolidation. The cellular mechanisms involved are incompletely understood. Here we investigated the cellular mechanisms underlying the initiation of sharp waves using a hippocampal slice model. To this end, we used a combination of field recordings with planar multielectrode arrays and whole-cell patch-clamp recordings of individual anatomically identified pyramidal neurons and interneurons. We found that GABAA receptor-mediated inhibition is necessary for sharp wave generation. Moreover, the activity of individual perisomatic-targeting interneurons can both suppress, and subsequently enhance, the local generation of sharp waves. Finally, we show that this is achieved by the tight control of local excitation and inhibition by perisomatic-targeting interneurons. These results suggest that perisomatic-targeting interneurons assist in selecting the subset of pyramidal neurons that initiate each hippocampal sharp wave–ripple.
Introduction
Burst patterns in the hippocampal electroencephalogram (EEG) include sharp wave–ripples (O'Keefe and Nadel, 1978; Buzsáki, 1986) and epileptiform discharges (Jefferys, 1994). Sharp waves (0.1–3 Hz) and associated ripples (∼200 Hz), which occur during phases of rest and slow-wave sleep, can be observed in the hippocampal EEG in freely moving rats (O'Keefe and Nadel, 1978; Buzsáki, 1986). They have been implicated in the reactivation of spike sequences in both forward (Skaggs and McNaughton, 1996; Lee and Wilson, 2002) and reverse (Foster and Wilson, 2006; Csicsvari et al., 2007; Diba and Buzsáki, 2007) order and could facilitate the strengthening of memories within the hippocampus during exploration (O'Neill et al., 2006) as well as mediate off-line memory transfer to extrahippocampal regions for long-term storage (Buzsáki, 1989). Sharp wave–ripples are thought to be the result of synchronous bursts of action potentials in a subset of hippocampal pyramidal neurons (Buzsáki, 1986; Csicsvari et al., 2000), initiated in the CA3 subfield by pyramidal neurons with strong synaptic interconnections (Buzsáki and Chrobak, 1995) or recent place-related firing (Csicsvari et al., 2007; Diba and Buzsáki, 2007). Hippocampal CA3 also contains both feedforward and feedback inhibitory circuits, but it is unclear what role they have during sharp wave–ripples.
Studies of epileptiform discharges in vitro, under conditions of reduced or absent inhibition (Miles and Wong, 1983; de la Prida et al., 2006) or high K+ concentration (Staley et al., 1998), have revealed detailed mechanisms responsible for the initiation of pathological population bursts. A single CA3 pyramidal neuron can initiate an epileptiform burst (Miles and Wong, 1983) by recruiting sufficient pyramidal neurons to exceed a threshold for burst initiation (de la Prida et al., 2006). Recruitment of a population of pyramidal neurons is suggested to be the result of mutual synaptic excitation which is facilitated in a disinhibited recurrent network (Traub and Wong, 1982; Korn et al., 1987; McBain, 1995). The detailed mechanisms underlying the initiation of hippocampal population burst activity under conditions with intact inhibition are less well understood. Although synaptic excitation, synaptic inhibition, and electrical coupling have all been implicated (Maier et al., 2002, 2003; Nimmrich et al., 2005), their relative importance and the details of their involvement are unknown. In particular, the mechanism of initiation of sharp waves in CA3 has not been investigated in detail.
We set out to investigate the cellular mechanisms underlying the initiation of CA3 sharp wave–ripples using a hippocampal slice preparation in which such population events occur spontaneously (Kubota et al., 2003). We found that GABAA receptor-mediated inhibition is necessary for sharp wave–ripple generation. Furthermore, we show that spiking activity of an individual perisomatic-targeting interneuron (PTI) can both suppress and subsequently enhance local sharp wave-ripple generation. Finally, we show that this postinhibitory enhancement is mediated by a transient increase in excitation over inhibition in the network. These results suggest a new role for perisomatic-targeting interneurons in controlling the local initiation of sharp waves by selectively suppressing and subsequently enhancing the recruitment of a subpopulation of pyramidal neurons.
Materials and Methods
Slice preparation.
Transverse hippocampal slices (400 μm) were prepared from the ventral part of the hippocampus of postnatal day 14–24 Wistar rats. Rats were anesthetized with isoflurane and decapitated using procedures licensed under the Animals (Scientific Procedures) Act (1986). Slicing was performed in artificial CSF (ACSF) containing the following (in mm): 124 NaCl, 3 KCl, 1.25 KH2PO4, 5 MgSO4, 3.4 CaCl2, 26 NaHCO3, and 10 glucose, pH 7.2–7.4, bubbled with carbogen gas (95% O2/5% CO2). Slices were immediately transferred to an interface chamber and maintained at room temperature for 1 h between humidified carbogen gas and ACSF containing the following (in mm): 124 NaCl, 3 KCl, 1.25 KH2PO4, 1 MgSO4, 3 CaCl2, 26 NaHCO3, and 10 glucose, pH 7.2–7.4. Slices were then mounted on 8 × 8 planar multielectrode arrays (electrode size, 50 μm × 50 μm; interpolar distance, 150 μm; Panasonic MED-P5155, Tensor Biosciences), and maintained in submerged condition at 32°C, while superfused at 6 ml/min (using a peristaltic pump) with ACSF of the same composition as that used for storage, bubbled with 95% O2/5% CO2 (Hajos et al., 2009).
Recording.
Spontaneous field potentials from 62–64 recording electrodes of the planar multielectrode arrays were acquired at 5 kHz, using the Panasonic MED64 system (Tensor Biosciences). Whole-cell current-clamp and voltage-clamp recordings from single or pairs of CA3 pyramidal neurons and interneurons were performed with glass pipettes, pulled from standard wall borosilicate glass capillaries containing the following for whole-cell current clamp: 110 mm potassium gluconate, 40 mm HEPES, 2 mm ATP-Mg, 0.3 mm Na-GTP, 4 mm NaCl, and 4 mg/ml biocytin (pH 7.2–7.3; osmolarity, 290–300 mosmol/L); and containing the following for whole-cell voltage-clamp: 120 mm cesium gluconate, 40 mm HEPES, 4 mm NaCl, 2 mm ATP-Mg, 0.3 mm Na-GTP, 0.2 mm QX-314, and 4 mg/ml biocytin (pH 7.2–7.3; osmolarity, 290–300 mosmol/L). Cells were selected using differential interference contrast microscopy (Mann and Paulsen, 2006). Every paired recording analyzed and reported is a unique pair. Current-clamp and voltage-clamp recordings were made using a Multiclamp 700B amplifier (Axon Instruments, Molecular Devices), filtered at 2 kHz and acquired using two channels of the Panasonic MED64 system at 5 kHz.
In a subset of early experiments slices were kept in an “Oslo”-style interface chamber (Fine Science Tools) at 32°C and recordings were made in interface conditions using an Axoclamp-2A amplifier (Molecular Devices), filtered at 2 kHz, and acquired at 10 kHz using a CED 1401 analog/digital board (Cambridge Electronic Design). The results from these experiments are reported in Figure 1, Table 1, and supplemental Figure 1 (available at www.jneurosci.org as supplemental material).
Figure 1.

Sharp wave-ripples in vitro. A, Schematic of a hippocampal slice showing the location of field recording electrodes in CA3 and CA1. Colored lines represent the locations at which axonal fibers were cut for experiments reported in C. B, Spontaneous network events were observed in hippocampal CA3 (left) and CA1 (right). These sharp waves (high pass filtered at 0.1 Hz; top), recorded in the pyramidal cell layer were superimposed by high-frequency oscillations (bandpass filtered between 80 and 250 Hz; middle), with both components apparent in the wavelet transform (normalized Morlet wavelet; ω0 = 6; warmer colors representing increasing magnitude; bottom). C, A cut between CA3 and CA1 abolished all sharp wave-ripple activity in CA1 without affecting those in CA3 (incidence: control, 1.56 ± 0.10 Hz; after cut, 1.60 ± 0.11 Hz; amplitude: control, 119 ± 17 μV; after cut, 92 ± 9 μV; independent-samples t test; p > 0.05; n = 14 slices). A cut between the dentate gyrus and CA3 did not alter the amplitude (control, 119 ± 17 μV; after cut, 113 ± 15 μV; independent-samples t test; p > 0.05; n = 12 slices) but significantly increased the incidence of sharp wave-ripples in CA3 (control, 1.56 ± 0.10 Hz; after cut, 1.91 ± 0.09 Hz; independent-samples t test; p < 0.05; n = 12 slices). Control refers to measurements made in 26 intact slices. These experiments were done in interface conditions.
Table 1.
Characteristics of CA3 sharp wave-ripples in vitro
| Characteristic | Value |
|---|---|
| Incidence (Hz) | 1.5 ± 0.01 (0.35–2.3) |
| Amplitude (μV) | 450.4 ± 9.9 (60–1020) |
| Duration (ms) | 123.7 ± 2.5 (46–518) |
| Rise time (20–80%) (ms) | 39.9 ± 0.8 |
| Time to peak (ms) | 63.5 ± 1.3 |
| Half decay time (ms) | 28.6 ± 0.9 |
| Spatial extent (μm) | 449 ± 12 |
| Ripple frequency (Hz) | 150.1 ± 18.2 |
| Ripple amplitude (μV) | 78.8 ± 3.5 |
| Ripple duration (ms) | 122.2 ± 10.7 |
Data are given as mean ± SEM (range).
There was no difference in the properties of recorded sharp waves between the two conditions, except for a smaller amplitude when recorded with planar multielectrode arrays in submerged conditions.
Stimulation and recording protocols.
No holding current was applied when recording from pyramidal neurons and interneurons in current-clamp mode. Nominal resting membrane potentials were, for pyramidal neurons, −57 ± 1 mV (n = 53); for interneurons, −59 ± 1 mV (n = 59).
To investigate the effect of firing of individual neurons, a 500-ms-long depolarizing current step, sufficient for spike generation of approximately half-maximum firing frequency, was repeatedly injected at 0.1 Hz for at least 10 min. During dual patch-clamp recordings, the neuron recorded in voltage-clamp mode was held at −65 and 0 mV to record EPSCs and IPSCs, respectively, for at least 10 min at each holding voltage. Neurons were held, in arbitrary order, first at −65 mV and subsequently at 0 mV, or vice versa.
The effect of different concentrations of SR95331 on GABAA receptor-mediated currents in CA3 pyramidal neurons was investigated by extracellular stimulation in the presence of 20 μm NBQX and 50 μm d-AP5 to block excitatory synaptic transmission. Evoked IPSCs were recorded from pyramidal neurons in whole-cell voltage-clamp at a holding potential of 0 mV.
The effect of different ionic conditions on sharp wave incidence, amplitude, and spatial extent was investigated by wash-in of ASCF containing various concentrations of [K+], [Mg2+], or [Ca2+] for >5 min, after which sharp waves were recorded on the planar multielectrode array.
Anatomy.
Following intracellular recording, the slices were fixed in 4% paraformaldehyde in 0.1 m phosphate buffer (PB; pH 7.4). Biocytin-filled cells were visualized following standard procedures and reconstructed using Neurolucida and Neuroexplorer software (MBF Bioscience). Cells were classified according to their combined dendritic and axonal arborization (Freund and Buzsáki, 1996). Perisomatic-targeting interneurons were identified by the presence of predominant axonal branching in the stratum pyramidale of CA3. Dendritic-targeting interneurons (DTIs) were classified by the presence of prominent axonal arborization in the dendritic layers of CA3, without significant arborization in the stratum pyramidale, and included oriens-lacunosum moleculare neurons (interneurons with dendritic tree in the stratum oriens and axonal projection into the stratum lacunosum-moleculare) and radiatum cells (both the dendritic and axonal arborization localized in the stratum radiatum). A small number of interneurons could not be classified unequivocally. The effect of stimulation of these unclassified cells on network activity was not included in the analysis presented below (see Fig. 7).
Figure 7.

Separation of successful and unsuccessful PTIs according to shuffling method. Plot of normalized incidence before, during, and after stimulation of successful PTIs (Ai; p < 0.05, ANOVA, n = 6; pairwise comparison: prestimulus baseline vs t = 0.5–1.0 s and t = 1.5–2.0 s, p < 0.05, post hoc Bonferroni) and unsuccessful PTIs (B). Location of somata of successful PTIs (Aii) and unsuccessful PTIs (Bii). Spiking of PTIs in response to a suprathreshold current step of 500 ms duration (instantaneous frequency for individual neurons indicated by gray lines) as well as averaged over all neurons (red line; 50 ms bins). There was no significant difference between the average spiking rate of successful PTIs (Aiii) and unsuccessful PTIs (Biii).
Analysis of field recordings.
Data were analyzed off-line using IGOR Pro (Wavemetrics). For sharp wave detection, extracellular recordings were filtered between 0.1 and 20 Hz and sharp waves were detected as voltage fluctuations of >2 SD above the baseline value (0 mV), with a duration of >40 ms. The start and end of a sharp wave were taken as the time points when the sharp wave crossed baseline (0 mV). The spatial extent of sharp waves was estimated from the electrodes along the pyramidal cell layer with a deflection of >1 SD above the average over all electrodes.
Sharp wave–ripples in vivo are often detected as events >2–7 SD above the root mean square (RMS) of the 80–250 Hz bandpass-filtered signal (Csicsvari et al., 2000; O'Neill et al., 2006). A threshold of >6 SD detected 95.2% of the events and a threshold of >7 SD detected 75.2% of the events detected using the >2 SD amplitude threshold.
Ripple properties were estimated from fast frequency components during detected sharp waves, with peaks in the power spectrum between 80 and 250 Hz >5 SD above baseline. The baseline was taken as the power between 80 and 250 Hz on part of the trace without detected sharp wave events. The ripple frequency was estimated from the interval between the central and adjacent peak of the autocorrelation function. Ripple amplitude was estimated from the maximum peak of the Hilbert transform on 80–250 Hz bandpass-filtered traces. Ripple duration was estimated from the period during which the RMS of 80–250 Hz bandpass-filtered events remained >1 SD over baseline RMS (Csicsvari et al., 2000) (supplemental Fig. 1, available at www.jneurosci.org as supplemental material).
Two-dimensional current source density (CSD) analysis was performed as previously described (Shimono et al., 2000; Mann et al., 2005) on single sharp waves. CSD plots are shown using cold and warm colors for sinks and sources, respectively.
Spikes were detected from cell-attached recordings as voltage deflections of >5 SD from baseline (0 mV). Spikes and sharp waves were deemed correlated if the spike occurred within the duration of the sharp wave event. Spike times were binned in 5 ms bins and the total number of spikes for each bin was plotted relative to the maximum peak of the detected sharp wave. Single-cell plots were averaged to obtain spike probability plots.
To analyze the effect of firing of individual neurons on sharp wave incidence, we detected sharp waves using the electrode of the planar multielectrode array that was closest to the stimulated neuron. We calculated the decrease (during stimulation) and subsequent increase (within 1.5 s after stimulation) in sharp wave incidence, relative to the total spontaneous sharp wave incidence (baseline), for every electrode of the multielectrode array along the stratum pyramidale of CA3 (see Fig. 8).
Figure 8.

The suppression and postinhibitory enhancement of sharp wave generation is local to the axonal arborization of the stimulated perisomatic-targeting interneuron. A, Reconstruction of a single perisomatic-targeting interneuron and the spatial incidence of spontaneous sharp waves (left; baseline). There was a local decrease in sharp wave incidence during stimulation of the interneuron (middle), and a local postinhibitory enhancement after stimulation (right). Plotted is the difference between the incidence during and after stimulation relative to baseline. B, Left, Spatial distribution of sharp wave incidence ratio during (red) and following stimulation (blue) relative to baseline. This ratio is plotted relative to the axonal arbor of a perisomatic-targeting interneuron. Right, Plot of differential incidence during and after stimulation within the extent of the axonal arbor, and at 0–300, 300–600, and 600–900 μm distance from the outer limits of the axonal arbor. Over all cells, the change in sharp wave incidence during and after stimulation of perisomatic-targeting interneurons was significant only for the area of the axonal arborization (suppression, 0.59 ± 0.12, p < 0.05; enhancement, 1.4 ± 0.17, p < 0.05; one-sample t test, n = 6). C, There was no significant change in incidence during and after stimulation, as measured in the entire slice (p > 0.05; one-way ANOVA).
Analysis of intracellular recordings.
Data were analyzed off-line using IGOR Pro (Wavemetrics). Spikes and sharp waves were deemed correlated if the spike occurred within the duration of the sharp wave event. Spike times were binned in 5 ms bins and the total number of spikes for each bin was plotted relative to the maximum peak of the detected sharp wave. Single-cell plots were averaged to obtain spike probability plots. Synaptic events were detected as voltage or current fluctuations of >1 SD above baseline, with a duration of >8 ms in recordings filtered between 0.1 and 20 Hz. Baseline was defined as voltage or current during time epochs without detected sharp waves. A sharp wave and synaptic event were deemed correlated if they occurred within 5 ms of each other.
To analyze the synaptic events in pyramidal neurons during sharp waves, responses recorded intracellularly were detected over at least 10 min. The number of sharp waves with a detected response was counted and divided by the total number of sharp waves to obtain the percentage of sharp waves with synaptic responses for an individual pyramidal neuron (supplemental Fig. 3B, available at www.jneurosci.org as supplemental material). Some data below (see Fig. 3E,G) were created by averaging over all pyramidal neurons (n = 53). Responses were also grouped according to the distance (0, 150, 300, 450, and 600 μm) between the location of a sharp wave and the pyramidal neuron for every single response. The number of responses of each type at each distance was then divided by the total number of sharp waves originating at that distance to obtain a percentage of a particular response at each distance for an individual pyramidal neuron (supplemental Fig. 3C, available at www.jneurosci.org as supplemental material). The frequency ratio of excitation versus inhibition was calculated by dividing the total number of sharp waves with excitatory responses by the total number of sharp waves with inhibitory responses (see Fig. 3H). A subset of experiments used dual recordings of neurons in whole-cell current-clamp and voltage-clamp mode. For these experiments, correlations in input were calculated by cross-correlating sharp wave-associated events in the two cells (5 ms bins and normalized for the number of events) (see Fig. 3F).
Figure 3.
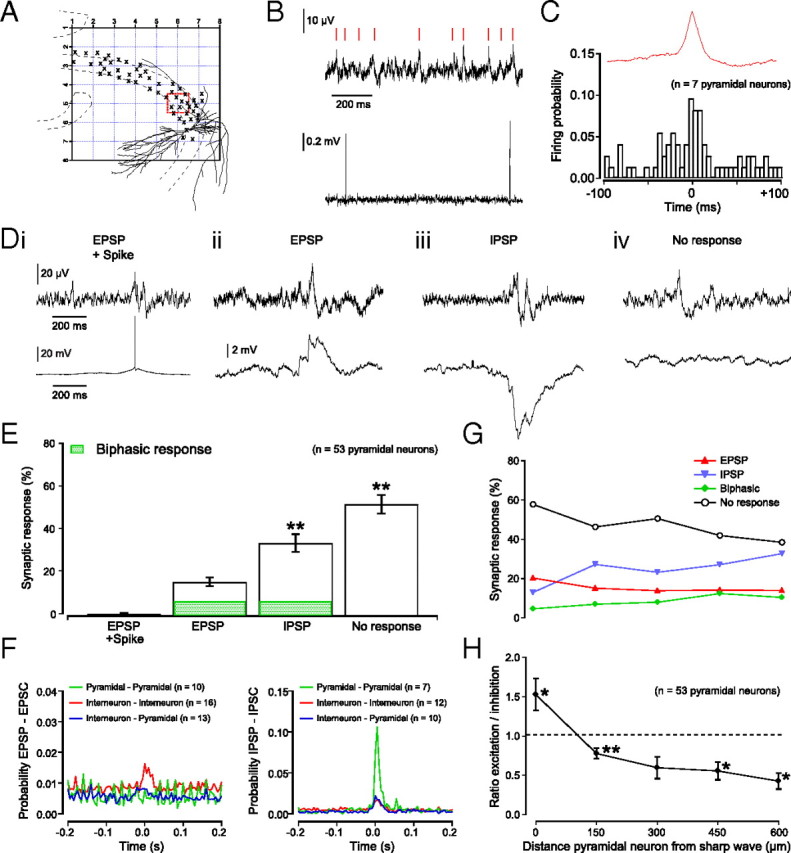
Pyramidal neurons mostly receive inhibition during sharp waves. A, Schematic of an 8 × 8 planar multielectrode array with the location of a single pyramidal neuron as visualized with biocytin labeling. Locations of other patched pyramidal neuron somata are indicated with crosses. B, Trace with sharp waves as recorded from red boxed electrode in A (top) and spiking of pyramidal neuron recorded in cell-attached configuration (bottom). C, Plot of average firing probability for seven pyramidal neurons centered on the peak of a sharp wave. Mean firing rate of participating pyramidal neurons was 0.3 Hz. The remaining 86.8% of pyramidal neurons (46 of 53) were silent during all sharp wave events. D, Example traces of sharp waves (top) and whole-cell current-clamp recordings (bottom) demonstrating sharp wave-associated events. Pyramidal neurons could show spikes (i) or EPSPs (ii), but mostly showed IPSPs (iii) or did not respond (iv) during sharp waves. A small number of subthreshold events were biphasic, consisting of an EPSP–IPSP or IPSP–EPSP sequence. Single pyramidal neurons could exhibit all four types of responses during the period of a recording. E, Distribution of sharp wave-associated activity in pyramidal neurons (spikes, 0.2 ± 0.1%; EPSPs, 15.1 ± 2.0%; IPSPs, 34.4 ± 4.0% and no response, 50.4 ± 4.2%; ANOVA; p < 0.05; n = 53; pairwise comparisons (for comparisons, spikes and EPSPs were combined): IPSP vs spike and EPSP, p < 0.01. and No input vs spike and EPSP, p < 0.01, Student's t test). Of all subthreshold events, 9.1% were biphasic responses consisting of an EPSP–IPSP or IPSP–EPSP sequence. F, Cross-correlation probability plots of synchronous excitatory (left) and inhibitory (right) input between pairs of neurons. Note the largest correlation (0.11) for inhibitory inputs between pairs of pyramidal neurons. G, Distribution of sharp wave-associated activity in pyramidal neurons as a function of distance from sharp wave events. H, Frequency ratio of sharp waves with excitatory and inhibitory input to pyramidal neurons as a function of the distance from sharp wave events (ratio of excitation to inhibition, 1.5 ± 0.2, p < 0.05, n = 20; 0.8 ± 0.07, p < 0.01, n = 21; 0.6 ± 0.14, p > 0.05, n = 13; 0.6 ± 0.11, p < 0.05, n = 9; and 0.4 ± 0.10, p < 0.05, n = 17 at 0, 150, 300, 450, and 600 μm distances, respectively; one-sample t test).
For voltage-clamp data, the frequency of synaptic events was calculated for individual stimulation events by dividing the number of detected events by the time interval over which these events were recorded. “Before” represents the time interval between the end of a sharp wave and the start of stimulation, “during” was the time period of stimulation, and “after” was the time interval between the end of stimulation and the start of the subsequent sharp wave. In this figure, only pairs from which both EPSCs and IPSCs were recorded were included (see Fig. 9B,C).
Figure 9.

A single perisomatic-targeting interneuron can trigger a transient increase in excitation over inhibition. A, Schematic of two reconstructed interneurons and their location in hippocampal CA3. Simultaneous field recordings of ongoing sharp wave activity (top traces) combined with whole-cell current-clamp recording of a PTI (green cell and green traces) and whole-cell voltage-clamp recording of a DTI (blue cell and blue traces), held consecutively at −65 mV (for recording of EPSCs) and 0 mV (for recording of IPSCs). Red boxes indicate the three time periods used when estimating PSC frequencies. B, C, Frequency of EPSCs and IPSCs before, during, and after individual stimulation events in successful PTIs (B; EPSCs and IPSCs as recorded from one anatomically identified pyramidal neuron and two interneurons whose subtype could not be unequivocally determined) and unsuccessful PTIs (C; EPSCs and IPSCs as recorded from three anatomically identified pyramidal neurons, three anatomically identified DTIs and two interneurons whose subtype could not be unequivocally determined) (see Materials and Methods). Stimulation events were split into those that were followed by a sharp wave (within 1.5 s) (Bi, Ci) and those that were not (Bii, Cii).
Shuffling method.
Perisomatic-targeting interneurons were subdivided into two populations according to their ability to significantly increase sharp wave incidence after stimulation above what would be expected could occur by chance. The observed sharp waves were shuffled by the built-in Gaussian random number generator of Igor Pro (Box-Muller transformation of uniform random numbers). If the observed average increase in sharp wave incidence, within 1.5 s after stimulation, was within the top 5% of 1000 randomly generated shuffled datasets (p < 0.05), the perisomatic-targeting interneuron was classified as successful.
Statistics.
All data are presented as means ± SEM, except where stated otherwise. Student's t tests, ANOVA, Bonferroni post hoc test, and linear regression were done in SPSS 16.0 (*p < 0.05, **p < 0.01).
Drugs and chemicals.
All drugs were obtained from Tocris Biosciences and Sigma-Aldrich.
Results
Sharp waves are local events and can be generated independently in all CA3 subfields
Transverse hippocampal slices superfused with a slightly modified ACSF (containing 4.25 mm K+, 1 Mg2+, and 3 mm Ca2+; Kubota et al., 2003) show spontaneous population burst activity similar to that seen during slow-wave sleep in vivo (O'Keefe and Nadel, 1978; Buzsáki, 1986), with sharp waves and associated ripple activity in both the CA3 and CA1 areas (Fig. 1A,B). Both CA3 and CA1 sharp waves are associated with fast oscillations (ripples) with frequencies similar to those described in vivo (150 ± 18 and 149 ± 8 Hz, respectively, in CA3 and CA1) (Fig. 1B). Sharp wave-ripples were generated in the recurrent network of CA3 and propagated to CA1 (Fig. 1C). Further CA3 sharp wave-ripple characteristics are shown in Table 1.
Sharp waves in vivo are predominantly recorded in CA1, in which they may occur simultaneously up to 4 mm apart (Buzsáki et al., 1992; Chrobak and Buzsáki, 1996). They are thought to reflect the synchronous firing of a population of CA3 pyramidal neurons (Buzsáki, 1986), preferentially initiated in CA3a/b before spreading to CA3c and CA1 (Csicsvari et al., 2000). Although a strong temporal correlation between CA3 and CA1 activity has been shown (Maier et al., 2003; Both et al., 2008), the spatial extent of synchronization within CA3 has not been characterized. We investigated the spatial characteristics of CA3 sharp waves by recording the events from hippocampal slices mounted on 8 × 8 planar multielectrode arrays with 150 μm spacing (Fig. 2A) (n = 36 slices from 26 animals). A high superfusion rate (6 ml/min) enabled the generation of sharp waves in these submerged conditions (Hajos et al., 2009).
Figure 2.

Sharp waves can arise locally and independently in all CA3 subfields. A, Position of hippocampal slice on 8 × 8 planar multielectrode array, with schematic of the anatomy (left) and photograph of the slice (middle). A corresponding recording of a single sharp wave shows that the event is localized (right). B, Pseudocolor representation of the voltage deflections observed during three separate sharp waves in the same slice, with warm colors representing positive deflections and cooler colors negative deflections. Sharp waves could originate in all subfields of CA3 in a single slice. C, Current source density analysis of a single sharp wave in 5 ms frames. The event started as a sink in the stratum radiatum with a corresponding source in the pyramidal cell layer followed by a sink in the pyramidal cell layer with a corresponding source in the stratum radiatum.
Similar to sharp waves in vivo, most sharp waves in vitro were detected as a downward deflection (sink) in the dendritic layers associated with an upward deflection (source) in the pyramidal cell layer (Fig. 2A,B). Individual sharp waves could be generated locally in, and remain confined to, a single CA3 subfield (Fig. 2B). In most slices, sharp waves were observed to originate from each of the CA3 subfields, but there was often a clear preference for a particular location (CA3c: 37.8 ± 5.4%; CA3b: 52.0 ± 5.9%; CA3a: 9.2 ± 4.0%; p < 0.05, ANOVA, pairwise comparisons: CA3b vs CA3c, p < 0.05, and CA3b vs CA3a, p < 0.01, Student's t test; n = 36 slices). The average linear extent of detectable sharp wave activity covered 449 ± 12 μm (n = 22 slices), corresponding to approximately one-third of the CA3 pyramidal cell layer. Sharp wave characteristics were not dependent on the precise ionic composition of the superfusate, with only large changes in ionic composition leading to a transition from sharp wave activity to epileptiform bursting (supplemental Fig. 2, available at www.jneurosci.org as supplemental material). CSD analysis of individual sharp wave events revealed that this activity corresponded to a sink in the stratum radiatum (60%) (Fig. 2C) or stratum oriens (40%). Many pyramidal neurons make their recurrent connections in these strata (Sik et al., 1993), suggesting that sharp waves are generated by activity at excitatory synapses on either the apical or basal dendrites, but an active source (inhibition) at the soma may also contribute to the field event.
Sharp waves are generated by a small localized group of pyramidal neurons
The finding that sharp waves are small and local events suggests that they are the result of synchronous firing of a small localized group of pyramidal neurons, although the spatial spread is likely to be smaller in a slice preparation than in vivo (Csicsvari et al., 2000). To investigate this further we combined planar multielectrode array recordings of sharp wave activity with cell-attached recording of individual pyramidal neurons, and subsequent whole-cell current-clamp recording, including biocytin in the patch pipette for post hoc anatomical identification. We recorded from a total of 53 anatomically identified pyramidal neurons distributed over the entire CA3 area (Fig. 3A).
Most of the pyramidal neurons recorded remained silent throughout the entire recording period, even when the sharp waves were occurring local to the area of the pyramidal neuron. Only 7 of 53 pyramidal neurons recorded (13.2%) fired action potentials. These seven cells fired single action potentials in phase with a sharp wave event, but only in 6.4 ± 3.0% of all observed sharp waves (Fig. 3B,C). The remaining 86.8% of pyramidal neurons (46 of 53) were silent during all sharp wave events. Subsequent whole-cell recordings showed that, during sharp wave activity, on average, a pyramidal neuron received strong inhibitory input in 34.4 ± 4.0% and no detectable synaptic input in 50.4 ± 4.2% of sharp waves. Only a small number of sharp waves were associated with subthreshold (15.1 ± 2.0%) or suprathreshold (0.2 ± 0.1%) excitation (Fig. 3D,E). Single pyramidal neurons could exhibit all four types of responses during the period of a recording (supplemental Fig. 3B, available at www.jneurosci.org as supplemental material). Not only was inhibition the dominant input, but it was also strongly correlated between pairs of pyramidal neurons (Fig. 3F). We did not observe a plateau and build-up period in activity as seen before epileptiform bursts (de la Prida et al., 2006).
As we observed strong inhibition of pyramidal neurons during local sharp wave activity we asked whether a population of nonparticipating pyramidal neurons might be actively silenced during a sharp wave event. We therefore calculated the ratio of excitation to inhibition that pyramidal neurons received (see Materials and Methods), and plotted this ratio against the distance between the pyramidal neuron and the location of a sharp wave (Fig. 3G,H).
When sharp waves originated at a distance of 150 μm or more, pyramidal neurons predominantly received inhibition. Only when sharp waves occurred <150 μm away did pyramidal neurons receive more excitation (EPSC to IPSC frequency ratio, 1.5 ± 0.2; p < 0.05; one-sample t test; n = 20).
The fact that many pyramidal neurons did not receive detectable synaptic input during sharp wave activity could be the result of severing recurrent connections during the slicing procedure. To investigate this possibility, phasic and tonic GABAA receptor-mediated inhibition was blocked with SR95531 (1 μm). This led to the generation of epileptiform bursting in CA3 (Fig. 4B), with all patched pyramidal neurons (n = 20) taking part in the epileptiform event and firing at high frequency (Fig. 4C,D), including those that received no detectable synaptic input or inhibition during sharp waves (de la Prida et al., 2006). This result suggests that excitatory interconnections were present, supporting the conclusion that only small groups of pyramidal neurons fire during any individual sharp wave event while the remaining population of pyramidal neurons remains silent.
Figure 4.

Recurrent connectivity in CA3 is retained in 400 μm slice. A, Schematic of a hippocampal slice on an 8 × 8 planar multielectrode array. B, Blocking all GABAA receptor-mediated inhibition by application of SR95331 (1 μm) led to the generation of epileptiform bursts in area CA3. Shown is a recording of a sharp wave in ACSF (left) and an epileptiform burst in ACSF containing 1 μm SR95331 (right). Note the difference in both amplitude and duration of events. C, Schematic of an 8 × 8 planar multielectrode array with the location of a single pyramidal neuron as visualized with biocytin labeling. D, Trace of epileptiform activity as seen on a single electrode of the planar multielectrode array (red box) and multiple spike discharges of a patched pyramidal neuron. E, All pyramidal neurons (n = 20) took part in the epileptiform bursts, even those that received predominantly inhibitory or no input during sharp wave activity.
Inhibition is necessary for sharp wave generation
To investigate which synaptic currents might underlie the synchronization of the small group of pyramidal neurons that take part in a sharp wave event, we applied antagonists at four major types of synaptic receptor (Fig. 5A) while measuring the incidence and amplitude of detected sharp waves (Fig. 5B). We found that fast synaptic transmission through AMPA receptors is obligatory, as application of the selective AMPA receptor antagonist GYKI52466 (100 μm) completely abolished sharp wave activity (Fig. 5A,B) (n = 6 slices). In contrast, NMDA receptors are not necessary for sharp wave generation. In fact, application of d-AP5 (50 μm) led to a significant increase in their amplitude (140 ± 10%; paired-samples t test; p < 0.05; n = 11) with no change in incidence (100 ± 5%; paired-samples t test; p > 0.05) (Fig. 5B), consistent with a previous report (Colgin et al., 2005).
Figure 5.

GABAA receptor-mediated inhibition is necessary for sharp wave generation. A, Simultaneous recording of sharp waves on planar multielectrode array with whole-cell current-clamp of pyramidal neuron. After 10 min of baseline recording, drugs acting on AMPA, NMDA, GABAB, or GABAA receptors were washed in, and their effect on both incidence and amplitude of ongoing sharp wave activity was assessed after 10 min. B, Effect of block of AMPA, NMDA, GABAB, or GABAA receptors on sharp wave amplitude and incidence, averaged over 6–12 slices. AMPA receptor antagonist GYKI52466 (100 μm) abolished all sharp wave activity. NMDA receptor antagonist d-AP5 (50 μm) significantly increased the amplitude of sharp waves with no effect on their incidence. GABAB receptor antagonist CGP52432 (2 μm) significantly and reversibly increased sharp wave incidence while not affecting amplitude. GABAA receptor antagonist SR95331 (200 nm) abolished all sharp wave activity. C, Dose-dependent reduction in IPSC amplitude by SR95331. Application of 200 nm SR95331 resulted in a 55 ± 5% reduction in IPSC amplitude. D, Application of SR95331 (200 nm) significantly depolarized pyramidal neurons and decreased the RMS noise outside of sharp wave events from 0.9 ± 0.1 to 0.5 ± 0.05 mV and back to 0.9 ± 0.2 mV upon washout (n = 8). Inset, Intracellular recording of pyramidal neuron in current-clamp mode. E, Enhancing GABAA receptor-mediated currents by application of pentobarbital (20 μm) or diazepam (10 μm) led to a significant and reversible increase in sharp wave incidence.
To investigate the role of synaptic inhibition, we applied antagonists at each of the two major inhibitory GABA receptor subtypes. Block of GABAB receptor-mediated transmission, by application of CGP52432 (2 μm), led to a significant increase in sharp wave incidence (144 ± 1%; paired-samples t test; p < 0.01, n = 6 slices) with no change in amplitude (105 ± 7.3%; paired-samples t test; p > 0.05) (Fig. 5B).
Block of both phasic and tonic GABAA receptor-mediated currents with SR95531 (1 μm) led to a transition from sharp wave to epileptiform burst generation (Fig. 4). However, when only a phasic component of the GABAA receptor-mediated current was blocked, with a lower concentration of SR95531 (200 nm) (Stell and Mody, 2002), all sharp wave activity ceased (n = 10 slices), and this effect was reversible (Fig. 5A,B). This concentration blocked 55 ± 5% of the evoked GABAA receptor-mediated current (Fig. 5C). Pyramidal neurons depolarized slightly, but significantly, upon application of SR95331 (200 nm) (from −62.4 ± 0.7 to −59.6 ± 0.8 mV; paired-samples t test; p < 0.01; n = 8) and this effect was also reversible (−61.4 ± 1.5 mV). Moreover, the application of 200 nm SR95331 led to a significant reduction in the intracellular noise, measured as the root mean square (RMS) of membrane potential fluctuations (65.2 ± 6.7%; paired-samples t test; p < 0.01; n = 8) (Fig. 5D). Conversely, enhancing GABAA receptor-mediated currents by application of pentobarbital (20 μm) or diazepam (10 μm) significantly increased the incidence of sharp waves by 28.6 ± 12% and 16.2 ± 8.6%, respectively (each p < 0.05; paired-samples t test; n = 7 slices) (Fig. 5E) [the effects of systemic application of these drugs can be found in the studies by Buzsáki (1986) and Suzuki and Smith (1988)]. The solvent DMSO (0.1%), used to dissolve diazepam, did not affect sharp wave amplitude or incidence by itself (101.7 ± 15.7% and 92.6 ± 7.3%; paired-samples t test; p > 0.05; n = 6). Combined, these results suggest that synchronized bursting of pyramidal neurons depends not only on AMPA receptor-mediated currents, but on GABAA receptor-mediated events as well.
A single perisomatic-targeting interneuron can suppress, and subsequently enhance, local sharp wave initiation
The observation that GABAA receptors are necessary for sharp wave generation under our conditions led us to hypothesize that GABAA receptor-mediated inhibition might play a role in the initiation of sharp waves. Furthermore, it has been shown that single neurons can affect network activity in vivo, with interneurons having the strongest effect (Brecht et al., 2004; Houweling and Brecht, 2008; Li et al., 2009). To investigate the effect of individual neurons on sharp wave initiation, whole-cell current-clamp recording was performed from anatomically identified PTIs, DTIs, and pyramidal neurons (Freund and Buzsáki, 1996). The neurons were repeatedly depolarized to suprathreshold levels with 500-ms-long current pulses at a frequency of 0.1 Hz, and we observed the effect of their firing on sharp wave incidence as recorded in the field (binned into 500 ms segments).
We found that the activation of a single interneuron could increase sharp wave incidence by more than ∼50% immediately after and up to 1.5 s following the interneuron firing. This ability of individual interneurons to influence sharp wave generation was interneuron subclass specific, and we identified all those interneurons that increased sharp wave incidence as PTIs (Fig. 6A). During stimulation of PTIs the number of detected sharp waves was reduced to 92.5 ± 4.0% with an increase in sharp wave incidence up to 1.5 s after stimulation (Fig. 6A) (pairwise comparisons: t = 1.0–1.5 s vs prestimulus baseline, p < 0.01, post hoc Bonferroni).
Figure 6.
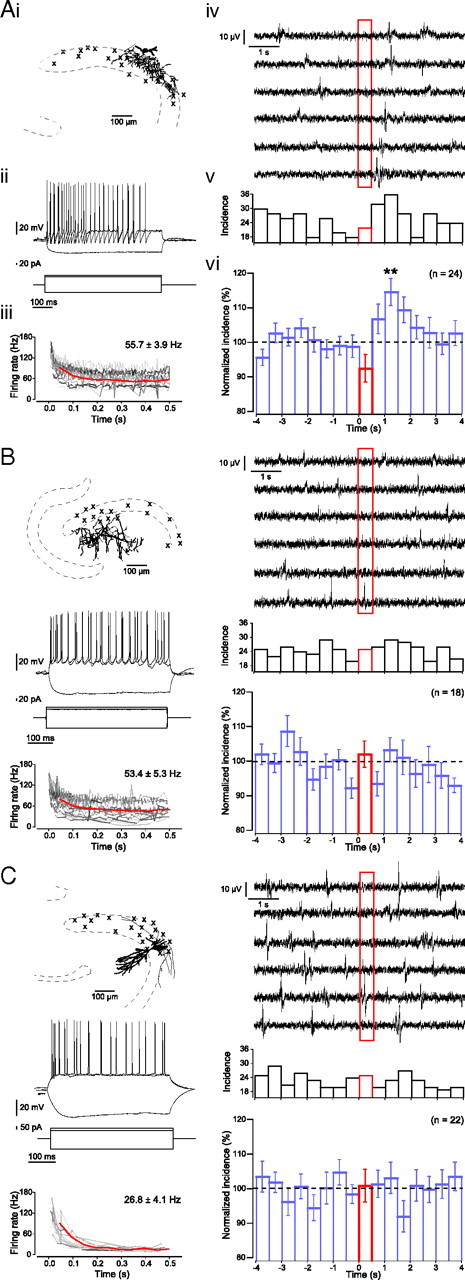
An individual perisomatic-targeting interneuron can suppress and subsequently enhance sharp wave incidence. A–C, The effects of single-cell firing on sharp wave generation was tested for anatomically identified perisomatic-targeting interneurons (A), dendritic-targeting interneurons (B), and pyramidal neurons (C). Each panel displays an example of each neuronal subtype with the soma location of all stimulated neurons indicated by crosses (i), two superposed responses to suprathreshold 500 ms current pulses as well as a single response to a hyperpolarizing current pulse (ii), a plot of spike rate during suprathreshold 500 ms current pulses for individual neurons (instantaneous frequency for individual neurons indicated by gray lines), and averaged over all neurons (red line; 50 ms bins) as well as the overall average spike rate indicated in the top right corner (iii), example traces of the effect of individual suprathreshold 500 ms current injection (stimulation between t = 0 s and 0.5 s; red box) on sharp wave events (iv), and the effect of this stimulation on sharp wave incidence for a single neuron (v) and averaged for a population of neurons (vi). Only stimulation of perisomatic-targeting interneurons produced a significant effect on network activity, with a local reduction in sharp wave incidence during stimulation and an increase in sharp wave incidence immediately and up to 1.5 s after stimulation.
We found a relatively large variability in the effect of PTI stimulation on sharp wave incidence, with increases of sharp wave incidence following stimulation ranging from 3% to 50%. We therefore divided the total population of PTIs into those that were successful and those that were unsuccessful in increasing sharp wave incidence (within 1.5 s following their activation) above what could be expected by chance (see Materials and Methods).
Of 24 anatomically identified PTIs recorded, 6 increased the average sharp wave incidence significantly above chance levels (Fig. 7A). We will refer to these neurons as successful PTIs. The number of sharp waves was reduced to 91.5 ± 7.0% during stimulation of these PTIs with an increase in sharp wave incidence up to 1.5 s after stimulation (Fig. 7A) (p < 0.05, ANOVA, n = 6; pairwise comparison: t = 0.5–1.0 s and t = 1.0–1.5 s vs prestimulus baseline, p < 0.05, post hoc Bonferroni). Both the suppression during stimulation and subsequent enhancement of sharp wave incidence were local to the area of axonal arborization of the stimulated PTIs, without significant influence on surrounding sharp wave incidence (Fig. 8). The increase in incidence after stimulation of these PTIs was not the result of a delayed generation of sharp waves that were unable to occur during stimulation. The actual total increase in the 1.5 s after stimulation (182.3 ± 15.6%) was significantly greater than the predicted net increase due to a simple delay (119.3 ± 11.7%; p < 0.01, paired-samples t test, n = 6). Furthermore, neither the average firing rate of the PTIs nor the baseline sharp wave incidence was correlated to the changes in sharp wave incidence following stimulation of these PTIs.
The remaining PTIs (n = 18) did not increase sharp wave incidence significantly (Fig. 7B). No significant differences were observed between the two populations of PTIs in either their average firing rate (successful PTIs, 57.1 ± 10.2 Hz and unsuccessful PTIs, 55.2 ± 4.0 Hz, p > 0.05, independent-samples t test), location, or axon length (successful PTIs, 648.9 ± 100.8 μm and unsuccessful PTIs, 621.0 ± 75.8 μm, p > 0.05, independent-samples t test; n = 5 and n = 14). Activation of DTIs did not affect the network activity (Fig. 6B) (n = 18).
It has been reported that a single pyramidal neuron in CA3 can initiate a population event in disinhibited hippocampal slices (Miles and Wong, 1983; de la Prida et al., 2006). In slices with intact inhibition we did not observe any effect on population event incidence by activating a single pyramidal neuron (Fig. 6C) (n = 22 pyramidal neurons) whether the pyramidal neuron was regular spiking (17.2 ± 4.0 Hz, n = 16) or bursting (50.7 ± 3.9 Hz, n = 6). However, two of five pyramidal neurons tested were able to initiate epileptiform population events under disinhibited conditions (1 μm SR95331) (Miles and Wong, 1983; de la Prida et al., 2006). These results suggest that the ability of individual neurons to increase the local incidence of sharp wave generation is restricted to PTIs.
The postinhibitory increase in sharp wave incidence is mediated by a transient increase in excitation over inhibition
To investigate a possible mechanism underlying the ability of an individual PTI to influence the occurrence of sharp waves, whole-cell current-clamp recording of interneurons was performed, combined with simultaneous voltage-clamp recording of either a pyramidal cell or an interneuron to measure synaptic currents. Sharp wave activity was concomitantly recorded with planar multielectrode arrays (Fig. 9A). A total of 28 pairs were patched, of which 14 included a PTI in current-clamp mode. Four of these PTIs could trigger a postinhibitory increase in sharp wave incidence.
Interneurons in current-clamp mode were repeatedly depolarized above spike threshold for 500 ms, at a frequency of 0.1 Hz, and their effect on EPSC and IPSC frequency in the voltage-clamped neuron was measured. The 500 ms of spiking in individual cells did not lead to significant changes in EPSC frequency or IPSC frequency during stimulation of any of the cell types (EPSCs: successful PTIs, 88.5 ± 4.1%, n = 3; unsuccessful PTIs, 100.3 ± 7.3%, n = 10; DTIs, 101.5 ± 6.3%, n = 11; all p > 0.05; one-sample t test; IPSCs: successful PTIs; 187.4 ± 44.9%, n = 4, unsuccessful PTIs; 153.3 ± 33.1, n = 8 and DTIs; 150.3 ± 20.7%, n = 6; all p > 0.05; one-sample t test). Similarly, overall, we did not detect any significant changes in EPSC frequency or IPSC frequency after stimulation of any of the cell types (EPSCs: successful PTIs, 123.9 ± 6.1%, n = 3; unsuccessful PTIs, 98.5 ± 7.1%, n = 10; DTIs, 98.9 ± 9.2%, n = 11; all p > 0.05; one-sample t test; IPSCs: successful PTIs; 108.3 ± 11.9%, n = 4, unsuccessful PTIs; 102.1 ± 11.4%, n = 8 and DTIs; 88.0 ± 11.6%, n = 6; all p > 0.05; one-sample t test).
However, significant effects were observed in both EPSC and IPSC frequency after stimulation of successful PTIs for those stimulation events that were followed by a sharp wave (Fig. 9B). We divided the stimulation events into those that led to a subsequent sharp wave (Fig. 9Bi) and those that did not (Fig. 9Bii). A significant increase in EPSC frequency with a concomitant decrease in IPSC frequency was observed only after stimulation of successful PTIs, and only when stimulation was followed by a sharp wave (Fig. 9Bi) (EPSCs, baseline: 3.0 ± 0.2 Hz, after: 3.6 ± 0.2 Hz, n = 167 events; IPSCs, baseline: 2.6 ± 0.3 Hz, after: 1.8 ± 0.2 Hz, n = 153 events; both p < 0.05; independent-samples t test). The ratio of EPSC to IPSC frequency increased from 1.1 ± 0.2 before stimulation and 1.2 ± 0.1 during stimulation to 2.0 ± 0.3 after stimulation. In contrast, no such difference was seen in unsuccessful PTIs, whether interneuron stimulation was followed by a sharp wave (Fig. 9Ci) or not (Fig. 9Cii). These results demonstrate a specific ability of a subpopulation of PTIs to elicit a postinhibitory transient increase in excitation over inhibition in the network, facilitating subsequent sharp wave generation.
Discussion
We have examined the cellular mechanisms involved in the initiation of hippocampal population burst activity, i.e., sharp wave–ripples in a network with intact inhibition. Our principal findings are as follows: (1) GABAA receptor-mediated inhibition is necessary for the initiation of spontaneous sharp waves. (2) An individual perisomatic-targeting interneuron can suppress, and subsequently enhance, local sharp wave generation. (3) The postinhibitory enhancement of sharp wave incidence is associated with a transient increase in excitation over inhibition. Furthermore, we show that sharp waves are generated by alternating subpopulations of pyramidal neurons in CA3 and that they seem to be spatially restricted by GABAA receptor-mediated inhibition. Combined, these results suggest that perisomatic-targeting interneurons can assist in selecting those pyramidal neurons that initiate each population burst in hippocampal CA3.
Surprisingly, GABAA receptor-mediated inhibition is necessary for generation of sharp waves under our conditions. It has been proposed that the functional synaptic connectivity in hippocampal CA3 changes during exploration (Buzsáki and Chrobak, 1995) and that these synaptic weights control population burst initiation and recruitment in subsequent rest and sleep stages (Behrens et al., 2005). Sharp wave bursts are thought to be initiated by neurons with the strongest synaptic connectivity and then spread to other neurons with less synaptic strengths (Buzsáki and Chrobak, 1995). In a scenario in which excitatory activity controls sharp wave initiation, an increase of sharp wave incidence might be expected upon block of phasic GABAA receptor-mediated inhibition. However, this was not observed; instead, all sharp wave activity ceased following application of a low concentration of the GABAA receptor antagonist SR95331. There are several possible explanations why GABAA receptors are necessary for sharp wave generation. First, it is possible that GABA could have a directly depolarizing, excitatory effect, as can be seen in young animals, as well as in certain neuronal types and cortical states in the adult brain (Cohen et al., 2002; Gulledge and Stuart, 2003; Banke and McBain, 2006; Szabadics et al., 2006). However, there is no good evidence that GABA is excitatory under our conditions. We used mature rats in which pyramidal cells most likely exhibit a GABAA receptor reversal potential which is negative to resting membrane potential (Luhmann and Prince, 1991; Owens et al., 1996). Moreover, stimulation of perisomatic-targeting interneurons caused a reduction in sharp wave incidence, suggesting that they are inhibitory when active. Nevertheless, neither of these observations excludes the possibility that GABA might be excitatory in a subset of pyramidal neurons that were not recorded by us or that GABA could be depolarizing in specific subregions of the pyramidal neuron (e.g., axon initial segment) (Szabadics et al., 2006; but see Glickfeld et al., 2009). Hyperpolarizing GABAergic events could also promote population bursting, either by postinhibitory rebound (Cobb et al., 1995), or by producing coordinated membrane potential fluctuations in neurons, which would facilitate spike synchrony within a population of pyramidal neurons (Aradi and Maccaferri, 2004; Ermentrout et al., 2008). In these ways phasic GABAA receptor-mediated inhibition could facilitate mutual synaptic excitation.
Our second principal finding is that a single perisomatic-targeting interneuron could suppress and subsequently enhance the local generation of sharp waves. Unlike epileptiform bursts, as seen in disinhibited slices, in which a single pyramidal neuron can initiate a network event (Miles and Wong, 1983; de la Prida et al., 2006), we did not observe any discernible influence on event generation by single pyramidal neurons in the CA3 network with intact inhibition. In contrast, some individual perisomatic-targeting GABAergic interneurons could control sharp wave initiation. This result suggests that, in addition to the pyramidal neurons with the strongest synaptic interconnectivity (Buzsáki and Chrobak, 1995), inhibitory neurons can assist in selecting those pyramidal neurons that initiate a sharp wave event. Perisomatic-targeting interneurons are a family of interneuron classes comprising cholecystokinin-positive basket cells, parvalbumin-positive basket cells, and parvalbumin-positive axo-axonic cells (Freund and Buzsáki, 1996). Elegant studies in area CA1 of the hippocampus have shown that parvalbumin-positive basket cells fire preferentially during a sharp wave–ripple, whereas axo-axonic cells tend to fire immediately before, but remain silent during, sharp wave–ripples (Klausberger et al., 2003). It has not been reported whether these neurons show similar behaviors in area CA3 of the hippocampus. If axo-axonic cells in CA3 also fire preferentially before sharp wave–ripples, they may have a role in selecting the subpopulation of CA3 pyramidal neurons that initiate the sharp wave event. Their preference to make synaptic connections on the axon initial segment of pyramidal neurons would make them well suited to influence axonal output (Miles et al., 1996).
Perisomatic-targeting interneurons controlling sharp wave events could be excited by external input from the dentate gyrus or entorhinal cortex. Although we and others show that the recurrent network in CA3 is sufficient to produce sharp wave–ripples intrinsically, and independently of input from the dentate gyrus or entorhinal cortex (Bragin et al., 1995; Maier et al., 2003), there is evidence that interneurons are modulated by upstream neurons. For example, surgical removal of the entorhinal cortex leads to an increase in ripple patterns during slow-wave sleep (Bragin et al., 1995), and, recently, a number of studies have shown the influence of the cortical slow oscillation on sharp wave–ripple generation in the hippocampus in both rodents (Sirota et al., 2003; Battaglia et al., 2004; Isomura et al., 2006) and humans (Clemens et al., 2007). Moreover, intracellular recordings of individual hippocampal interneurons revealed membrane potential fluctuations in synchrony with neocortical slow oscillations (Hahn et al., 2006).
Our third principal finding is that activity of a single perisomatic-targeting interneuron can lead to a transient increase in excitation over inhibition in the network after stimulation. These results suggest that spiking activity of perisomatic-targeting interneurons could facilitate the generation of sharp waves by providing a temporary inhibition within a subpopulation of pyramidal neurons, after which rebound excitation can occur (Cobb et al., 1995; Harris et al., 2001). From our data, it is not possible to distinguish between the possibilities that the failure of some perisomatic-targeting interneurons to influence sharp wave initiation is due to the network state or because different subclasses of perisomatic-targeting interneuron might have different effects on these network events.
In conclusion, we suggest that a subgroup of perisomatic-targeting interneurons assists in selecting the subset of pyramidal neurons that initiate a sharp wave event. It seems that interneurons, rather than merely modulating pyramidal cell activity, can play an integral part in the local information processing that takes place in the hippocampal network.
Footnotes
This research was supported by the Wellcome Trust. We thank J. Csicsvari for helpful advice and useful comments on a previous version of this manuscript. We thank G. Buzsáki and T. Klausberger for helpful suggestions regarding shuffling analysis.
References
- Aradi I, Maccaferri G. Cell type-specific synaptic dynamics of synchronized bursting in the juvenile CA3 rat hippocampus. J Neurosci. 2004;24:9681–9692. doi: 10.1523/JNEUROSCI.2800-04.2004. [DOI] [PMC free article] [PubMed] [Google Scholar]
- Banke TG, McBain CJ. GABAergic input onto CA3 hippocampal interneurons remains shunting throughout development. J Neurosci. 2006;26:11720–11725. doi: 10.1523/JNEUROSCI.2887-06.2006. [DOI] [PMC free article] [PubMed] [Google Scholar]
- Battaglia FP, Sutherland GR, McNaughton BL. Hippocampal sharp wave bursts coincide with neocortical “up-state” transitions. Learn Mem. 2004;11:697–704. doi: 10.1101/lm.73504. [DOI] [PMC free article] [PubMed] [Google Scholar]
- Behrens CJ, van den Boom LP, de Hoz L, Friedman A, Heinemann U. Induction of sharp wave-ripple complexes in vitro and reorganization of hippocampal networks. Nat Neurosci. 2005;8:1560–1567. doi: 10.1038/nn1571. [DOI] [PubMed] [Google Scholar]
- Both M, Bähner F, von Bohlen und Halbach O, Draguhn A. Propagation of specific network patterns through the mouse hippocampus. Hippocampus. 2008;18:899–908. doi: 10.1002/hipo.20446. [DOI] [PubMed] [Google Scholar]
- Bragin A, Jandó G, Nádasdy Z, van Landeghem M, Buzsáki G. Dentate EEG spikes and associated interneuronal population bursts in the hippocampal hilar region of the rat. J Neurophysiol. 1995;73:1691–1705. doi: 10.1152/jn.1995.73.4.1691. [DOI] [PubMed] [Google Scholar]
- Brecht M, Schneider M, Sakmann B, Margrie TW. Whisker movements evoked by stimulation of single pyramidal cells in rat motor cortex. Nature. 2004;427:704–710. doi: 10.1038/nature02266. [DOI] [PubMed] [Google Scholar]
- Buzsáki G. Hippocampal sharp waves: their origin and significance. Brain Res. 1986;398:242–252. doi: 10.1016/0006-8993(86)91483-6. [DOI] [PubMed] [Google Scholar]
- Buzsáki G. Two-stage model of memory trace formation: a role for “noisy” brain states. Neuroscience. 1989;31:551–570. doi: 10.1016/0306-4522(89)90423-5. [DOI] [PubMed] [Google Scholar]
- Buzsáki G, Chrobak JJ. Temporal structure in spatially organized neuronal ensembles: a role for interneuronal networks. Curr Opin Neurobiol. 1995;5:504–510. doi: 10.1016/0959-4388(95)80012-3. [DOI] [PubMed] [Google Scholar]
- Buzsáki G, Horváth Z, Urioste R, Hetke J, Wise K. High-frequency network oscillation in the hippocampus. Science. 1992;256:1025–1027. doi: 10.1126/science.1589772. [DOI] [PubMed] [Google Scholar]
- Chrobak JJ, Buzsáki G. High-frequency oscillations in the output networks of the hippocampal-entorhinal axis of the freely behaving rat. J Neurosci. 1996;16:3056–3066. doi: 10.1523/JNEUROSCI.16-09-03056.1996. [DOI] [PMC free article] [PubMed] [Google Scholar]
- Clemens Z, Mölle M, Eross L, Barsi P, Halász P, Born J. Temporal coupling of parahippocampal ripples, sleep spindles and slow oscillations in humans. Brain. 2007;130:2868–2878. doi: 10.1093/brain/awm146. [DOI] [PubMed] [Google Scholar]
- Cobb SR, Buhl EH, Halasy K, Paulsen O, Somogyi P. Synchronization of neuronal activity in hippocampus by individual GABAergic interneurons. Nature. 1995;378:75–78. doi: 10.1038/378075a0. [DOI] [PubMed] [Google Scholar]
- Cohen I, Navarro V, Clemenceau S, Baulac M, Miles R. On the origin of interictal activity in human temporal lobe epilepsy in vitro. Science. 2002;298:1418–1421. doi: 10.1126/science.1076510. [DOI] [PubMed] [Google Scholar]
- Colgin LL, Jia Y, Sabatier JM, Lynch G. Blockade of NMDA receptors enhances spontaneous sharp waves in rat hippocampal slices. Neurosci Lett. 2005;385:46–51. doi: 10.1016/j.neulet.2005.05.005. [DOI] [PubMed] [Google Scholar]
- Csicsvari J, Hirase H, Mamiya A, Buzsáki G. Ensemble patterns of hippocampal CA3-CA1 neurons during sharp wave-associated population events. Neuron. 2000;28:585–594. doi: 10.1016/s0896-6273(00)00135-5. [DOI] [PubMed] [Google Scholar]
- Csicsvari J, O'Neill J, Allen K, Senior T. Place-selective firing contributes to the reverse-order reactivation of CA1 pyramidal cells during sharp waves in open-field exploration. Eur J Neurosci. 2007;26:704–716. doi: 10.1111/j.1460-9568.2007.05684.x. [DOI] [PMC free article] [PubMed] [Google Scholar]
- de la Prida LM, Huberfeld G, Cohen I, Miles R. Threshold behavior in the initiation of hippocampal population bursts. Neuron. 2006;49:131–142. doi: 10.1016/j.neuron.2005.10.034. [DOI] [PubMed] [Google Scholar]
- Diba K, Buzsáki G. Forward and reverse hippocampal place-cell sequences during ripples. Nat Neurosci. 2007;10:1241–1242. doi: 10.1038/nn1961. [DOI] [PMC free article] [PubMed] [Google Scholar]
- Ermentrout GB, Galán RF, Urban NN. Reliability, synchrony and noise. Trends Neurosci. 2008;31:428–434. doi: 10.1016/j.tins.2008.06.002. [DOI] [PMC free article] [PubMed] [Google Scholar]
- Foster DJ, Wilson MA. Reverse replay of behavioural sequences in hippocampal place cells during the awake state. Nature. 2006;440:680–683. doi: 10.1038/nature04587. [DOI] [PubMed] [Google Scholar]
- Freund TF, Buzsáki G. Interneurons of the hippocampus. Hippocampus. 1996;6:347–470. doi: 10.1002/(SICI)1098-1063(1996)6:4<347::AID-HIPO1>3.0.CO;2-I. [DOI] [PubMed] [Google Scholar]
- Glickfeld LL, Roberts JD, Somogyi P, Scanziani M. Interneurons hyperpolarize pyramidal cells along their entire somatodendritic axis. Nat Neurosci. 2009;12:21–23. doi: 10.1038/nn.2230. [DOI] [PMC free article] [PubMed] [Google Scholar]
- Gulledge AT, Stuart GJ. Excitatory actions of GABA in the cortex. Neuron. 2003;37:299–309. doi: 10.1016/s0896-6273(02)01146-7. [DOI] [PubMed] [Google Scholar]
- Hahn TT, Sakmann B, Mehta MR. Phase-locking of hippocampal interneurons' membrane potential to neocortical up-down states. Nat Neurosci. 2006;9:1359–1361. doi: 10.1038/nn1788. [DOI] [PubMed] [Google Scholar]
- Hájos N, Ellender TJ, Zemankovics R, Mann EO, Exley R, Cragg SJ, Freund TF, Paulsen O. Maintaining network activity in submerged hippocampal slices: importance of oxygen supply. Eur J Neurosci. 2009;29:319–327. doi: 10.1111/j.1460-9568.2008.06577.x. [DOI] [PMC free article] [PubMed] [Google Scholar]
- Harris KD, Hirase H, Leinekugel X, Henze DA, Buzsáki G. Temporal interaction between single spikes and complex spike bursts in hippocampal pyramidal cells. Neuron. 2001;32:141–149. doi: 10.1016/s0896-6273(01)00447-0. [DOI] [PubMed] [Google Scholar]
- Houweling AR, Brecht M. Behavioural report of single neuron stimulation in somatosensory cortex. Nature. 2008;451:65–68. doi: 10.1038/nature06447. [DOI] [PubMed] [Google Scholar]
- Isomura Y, Sirota A, Ozen S, Montgomery S, Mizuseki K, Henze DA, Buzsáki G. Integration and segregation of activity in entorhinal-hippocampal subregions by neocortical slow oscillations. Neuron. 2006;52:871–882. doi: 10.1016/j.neuron.2006.10.023. [DOI] [PubMed] [Google Scholar]
- Jefferys JG. Experimental neurobiology of epilepsies. Curr Opin Neurol. 1994;7:113–122. doi: 10.1097/00019052-199404000-00007. [DOI] [PubMed] [Google Scholar]
- Klausberger T, Magill PJ, Márton LF, Roberts JD, Cobden PM, Buzsáki G, Somogyi P. Brain-state- and cell-type-specific firing of hippocampal interneurons in vivo. Nature. 2003;421:844–848. doi: 10.1038/nature01374. [DOI] [PubMed] [Google Scholar]
- Korn SJ, Giacchino JL, Chamberlin NL, Dingledine R. Epileptiform burst activity induced by potassium in the hippocampus and its regulation by GABA-mediated inhibition. J Neurophysiol. 1987;57:325–340. doi: 10.1152/jn.1987.57.1.325. [DOI] [PubMed] [Google Scholar]
- Kubota D, Colgin LL, Casale M, Brucher FA, Lynch G. Endogenous waves in hippocampal slices. J Neurophysiol. 2003;89:81–89. doi: 10.1152/jn.00542.2002. [DOI] [PubMed] [Google Scholar]
- Lee AK, Wilson MA. Memory of sequential experience in the hippocampus during slow wave sleep. Neuron. 2002;36:1183–1194. doi: 10.1016/s0896-6273(02)01096-6. [DOI] [PubMed] [Google Scholar]
- Li CY, Poo MM, Dan Y. Burst spiking of a single cortical neuron modifies global brain state. Science. 2009;324:643–646. doi: 10.1126/science.1169957. [DOI] [PMC free article] [PubMed] [Google Scholar]
- Luhmann HJ, Prince DA. Postnatal maturation of the GABAergic system in rat neocortex. J Neurophysiol. 1991;65:247–263. doi: 10.1152/jn.1991.65.2.247. [DOI] [PubMed] [Google Scholar]
- Maier N, Güldenagel M, Söhl G, Siegmund H, Willecke K, Draguhn A. Reduction of high-frequency network oscillations (ripples) and pathological network discharges in hippocampal slices from connexin 36-deficient mice. J Physiol. 2002;541:521–528. doi: 10.1113/jphysiol.2002.017624. [DOI] [PMC free article] [PubMed] [Google Scholar]
- Maier N, Nimmrich V, Draguhn A. Cellular and network mechanisms underlying spontaneous sharp wave-ripple complexes in mouse hippocampal slices. J Physiol. 2003;550:873–887. doi: 10.1113/jphysiol.2003.044602. [DOI] [PMC free article] [PubMed] [Google Scholar]
- Mann EO, Paulsen O. Exploring fast hippocampal network oscillations: combining multielectrode recordings with optical imaging and patch-clamp techniques. In: Taketani M, Baudry M, editors. Advances in network electrophysiology: using multielectrode arrays. New York: Springer; 2006. pp. 454–469. [Google Scholar]
- Mann EO, Suckling JM, Hajos N, Greenfield SA, Paulsen O. Perisomatic feedback inhibition underlies cholinergically induced fast network oscillations in the rat hippocampus in vitro. Neuron. 2005;45:105–117. doi: 10.1016/j.neuron.2004.12.016. [DOI] [PubMed] [Google Scholar]
- McBain CJ. Hippocampal inhibitory neuron activity in the elevated potassium model of epilepsy. J Neurophysiol. 1995;73:2853–2863. doi: 10.1152/jn.1995.73.2.2853. [DOI] [PubMed] [Google Scholar]
- Miles R, Wong RK. Single neurones can initiate synchronized population discharge in the hippocampus. Nature. 1983;306:371–373. doi: 10.1038/306371a0. [DOI] [PubMed] [Google Scholar]
- Miles R, Tóth K, Gulyás AI, Hájos N, Freund TF. Differences between somatic and dendritic inhibition in the hippocampus. Neuron. 1996;16:815–823. doi: 10.1016/s0896-6273(00)80101-4. [DOI] [PubMed] [Google Scholar]
- Nimmrich V, Maier N, Schmitz D, Draguhn A. Induced sharp wave-ripple complexes in the absence of synaptic inhibition in mouse hippocampal slices. J Physiol. 2005;563:663–670. doi: 10.1113/jphysiol.2004.079558. [DOI] [PMC free article] [PubMed] [Google Scholar]
- O'Keefe J, Nadel L. The hippocampus as a cognitive map. Oxford: Oxford UP; 1978. [Google Scholar]
- O'Neill J, Senior T, Csicsvari J. Place-selective firing of CA1 pyramidal cells during sharp wave/ripple network patterns in exploratory behavior. Neuron. 2006;49:143–155. doi: 10.1016/j.neuron.2005.10.037. [DOI] [PubMed] [Google Scholar]
- Owens DF, Boyce LH, Davis MB, Kriegstein AR. Excitatory GABA responses in embryonic and neonatal cortical slices demonstrated by gramicidin perforated-patch recordings and calcium imaging. J Neurosci. 1996;16:6414–6423. doi: 10.1523/JNEUROSCI.16-20-06414.1996. [DOI] [PMC free article] [PubMed] [Google Scholar]
- Shimono K, Brucher F, Granger R, Lynch G, Taketani M. Origins and distribution of cholinergically induced beta rhythms in hippocampal slices. J Neurosci. 2000;20:8462–8473. doi: 10.1523/JNEUROSCI.20-22-08462.2000. [DOI] [PMC free article] [PubMed] [Google Scholar]
- Sik A, Tamamaki N, Freund TF. Complete axon arborization of a single CA3 pyramidal cell in the rat hippocampus, and its relationship with postsynaptic parvalbumin-containing interneurons. Eur J Neurosci. 1993;5:1719–1728. doi: 10.1111/j.1460-9568.1993.tb00239.x. [DOI] [PubMed] [Google Scholar]
- Sirota A, Csicsvari J, Buhl D, Buzsáki G. Communication between neocortex and hippocampus during sleep in rodents. Proc Natl Acad Sci U S A. 2003;100:2065–2069. doi: 10.1073/pnas.0437938100. [DOI] [PMC free article] [PubMed] [Google Scholar]
- Skaggs WE, McNaughton BL. Replay of neuronal firing sequences in rat hippocampus during sleep following spatial experience. Science. 1996;271:1870–1873. doi: 10.1126/science.271.5257.1870. [DOI] [PubMed] [Google Scholar]
- Staley KJ, Longacher M, Bains JS, Yee A. Presynaptic modulation of CA3 network activity. Nat Neurosci. 1998;1:201–209. doi: 10.1038/651. [DOI] [PubMed] [Google Scholar]
- Stell BM, Mody I. Receptors with different affinities mediate phasic and tonic GABAA conductances in hippocampal neurons. J Neurosci. 2002;22:RC223. doi: 10.1523/JNEUROSCI.22-10-j0003.2002. [DOI] [PMC free article] [PubMed] [Google Scholar]
- Suzuki SS, Smith GK. Spontaneous EEG spikes in the normal hippocampus. V. Effects of ether, urethane, pentobarbital, atropine, diazepam and bicuculline. Electroencephalogr Clin Neurophysiol. 1988;70:84–95. doi: 10.1016/0013-4694(88)90198-8. [DOI] [PubMed] [Google Scholar]
- Szabadics J, Varga C, Molnár G, Oláh S, Barzó P, Tamás G. Excitatory effect of GABAergic axo-axonic cells in cortical microcircuits. Science. 2006;311:233–235. doi: 10.1126/science.1121325. [DOI] [PubMed] [Google Scholar]
- Traub RD, Wong RK. Cellular mechanism of neuronal synchronization in epilepsy. Science. 1982;216:745–747. doi: 10.1126/science.7079735. [DOI] [PubMed] [Google Scholar]