

Abstract
The prevalence of childhood overweight and obesity increased dramatically in the United States during the past three decades. This increase has adverse public health implications, but its implication for children’s academic outcomes is less clear. This paper uses data from five waves of the Early Childhood Longitudinal Study-Kindergarten to examine how children’s weight is related to their scores on standardized tests and to their teachers’ assessments of their academic ability. The results indicate that children’s weight is more negatively related to teacher assessments of their academic performance than to test scores.
Keywords: Childhood overweight, Obesity, Underweight, Test scores, Grades
1. Introduction
The prevalence of childhood overweight and obesity rose rapidly in the U.S. during the last three decades.1 The increase is important not only from a public health standpoint but also because weight appears to affect children’s psychological and social development. Being overweight or obese is associated with low self-esteem, negative body image, depression, and being teased or bullied (e.g., Friedlander, Larkin, Rosen, Palermo, & Redline, 2003; Storch et al., 2007; Strauss, 2000). The effect of children’s weight on their intellectual development is less clear. Previous research has reached mixed conclusions about the effect of weight on measures of academic success (e.g., Kaestner & Grossman, 2010; Sabia, 2007). This study therefore further examines the relationship between weight and children’s academic performance. It focuses on whether the relationship depends on how academic performance is measured: via test scores or via teacher assessments.
A growing literature examines the causes and consequences of the rise in childhood overweight and obesity. Not only did rates of childhood overweight and obesity rise dramatically from the mid-1970s to the mid-2000s, but the degree to which children are overweight increased as well (Stifel & Averett, 2009). Potential contributors to this trend include increases in sedentary behavior (Manson, Skerrett, Greenland, & VanItallie, 2004); changes in food consumption patterns (Cutler, Glaeser, & Shapiro, 2003); and rising maternal employment (Anderson, Butcher, & Levine, 2003; Cawley & Liu, 2012). The negative health consequences of childhood obesity include early onset of type 2 diabetes (Fagot-Campagna, Narayan, & Imperatore, 2001) and increased risk of obesity and chronic disease in adulthood (Dietz, 1998; Thompson et al., 2007). Obesity-related hospital costs for school-aged children more than tripled in real terms from 1979 to 1999 (Wang & Dietz, 2002).
There are several pathways through which children’s weight could affect their academic performance. Overweight children are more likely to have sleep apnea and asthma, which may interfere with cognitive performance (Luder, Melnik, & DiMaio, 1998). Obese children also are more likely to have an iron deficiency, which reduces cognitive performance (Nead, Halterman, Kaczorowski, Auinger, & Weitzman, 2004; Taras, 2005). If being overweight lowers children’s self-esteem, as indicated by Hayden-Wade et al. (2005) and Strauss (2000), it may indirectly lead to poorer academic performance. Bias among peers, parents, or teachers against overweight children could worsen their academic performance if those children receive fewer academic opportunities or less encouragement.
The relationship between weight and academic ability may not be causal but rather reflect common factors. For example, children who spend lots of time watching television may be more likely to both become overweight and do worse in school, or children whose parents closely supervise their activities may eat better and spend more time studying. Birth weight, breast feeding duration, maternal smoking during pregnancy, and maternal age are related to both childhood overweight and cognitive outcomes, while poor nutrition and physical inactivity may adversely affect both weight and school performance (Veldwijk et al., 2012). Greater physical activity at school appears to boost children’s academic performance and reduce their weight gain (Donnelly & Lambourne, 2011). Underweight children may have health problems that affect both their weight and academic ability. A negative relationship between weight and academic performance also could reflect reverse causality, with poor academic outcomes increasing the likelihood that children overeat or spend less time exercising. Finally, the effect on academic outcomes could be positive if heavier children opt to spend more time studying instead of playing sports or socializing with peers.
Previous research has reached mixed results on the relationship between children’s weight and academic ability. Kaestner and Grossman (2010) report that being overweight or obese has little effect on children’s scores on standardized tests in math and reading. Crosnoe and Muller (2004) find a negative effect of being overweight on adolescents’ grades ata point in time but not on the change in their grades over time. Datar, Sturm and Magnabosco (2004) report a similar finding for children’s math and reading test scores. However, Sabia (2007) concludes that there is a significant negative relationship between the change in adolescent white girls’ body mass index and the change in their grades; Ding, Lehrer, Rosenquist, and Audrain-McGovern (2009) also report a negative effect of obesity on grades, particularly among girls. Looking at standardized test scores, Averett and Stifel (2007, 2010) find evidence of negative effects of being obese on reading and math scores and of being underweight on math scores. Datar and Sturm (2006) report that girls who become obese experience a drop in their reading and math test scores compared with other girls. Eide, Showalter, and Goldhaber (2010), in contrast, conclude that being overweight is, if anything, positively associated with math and reading test scores for boys while being underweight is negatively associated with boys’ test scores.
The conflicting results from the above studies could be due to use of different estimation methodologies, different datasets, and different child ages. An intriguing possibility, however, is that weight status has a different effect on grades than on test scores. There are several reasons this might be the case. Teachers may be assessing children on aspects of academic ability that standardized tests do not fully capture, and these aspects may be related to children’s weight. For example, teachers may be evaluating children based on their perceived or actual self-control, self-confidence, peer relations, or class participation and other measures of class performance, not just on their academic ability as measured by tests. Another possibility is that teachers are biased against heavier children. Research reports that teachers hold negative perceptions of obese people (Neumark-Sztainer & Story, 1999) and view lack of self-control and psychological problems as major contributors to obesity (Price, Desmond, & Stelzer, 1987).
Previous research has not directly compared the effect of weight status on grades or other teacher-based measures of academic performance with the effect on test scores using the same methodology and dataset among children of the same age.2 This study aims to fill that gap in the literature. Understanding whether children’s weight affects their test scores and teacher assessments is important given the increasing prevalence of childhood overweight and obesity. Lower levels of human capital may play a role in the negative relationship between weight and wages, particularly among white females, observed by a number of studies (e.g., Averett & Korenman, 1996; Cawley, 2004; Mocan & Tekin, 2011). Han, Norton, and Powell (2011) conclude that lower educational attainment is the main pathway through which weight indirectly affects wages. This study investigates educational outcomes at the elementary and middle school levels, settings that may set the stage for educational outcomes later in life. The next section discusses the data used here, followed by an explanation of the regression model. The results indicate that children’s weight is more negatively related to teacher assessments of ability than to their test scores.
2. Data
This study uses data from the Early Childhood Longitudinal Study-Kindergarten (ECLS-K). The ECLS-K is a large-scale survey that began following children who were in kindergarten in the U.S. for the first time in 1998–1999. The sample was replenished in first grade, and the weighted sample is nationally representative of children who were in first grade in 1999–2000. Surveys were conducted in both fall and spring of kindergarten and first grade. A random subset of children were followed over time and resurveyed two years (third grade for most children), four years (fifth grade), and seven years (eighth grade) later. The sample was not replenished in those later waves, but repeated attempts were made to contact all children selected for follow-up. Children, parents, teachers, and school administrators were surveyed in most waves. This study uses waves two (spring kindergarten), four (spring first grade), five, six, and seven of the survey and therefore follows children from kindergarten through the end of middle school.
2.1. Measures of academic performance
The five ECLS-K survey waves used here include two types of measures of academic performance: scores on standardized tests, and assessments by the children’s teachers. In each survey wave used here, the ECLS-K staff administered tests that assessed children in language and literacy (henceforth reading) and math. Science tests were added starting with the fifth wave (third grade). Child development, elementary education, and content area experts were consulted on the design and development of the tests, and the validity of the tests was established via comparison with scores on the Woodcock–McGrew–Werder Mini-Battery of Achievement (Tourangeau, Nord, Lê, Pollack, & Atkins-Burnett, 2006). This study uses the item response theory (IRT) scores reported in the ECLS-K as its measure of test scores.3 This study normalizes the IRT test scores to mean zero, standard deviation one for each measure within survey waves in order to enable comparisons across measures and years.
The ECLS-K asked the children’s teachers to assess study participants in the same general areas as those covered by the tests. Kindergarten and first grade teachers assessed each child’s proficiency in reading and math. Teachers in later waves assessed children’s proficiency in reading, math, and science. In the fifth and eighth grade waves, teachers assessed either math or science but not both for a child; if a child had multiple teachers, the teacher in that subject area did the assessment. Teachers were asked to rate each child on a scale from one to five on their skills, knowledge, and behaviors in six to ten specific areas within each subject area based on their experience with the child.4 Teachers were instructed to compare the child to other children of the same age and to rate only the child’s current achievement, not the child’s potential.5 Based on those ratings and the difficulty of each specific area, the ECLS-K assigned children scores in each general area (reading, math, and science) on a continuous scale from one to five. Like the test scores, those scores are normalized here to mean zero, standard deviation one for each measure within survey waves.
The tests and teacher assessments are conducted in the same general areas but differ somewhat. The ECLS-K notes that the teacher assessments “overlap and augment” the test scores (Tourangeau, Nord, Lê, Pollack, & Atkins-Burnett, 2009: 3–29). In particular, the teacher assessments “include items designed to measure both the process and products of children’s learning in school, whereas the direct cognitive battery is more limited” (Tourangeau et al., 2009: 3–29). For example, the reading teacher assessments include children’s ability to communicate orally and in writing, which was not directly assessed in the reading tests. Teachers did not know children’s ECLS-K test scores when they provided their assessments.
2.2. Weight measures and sample construction
The ECLS-K contains good measures of children’s height and weight. For each survey wave, trained assessors measured children’s height and weight twice. Children’s weight was measured in pounds using a digital scale, and their height was measured to the nearest quarter-inch using a Shorr board. The ECLS-K thus has the advantage of not using size as reported by children or their parents, measures that may be systematically biased (Bogaert, Steinbeck, Baur, Brock, & Bermingham, 2003). This study focuses on children’s body mass index (BMI), a measure of weight relative to height (constructed as weight in kilograms divided by height in meters squared). Among adults, obesity is defined as BMI of 30 or higher, and overweight as BMI of 25 or higher. Although BMI is closely related to children’s adiposity (Gallagher et al., 1996; Johnson-Taylor & Everhart, 2006), these cutoffs are not always a good measure of weight status among children because of changes in body proportions and adiposity as children age. This study therefore follows the convention of classifying children as overweight if their BMI falls between the 85th and 95th percentile for children of their age (in months) and sex, and as obese if their BMI falls above the 95th percentile. Children are classified as underweight if their BMI falls below the 5th percentile. The 2000 Centers for Disease Control growth reference chart and the “zanthro” module in Stata are used here to classify children’s weight status.
All children with a test score, teacher assessment in the same subject area, and BMI in at least two of the five survey waves are included in the sample used here. This gives a total of 58,654 observations, some of them on children observed up to five times in multiple subject areas and some observed only twice in one subject area. A total of 15,795 children are in the sample used here. The results discussed below are qualitatively similar if the data are restricted to a balanced panel of children with reading and math or science test scores and teacher assessments in all five waves, but statistical significance levels tend to be lower since that sample is smaller. Observations are weighted using the child cross-sectional weights for those five waves provided by the ECLS-K.
2.3. Descriptive statistics
Table 1 presents mean test scores and teacher assessments by children’s weight status. The results suggest that heavy children have lower academic ability than other children. Average test scores for overweight children are significantly below those for normal-weight children in all three subject areas (top panel, column 2 versus column 1). Average test scores are even lower for obese children (column 3). The bottom panel shows that average teacher assessments for overweight and obese children are significantly below those for normal-weight children as well. Average teacher assessments are again much lower for obese children than for overweight children. For underweight children (column 4), most average test scores and teacher assessments are not significantly different from those of normal-weight children.
Table 1.
Descriptive statistics for measures of academic performance, by weight status.
| Normal weight | Overweight | Obese | Underweight | |
|---|---|---|---|---|
| A. Test scores | ||||
| Reading | 0.046 | −0.032 | −0.200 | −0.031 |
| (0.005) | (0.009) | (0.013) | (0.033) | |
| [37,716] | [12,609] | [5634] | [1008] | |
| Math | 0.040 | −0.030 | −0.193 | −0.014 |
| (0.006) | (0.010) | (0.014) | (0.033) | |
| [31,930] | [10,189] | [4502] | [899] | |
| Science | 0.047 | −0.016 | −0.183 | −0.127 |
| (0.011) | (0.018) | (0.026) | (0.089) | |
| [7822] | [3144] | [1475] | [148] | |
| B. Teacher assessments | ||||
| Reading | 0.047 | −0.027 | −0.227 | 0.022 |
| (0.006) | (0.009) | (0.013) | (0.033) | |
| [37,716] | [12,609] | [5634] | [1008] | |
| Math | 0.037 | −0.023 | −0.187 | −0.024 |
| (0.006) | (0.010) | (0.015) | (0.034) | |
| [31,930] | [10,189] | [4502] | [899] | |
| Science | 0.060 | −0.019 | −0.253 | 0.016 |
| (0.011) | (0.018) | (0.026) | (0.076) | |
| [7822] | [3144] | [1475] | [148] | |
Notes: Shown are sample means by weight status, with standard errors in parentheses and sample sizes in brackets. Each measure of test scores and teacher assessments is normalized to mean 0, standard deviation 1 across children within survey waves.
The sample means thus indicate that overweight and obese children have worse test scores and teacher assessments than normal-weight children. Of course, these differences in means could be due to other characteristics, such as socioeconomic status. The ECLS-K includes data on a wide variety of child, family, and school characteristics that may affect children’s academic achievement. The regression model described next adds controls for child, family, school, and teacher characteristics as well as child fixed effects in order to further examine the relationship between weight and academic achievement.
3. Methods
This study estimates pooled cross-sectional and fixed effect linear regression models. Models are estimated using individual-level data and have the basic form
| (1) |
where i indexes individuals and t indexes survey waves. The dependent variable, Scoreit, is a measure of academic achievement: a normalized test score or teacher assessment. The right-hand-side variable of interest is one of two measures of weight. One measure is BMI, and the other is a set of indicator variables for being overweight, obese, or underweight, with normal-weight children as the reference group.6
All regressions control for children’s age in months and its square because children who are older within a grade may have higher academic achievement, particularly in early grades. Some specifications add controls for other child characteristics, including sex, race/ethnicity, birthweight, foreign-born status, and hours of television watched per week; family characteristics, including number of siblings and socioeconomic status (a variable created by the ECLS-K that captures household income and parents’ education, labor force status, and occupation in quintiles); school characteristics, including region, urban/suburban/rural, public/private non-religious/Catholic/other religious, percent minority students, and percent of students receiving free lunch; and teacher characteristics, including age, years teaching that grade or subject, an indicator variable for education beyond a bachelor’s degree, and an indicator variable for the teacher and child being the same race/ethnicity.7 Appendix Table A1 lists the control variables and reports their sample means and standard deviations.
Table A1.
Descriptive statistics for control variables from Early Childhood Longitudinal Study-Kindergarten Sample (N = 58,654).
| Mean | Std. Dev. | |
|---|---|---|
| A. Child characteristics | ||
| Age (in months) | 117.36 | 34.98 |
| Female | .49 | .50 |
| White | .59 | .49 |
| Black, non-Hispanic | .16 | .36 |
| Hispanic | .18 | .39 |
| Other race/ethnicity | .07 | .26 |
| Low birthweight (1500–2500 grams) | .07 | .25 |
| Very low birthweight (<1500 grams) | .01 | .10 |
| High birthweight (>4500) | .02 | .14 |
| Foreign born | .02 | .15 |
| Hours of television watched per week | 16.93 | 14.40 |
| B. Family characteristics | ||
| Number of siblings | 1.37 | 1.17 |
| Socioeconomic status (SES) quintile | ||
| First (lowest) | .16 | .37 |
| Second | .18 | .38 |
| Third | .19 | .39 |
| Fourth | .19 | .39 |
| Fifth (highest) | .20 | .40 |
| C. School characteristics | ||
| Northeast | .17 | .38 |
| Midwest | .24 | .43 |
| South | .38 | .49 |
| West | .20 | .40 |
| Large or mid-size city | .32 | .47 |
| Large or mid-size suburb, large town | .40 | .49 |
| Small town and rural | .23 | .42 |
| Public | .88 | .33 |
| Catholic | .06 | .23 |
| Other religious | .04 | .21 |
| Other private | .02 | .14 |
| Percent minority | ||
| Less than 10% | .29 | .46 |
| 10% to less than 25% | .18 | .39 |
| 25% to less than 50% | .18 | .38 |
| 50% to less than 75% | .12 | .33 |
| 75% or more | .21 | .41 |
| Proportion free lunch | .32 | .28 |
| D. Teacher characteristics | ||
| Age (in years) | 39.55 | 13.99 |
| Same race/ethnicity as child | .64 | .48 |
| Years teaching grade (subject in 8th grade) | 8.59 | 7.94 |
| Has education beyond bachelor’s degree | .74 | .44 |
Some specifications include child fixed effects, γi, to control for unobservable, time-invariant child characteristics, such as genetic factors and innate ability. Variables that are not time-varying, such as children’s sex, drop out in the child fixed effects specifications. Other specifications (discussed but not reported in the tables) include teacher or school fixed effects instead. This is possible since the ECLS-K includes multiple children per classroom. All specifications include survey wave fixed effects, ηt, to control for time-specific effects that are common to all children. Standard errors, εit, are robust and clustered on the child.
4. Results
Children’s weight appears to have a similar relationship with test scores and teacher assessments in a parsimonious specification. The top panel of Table 2 reports the estimated relationship between BMI and children’s test scores and teacher assessments in OLS regressions that control only for children’s age, its square, and survey wave. Each coefficient is from a separate regression. The results show that BMI is negatively related (at the 90 percent confidence level or higher) to both test scores and teacher assessments. A 1 point increase in BMI is associated with test scores and teacher assessments that are 0.017–0.021 standard deviations lower. There are no significant differences between the estimated coefficients on BMI for test scores and teacher assessments within subject areas.
Table 2.
Estimated relationship between body mass index and measures of academic performance.
| Reading
|
Math
|
Science
|
||||
|---|---|---|---|---|---|---|
| Test | Teacher | Test | Teacher | Test | Teacher | |
| A. No controls except child age and survey wave | ||||||
| Body mass index | −0.018*** (0.002) |
−0.019*** (0.002) |
−0.018*** (0.003) |
−0.017*** (0.003) |
−0.018*** (0.004) |
−0.021*** (0.004) |
| B. Child, family, school, and teacher controls | ||||||
| Body mass index | −0.004** (0.002) |
−0.009*** (0.002) |
−0.003 (0.002) |
−0.007*** (0.002) |
−0.001 (0.003) |
−0.010*** (0.003) |
| C. Child fixed effects and child, family, school, and teacher controls | ||||||
| Body mass index | −0.002 (0.002) |
−0.008 (0.002) |
−0.001 (0.002) |
−0.011 (0.004) |
−0.002 (0.003) |
−0.001 (0.005) |
| N | 56,967 | 56,967 | 47,520 | 47,520 | 12,589 | 12,589 |
Notes: Shown are estimates (standard errors) from OLS regressions of a child’s test score or teacher assessment on his/her body mass index and other variables as indicated. All regressions include fixed effects for 4 of 5 survey waves, child’s age (in months), and age squared. Standard errors are robust and clustered on the child.
p < 0.05.
p < 0.01.
The top panel of Table 3 shows analogous results for the indicator variables for weight status. Test scores and teacher assessments tend to be lower for overweight and obese children than for normal-weight children. The estimated coefficients are considerably more negative for obese than for overweight children, with obese children scoring about 0.2–0.3 standard deviations lower than normal-weight children of the same age and overweight children scoring about 0.06–0.08 standard deviations lower. For each measure of weight status, there is no significant difference between the estimated coefficient in the test score model and in the teacher assessment model within each subject area in the parsimonious specification.
Table 3.
Estimated relationship between weight status and measures of academic performance.
| Reading
|
Math
|
Science
|
||||
|---|---|---|---|---|---|---|
| Test | Teacher | Test | Teacher | Test | Teacher | |
| A. No controls except child age and survey wave | ||||||
| Overweight | −0.080*** (0.022) |
−0.076*** (0.020) |
−0.071*** (0.023) |
−0.062*** (0.020) |
−0.062 (0.043) |
−0.078** (0.040) |
| Obese | −0.245*** (0.033) |
−0.275*** (0.030) |
−0.233*** (0.035) |
−0.225*** (0.030) |
−0.223*** (0.069) |
−0.311*** (0.059) |
| Underweight | −0.074 (0.050) |
−0.023 (0.060) |
−0.055 (0.049) |
−0.062 (0.049) |
−0.181 (0.224) |
−0.046 (0.162) |
| B. Child, family, school, and teacher controls | ||||||
| Overweight | 0.003 (0.019) |
−0.018 (0.018) |
0.009 (0.019) |
−0.011 (0.018) |
0.052 (0.033) |
0.013 (0.035) |
| Obese | −0.074** (0.030) |
−0.147*** (0.027) |
−0.074** (0.034) |
−0.121*** (0.030) |
0.002 (0.050) |
−0.142*** (0.048) |
| Underweight | −0.073* (0.041) |
−0.025 (0.048) |
−0.052 (0.040) |
−0.072* (0.044) |
−0.101 (0.109) | −0.010 (0.111) |
| C. Child fixed effects and child, family, school, and teacher controls | ||||||
| Overweight | −0.011 (0.017) |
−0.031 (0.020) |
0.010 (0.015) |
−0.065** (0.023) |
−0.004 (0.040) |
0.082 (0.071) |
| Obese | −0.027 (0.030) |
−0.114*** (0.036) |
−0.028 (0.029) |
−0.150*** (0.043) |
−0.067 (0.063) |
0.085 (0.099) |
| Underweight | −0.029 (0.033) |
0.038 (0.050) |
0.005 (0.033) |
−0.002 (0.053) |
−0.061 (0.075) |
−0.193 (0.177) |
| N | 56,967 | 56,967 | 47,520 | 47,520 | 12,589 | 12,589 |
Notes: Shown are estimates (standard errors) from OLS regressions of a child’s test score or teacher assessment on indicator variables for being underweight, overweight, or obese (with normal weight as the omitted category) and other variables as indicated. All regressions include fixed effects for 4 of 5 survey waves, child’s age (in months), and age squared. Standard errors are robust and clustered on the child.
p < 0.1.
p < 0.05.
p < 0.01.
Weight remains negatively related to teacher assessments and some test scores when controls for child, family, school, and teacher characteristics are added to the regressions. The magnitude of the estimated relationships becomes smaller (closer to zero) when the controls are added, indicating that other characteristics partially mediate the relationship between children’s weight and their academic performance. As panel B of Table 2 shows, children’s BMI is negatively related to teacher assessments in all three subject areas, with a 1 point increase in BMI associated with about a 0.01 standard deviation decrease in teacher assessments. Children’s BMI is significantly related to test scores only in reading. Being obese is negatively related to both test scores and teacher assessments in reading and math and to teacher assessments in science (Table 3, panel B). However, being overweight is not significantly related to academic achievement when the controls are included. Being underweight is negatively related to reading test scores and math teacher assessments.
The results with controls indicate some differences in how weight is related to test scores versus teacher assessments. In all three subjects, the estimated relationship between BMI and teacher assessments is significantly more negative than the estimated relationship for test scores. The same is true for obese status in reading and science. Obese children’s teacher assessments in reading, for example, are 0.073 standard deviations lower than their test scores, relative to normal-weight children, controlling for other observable characteristics.
Adding child fixed effects yields a similar pattern. Panel C of Table 2 shows that children’s BMI is negatively related to teacher assessments in reading and math when controlling for unobservable, time-invariant characteristics via child fixed effects in addition to the time-varying child, family, school, and teacher measures. BMI is not significantly related to test scores, in contrast. The estimated coefficient on BMI for teacher assessments versus test scores is significantly different in reading and in math. Turning to weight status, obese children have significantly lower reading and math teacher assessments than normal-weight children, but not lower test scores (Table 3, panel C). The difference between the test score and teacher assessment coefficients for obese children is significant in reading and in math.8 Overweight children also have lower teacher assessments in math than normal-weight children, but not lower test scores.
The results in Tables 2 and 3 thus indicate children’s weight is more negatively related to their teacher assessments than to their test scores in reading and math. Being obese appears to matter most; being overweight or underweight has relatively few significant relationships with either test scores or teacher assessments in specifications with controls beyond child age and survey wave.
Systematic differences in where children go to school or in whom their teachers are do not appear to underlie the results. Regressions that include school fixed effects instead of child fixed effects (not shown here) indicate a similar pattern. Teacher assessments in reading, math, and science are negatively related to BMI, but test scores are not. The result is again driven by obese children; obese status is significantly more negatively related to teacher assessments than to test scores in all three subject areas.
Regressions that instead include teacher fixed effects also indicate that BMI is negatively related to teacher assessments in reading and science, but not to test scores. Obese status is significantly more negatively related to teacher assessments than to test scores in reading and science compared with normal-weight status among children who have the same teacher. School or teacher characteristics therefore do not appear to underlie the result that children’s weight is more negatively related to their teacher assessments than to their test scores.
In other results, the pattern of weight tending to be more negatively related to teacher assessments than to test scores occurs in every survey wave. This differential relationship appears to get bigger over time, particularly for obese children. Fig. 1 shows the estimated coefficients on obese status in cross-sectional regressions for each survey wave, controlling for child, family, school, and teacher characteristics, for reading. In the last survey wave, when most of the children are in eighth grade, the gap between teacher assessments and test scores in reading is 0.11 standard deviations (and statistically significant) for obese children. The comparable gap is only 0.03 standard deviations in kindergarten, 0.06 standard deviations in first grade, 0.08 standard deviations in third grade, and 0.09 standard deviations in fifth grade.
Fig. 1.
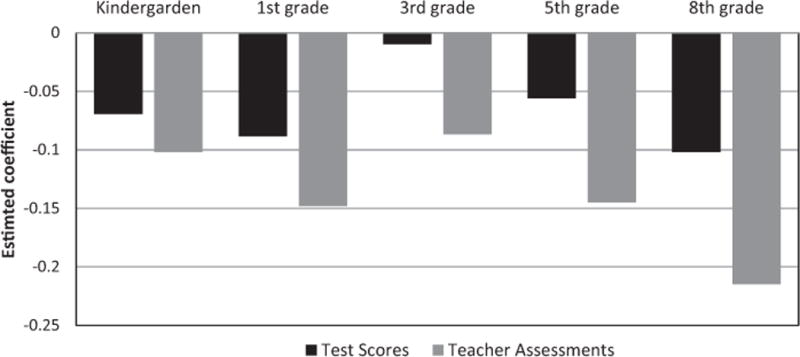
Estimated relationship between being obese and reading scores by survey wave. Notes: Shown are estimated coefficients on an indicator variable for obese weight status in separate regressions by survey wave. Regressions also include indicators for overweight and underweight status and measures of child, family, school, and teacher characteristics.
There are several potential reasons why the gap appears to widen over time. First, children in this birth cohort became heavier as they aged; the extent to which these children were overweight increased (Stifel & Averett, 2009). In addition, teachers’ perceptions of overweight or obese children, children’s own self-perceptions, and classroom and peer dynamics may change with age. Teachers may regard overweight or obese adolescents more negatively than similarly heavy younger children; they may attribute overweight or obesity to a lack of self-control among older children but to inadequate parental supervision among younger children, for example. Weight also may have larger effects on children’s performance in class and on tests via self-esteem and peer effects as they age. Heavier children’s class participation or relationships with their peers may worsen as they age, and teacher assessments may capture this more than test scores.
The pattern shown here is driven mainly by boys, not girls. Cornwell, Mustard, and Van Parys (2013) report that teachers assess academic ability considerably more positively among girls than boys relative to children’s test scores. Table 4 reports the estimated coefficients on BMI in child fixed effects regressions stratified by sex, race, and ethnicity (the regressions are the equivalent of Table 2, panel C; results by weight status show a similar pattern). The pattern of a more negative relationship between weight and teacher assessments than test scores is strongest for boys; it also holds in math among Hispanic girls. This result is surprising given that Sabia (2007), Ding et al. (2009), and Datar and Sturm (2006) find stronger negative relationships between weight and academic performance for girls than for boys. However, Sabia (2007) and Ding et al. (2009) focus on grades among high school-aged children, older than the children examined here. Datar and Sturm (2006) examine the relationship between becoming overweight between kindergarten and third grade and test scores in third grade, different from the child fixed effect regression estimated here.
Table 4.
Estimated relationship between BMI and measures of academic performance by sex, race, and ethnicity.
| Reading
|
Math
|
Science
|
||||
|---|---|---|---|---|---|---|
| Test | Teacher | Test | Teacher | Test | Teacher | |
| White boys | −0.001 (0.004) |
−0.012*** (0.004) |
0.003 (0.004) |
−0.008 (0.007) |
0.001 (0.007) |
−0.022 (0.014) |
| White girls | 0.002 (0.003) |
−0.004 (0.003) |
−0.001 (0.003) |
−0.003 (0.005) |
−0.001 (0.003) |
−0.002 (0.005) |
| Black boys | −0.001 (0.009) |
−0.011 (0.012) |
0.007 (0.007) |
−0.027** (0.013) |
−0.054** (0.022) |
0.013 (0.033) |
| Black girls | −0.014 (0.009) |
−0.006 (0.012) |
−0.005 (0.007) |
−0.005 (0.012) |
−0.003 (0.014) |
0.025 (0.026) |
| Hispanic boys | 0.005 (0.008) |
−0.019* (0.010) |
−0.012 (0.008) |
−0.030** (0.013) |
0.001 (0.015) |
−0.021 (0.025) |
| Hispanic girls | −0.015* (0.008) |
−0.013 (0.011) |
0.001 (0.009) |
−0.034*** (0.013) |
−0.007 (0.018) |
0.024 (0.024) |
Notes: Shown are estimates (standard errors) from OLS regressions of a child’s test score or teacher assessment on his/her body mass index. All regressions include child fixed effects, measures of child, family, school, and teacher characteristics, fixed effects for 4 of 5 survey waves, child’s age (in months), and age squared. Standard errors are robust and clustered on the child.
p < 0.1.
p < 0.05.
p < 0.01.
The differential result here appears to be driven more by weight than by height. Regressions that include children’s height and weight as separate variables instead of weight relative to height (not shown here) indicate that height is positively related to test scores and teacher assessments in specifications with child, family, school, and teacher controls. This accords with findings that height has a sizable effect on life outcomes, including education (e.g., Case & Paxson, 2008; Deaton & Arora, 2009). The magnitude of the estimated coefficients on height is similar for test scores and teacher assessments. Weight, in contrast, is more negatively related to teacher assessments than to test scores. Interestingly, height is not significantly related to test scores or teacher assessments when child fixed effects are included, but weight continues to be significantly negatively related to teacher assessments. This is consistent with Case and Paxson’s (2008) observation that height is positively related to cognitive ability even before children enter school; they also note that relative height and its influence on outcomes persist into adulthood. The results here suggest that the positive cognitive effect associated with height is captured by child fixed effects, but teacher assessments of children’s academic ability decrease if children become heavy relative to their height.
4.1. Relationship between control variables and academic performance
The controls for child and family characteristics generally are related to test scores and teacher assessments in the expected direction. Appendix Table A2 reports the results from the BMI specifications with child, family, school, and teacher characteristics (as in Table 2, panel B; results are similar in other specifications). Age is positively related to children’s test scores and teacher assessments within survey waves. Girls have higher teacher assessments than boys in all subjects, but they have lower test scores in math and science. Non-Hispanic whites have higher test scores and teacher assessments than black or Hispanic children in all subject areas. To put the magnitude of the estimated coefficients on BMI and the dichotomous weight measures in perspective, blacks tend to score about 0.25–0.4 standard deviations and Hispanics 0.1–0.2 standard deviations lower than non-Hispanic whites on both test scores and teacher assessments. Academic performance is negatively related to hours of television viewing, low birthweight, the number of siblings, and being from a family with lower socioeconomic status.
Table A2.
Estimated coefficients for control variables.
| Reading
|
Math
|
Science
|
||||
|---|---|---|---|---|---|---|
| Test | Teacher | Test | Teacher | Test | Teacher | |
| Child characteristics | ||||||
| Age | 0.044*** (0.005) |
0.049*** (0.005) |
0.081*** (0.005) |
0.060*** (0.005) |
0.081*** (0.014) |
0.054*** (0.016) |
| Age squared/100 | −0.011*** (0.002) |
−0.013*** (0.002) |
−0.025*** (0.003) |
−0.018*** (0.003) |
−0.023*** (0.005) |
−0.015*** (0.006) |
| Female | 0.177*** (0.018) |
0.324*** (0.017) |
−0.092*** (0.018) |
0.089*** (0.016) |
−0.214*** (0.033) |
0.123*** (0.033) |
| Black, non-Hispanic | −0.265*** (0.036) |
−0.218*** (0.033) |
−0.435*** (0.036) |
−0.266*** (0.034) |
−0.691*** (0.072) |
−0.301*** (0.068) |
| Hispanic | −0.167*** (0.038) |
−0.100*** (0.033) |
−0.248*** (0.035) |
−0.134*** (0.033) |
−0.244*** (0.069) |
−0.213*** (0.069) |
| Other race/ethnicity | −0.008 (0.036) |
0.004 (0.034) |
−0.117*** (0.036) |
−0.024 (0.034) |
−0.091 (0.066) |
−0.036 (0.070) |
| Low birthweight | −0.127*** (0.039) |
−0.173*** (0.038) |
−0.213*** (0.039) |
−0.188*** (0.038) |
−0.118 (0.076) |
−0.057 (0.068) |
| Very low birthweight | −0.195* (0.103) |
−0.370*** (0.085) |
−0.460*** (0.065) |
−0.398*** (0.076) |
−0.050 (0.182) |
−0.195 (0.171) |
| High birthweight | −0.015 (0.081) |
−0.001 (0.066) |
−0.067 (0.093) |
−0.045 (0.056) |
−0.103 (0.112) |
0.090 (0.091) |
| Foreign born | 0.059 (0.058) |
−0.003 (0.058) |
0.070 (0.051) |
0.024 (0.055) |
0.045 (0.124) |
0.023 (0.118) |
| Hours of TV per week | −0.004*** (0.001) |
−0.004*** (0.001) |
−0.005*** (0.001) |
−0.004*** (0.001) |
−0.003** (0.001) |
−0.004***(0.001) |
| Family characteristics | ||||||
| Number of siblings | −0.065*** (0.008) |
−0.041*** (0.007) |
−0.024*** (0.008) |
−0.037*** (0.007) |
−0.057*** (0.016) |
−0.011 (0.016) |
| First SES quintile | −0.239*** (0.050) |
−0.353*** (0.057) |
−0.239*** (0.050) |
−0.367*** (0.057) |
−0.304*** (0.084) |
−0.321*** (0.078) |
| Second SES quintile | 0.082 (0.050) |
−0.068 (0.055) |
0.022 (0.049) |
−0.082 (0.057) |
0.093 (0.081) |
0.020 (0.074) |
| Third SES quintile | 0.224*** (0.051) |
0.076 (0.056) |
0.183***(0.051) | 0.021 (0.057) |
0.308*** (0.081) |
0.213*** (0.076) |
| Fourth SES quintile | 0.396*** (0.052) |
0.260*** (0.057) |
0.368*** (0.052) |
0.202*** (0.058) |
0.466*** (0.083) |
0.405*** (0.077) |
| Fifth SES quintile | 0.687*** (0.053) |
0.514*** (0.058) |
0.650*** (0.054) |
0.418*** (0.060) |
0.680*** (0.085) |
0.596*** (0.078) |
| School characteristics | ||||||
| Northeast | 0.525** (0.207) |
−0.344* (0.185) |
−0.179 (0.417) |
−0.504** (0.253) |
– | – |
| Midwest | 0.527** (0.207) |
−0.346* (0.184) |
−0.120 (0.417) |
−0.505** (0.253) |
0.018 (0.047) |
0.018 (0.049) |
| South | 0.594*** (0.206) |
−0.254 (0.185) |
−0.062 (0.417) |
−0.408 (0.253) |
0.0622 (0.048) |
0.108** (0.051) |
| West | 0.571*** (0.208) |
−0.244 (0.186) |
−0.084 (0.417) |
−0.429* (0.253) |
−0.114* (0.059) |
0.029 (0.061) |
| City | 0.076* (0.043) |
0.064 (0.045) |
−0.040 (0.054) |
−0.043 (0.053) |
0.053 (0.082) |
0.008 (0.074) |
| Suburb | 0.061 (0.042) |
0.023 (0.044) |
−0.044 (0.053) |
−0.084 (0.052) |
0.033 (0.083) |
−0.027 (0.072) |
| Small town/rural | −0.046 (0.046) |
−0.057 (0.046) |
−0.182*** (0.054) |
−0.206*** (0.054) |
−0.017 (0.084) |
−0.094 (0.076) |
| Public | 0.421** (0.202) |
0.797*** (0.180) |
0.478 (0.409) |
0.674*** (0.244) |
0.827*** (0.180) |
0.449* (0.257) |
| Catholic | 0.416** (0.203) |
0.745*** (0.180) |
0.367 (0.410) |
0.570**(0.246) | 0.628*** (0.180) |
0.447* (0.251) |
| Other religious | 0.578*** (0.203) |
0.810*** (0.180) |
0.560 (0.410) |
0.713*** (0.246) |
0.775*** (0.183) |
0.367 (0.252) |
| Other private | 0.582*** (0.215) |
0.756*** (0.187) |
0.541 (0.413) |
0.627** (0.251) |
1.078*** (0.200) |
0.526** (0.267) |
| <10% minority | 0.055 (0.053) |
−0.068 (0.052) |
0.005 (0.047) |
−0.076 (0.052) |
0.055 (0.108) |
0.271** (0.132) |
| 10–25% minority | 0.085 (0.054) |
−0.029 (0.053) |
0.008 (0.047) |
−0.066 (0.054) |
0.057 (0.110) |
0.326** (0.137) |
| 25–50% minority | 0.062 (0.054) |
−0.011 (0.053) |
0.012 (0.047) |
−0.025 (0.053) |
0.066 (0.107) |
0.262** (0.133) |
| 50–75% minority | 0.098* (0.058) |
0.062 (0.057) |
0.017 (0.052) |
−0.022 (0.058) |
0.101 (0.111) |
0.374*** (0.137) |
| >75% minority | −0.003 (0.058) |
0.068 (0.056) |
−0.054 (0.052) |
−0.021 (0.057) |
−0.016 (0.112) |
0.363*** (0.134) |
| % free lunch | −0.289*** (0.037) |
−0.010 (0.036) |
−0.279*** (0.037) |
−0.062* (0.038) |
−0.432*** (0.083) |
−0.022 (0.085) |
| Teacher characteristics | ||||||
| Age | 0.001 (0.001) |
−0.005*** (0.001) |
−0.001 (0.001) |
−0.006*** (0.001) |
−0.003* (0.001) |
−0.006*** (0.002) |
| Same race/ethnicity as child | −0.007 (0.021) |
0.027 (0.021) |
−0.035* (0.020) |
−0.022 (0.021) |
−0.054 (0.042) (0.047) |
−0.075 |
| Years teaching | 0.004*** (0.001) |
0.003** (0.001) |
0.002* (0.001) |
0.002** (0.001) |
0.005** (0.002) |
−0.001 (0.003) |
| Beyond bachelor’s degree | −0.028* (0.015) |
0.012 (0.016) |
−0.011 (0.016) |
−0.025 (0.017) |
−0.027 (0.031) |
0.089*** (0.034) |
| Constant | −5.246*** (0.336) |
−4.507*** (0.335) |
−6.544*** (0.330) |
−4.599*** (0.326) |
−7.507*** (0.975) |
−5.026*** (1.205) |
| N | 56,967 | 56,967 | 47,520 | 47,520 | 12,589 | 12,589 |
Notes: Shown are estimates (standard errors) for the control variables included in OLS regressions of a child’s test score or teacher assessment on his/her body mass index (Table 2, panel B). The omitted reference group for most sets of indicator variables is missing/no response. All regressions include fixed effects for 4 of 5 survey waves (not shown). Standard errors are robust and clustered on the child.
p < 0.1.
p < 0.05.
p < 0.01.
There are some interesting differences in how the control variables are related to test scores versus to teacher assessments. While the estimated coefficient on BMI or obese status is typically smaller (more negative) in the teacher assessment regressions than in the test score regressions, the opposite pattern generally holds for the coefficients on the female, black, and Hispanic indicator variables. Being a girl, black, or Hispanic is more positively (or less negatively) related to teacher assessments than to test scores, controlling for other factors.
Several school and teacher characteristics are related to children’s academic performance. The fraction of children at a school who receive free lunch is more negatively related to test scores than to teacher assessments. This suggests that teachers’ expectations may differ systematically across rich versus poor schools. Years of teacher experience in the grade or subject is positively related to most test scores and teacher assessments. Teacher age is negatively related to teacher assessments but unrelated to test scores except in science.
5. Discussion
The results above indicate that children’s weight is more negatively related to teacher assessments of their academic performance than to their test scores. This raises the question, are teachers and tests measuring the same thing? Why would teachers rate heavier children’s academic performance more negatively than their test scores suggest would be the case? Teacher assessments may capture a broader concept of academic performance than tests do. For example, the ECLS-K asked teachers to assess children’s writing and oral skills in addition to the analytical abilities that are the focus of the tests. However, when looking at the individual items on which teachers were asked to assess students, results not shown here indicate that heavier children had systematically lower evaluations on most items, not just on writing or oral skills.
Teachers also may be evaluating children on motivation, effort, and engagement in addition to ability, and on class participation, homework, and attendance. Heavier children, particularly those who are obese, appear to experience psychosocial difficulties, such as teasing, bullying, low self-esteem, and fewer friendships (e.g., Zeller, Reiter-Purtill, & Ramey, 2008). These difficulties may influence their academic performance in ways that teachers observe but that are not reflected on standardized tests. Data that include additional, more detailed measures of academic performance are needed to fully understand why weight is differentially related to teacher assessment and test scores.
The estimates presented here control for child, family, school, and teacher characteristics reported in the ECLS-K. The child fixed effects—the preferred specification presented here—control for unobservable child-specific factors that are time invariant. This approach does not control for any time-varying unobservable factors that are associated with changes in weight and academic performance. It also assumes that there is no reverse causality, with children’s academic performance affecting their weight. The ECLS-K offers the advantage of a relatively long-time series, with children’s observed multiple times over a nine-year span. As a result, about two-fifths of children in the sample used here experience a change in weight status. However, the ECLS-K does not have any variables that are likely to be well-correlated with children’s weight but not with their academic performance and hence good instrumental variables, such as parental weight or genetic markers (e.g., Averett & Stifel, 2010; Ding et al., 2009). Further research is needed to better ascertain the casual relationship between children’s weight and their academic outcomes.
6. Conclusion
This study examined whether children’s weight is related to their test scores and teacher assessments from kindergarten through eighth grade. The results indicate that weight is generally not significantly related to standardized test scores in reading, math, and science after controlling for child, family, school, and teacher characteristics and child, school, or teacher fixed effects. This supports previous research that concludes that weight does not affect test scores among children aged 5–12, about the ages examined here (Kaestner & Grossman, 2010). However, the results indicate that teachers rate heavier children’s academic performance in reading and math more negatively, particularly for obese children. This is consistent with previous research that reports negative effects of weight on grades among older children (Ding et al., 2009; Sabia, 2007).
The ECLS-K data used here cannot isolate why teacher assessments of heavier children’s academic performance are more negative than those children’s test scores. Understanding the causal mechanism is important given the increased prevalence of obesity among children and adolescents. Another key question is whether lower teacher assessments actually translate into lower grades, a measure not available in the ECLS-K because of the relatively young age of the children. Knowing whether the pattern found here carries on into high school and post-secondary education, and if so, why, are areas for future work. The importance of human capital accumulation and the high prevalence of obesity among American youth make the intersection between the two a vital area for ongoing research.
Appendix A
Footnotes
The research was supported by the NICHD, grant number G11 HD054966-02. John Cawley and seminar participants at Furman University gave helpful comments on an earlier version of this paper.
The Centers for Disease Control formerly recommended that children be classified as “overweight” or “at risk for overweight” and not as obese. They have switched to using “overweight” and “obese,” and this study follows that convention.
Veldwijk et al. (2012) examine the relationship between weight and test scores among Dutch 12 year olds. They also examine teacher recommendations of children’s secondary educational level, which are based in part on the test scores. They do not find a significant relationship between weight and either test scores or teacher recommendations after controlling for other observable characteristics.
According to the ECLS-K, “IRT uses the pattern of right, wrong, and omitted responses to the items actually administered in an assessment and the difficulty, discriminating ability, and ‘guess-ability’ of each item to place each child on a continuous ability scale” (Tourangeau et al., 2009: 3–6).
In kindergarten through fifth grade, a score of one indicates that a child has “not yet” demonstrated a skill, knowledge, or behavior while a score of five indicates that a child is “proficient” and demonstrates a skill, knowledge, or behavior “competently and consistently.” The intermediate categories are “beginning,” “in progress,” and “intermediate.” In eighth grade, the lowest score indicates “poor” ability while the highest score indicates “outstanding” ability. The intermediate categories are “fair,” “good,” and “very good.”
Kindergarten and first grade teachers were asked to assess “achievement and motivation,” not just achievement.
This study uses BMI in levels instead of z-scores (which indicate where children’s BMI falls in a normal distribution) because BMI scores better capture changes over time for the heaviest children, whose z-scores vary relatively little over time (Cole, Faith, Pietrobelli, & Heo, 2005). Results using z-scores show a pattern qualitatively similar to results using BMI. All results discussed but not presented in tables are available on request.
For children with missing values for a control variable, the value was imputed as zero and a dummy variable was set equal to one. Dummy variables were created for missing categorical variables as well and typically are the omitted reference group. The variable for teacher and child being the same race/ethnicity is one if they are both white or are both non-white, and zero otherwise; more detailed teacher race/ethnicity is suppressed most waves.
The science results with child fixed effects do not show the same pattern as the reading and math results, likely because those data include only three waves, with correspondingly fewer changes in weight status and a smaller sample size.
References
- Anderson PM, Butcher KF, Levine PB. Maternal employment and overweight children. Journal of Health Economics. 2003;22(3):477–504. doi: 10.1016/S0167-6296(03)00022-5. [DOI] [PubMed] [Google Scholar]
- Averett S, Korenman S. The economic reality of the beauty myth. Journal of Human Resources. 1996;31(2):304–330. [Google Scholar]
- Averett SL, Stifel DC. Food for thought: The cognitive effects of childhood malnutrition in the United States. Mimeo: Lafayette College Department of Economics; 2007. [Google Scholar]
- Averett SL, Stifel DC. Race and gender differences in the cognitive effects of childhood overweight. Applied Economics Letters. 2010;17(3):1673–1679. [Google Scholar]
- Bogaert N, Steinbeck KS, Baur LA, Brock K, Bermingham MA. Food, activity and family—environmental vs biochemical predictors of weight gain in children. European Journal of Clinical Nutrition. 2003;57(10):1242–1249. doi: 10.1038/sj.ejcn.1601677. [DOI] [PubMed] [Google Scholar]
- Case A, Paxson C. Stature and status: Height, ability, and labor market outcomes. Journal of Political Economy. 2008;116(3):499–532. doi: 10.1086/589524. [DOI] [PMC free article] [PubMed] [Google Scholar]
- Cawley J. The impact of obesity on wages. Journal of Human Resources. 2004;39(2):451–474. [Google Scholar]
- Cawley J, Liu F. Maternal employment and childhood obesity: A search for mechanisms in time use data. Economics and Human Biology. 2012;10(4):352–364. doi: 10.1016/j.ehb.2012.04.009. [DOI] [PubMed] [Google Scholar]
- Cole TJ, Faith MS, Pietrobelli A, Heo M. What is the best measure of adiposity change in growing children: BMI, BMI%, BMI z-score or BMI centile? European Journal of Clinical Nutrition. 2005;59(3):419–425. doi: 10.1038/sj.ejcn.1602090. [DOI] [PubMed] [Google Scholar]
- Cornwell CM, Mustard DB, Van Parys J. Noncognitive skills and the gender disparities in test scores and teacher assessments: Evidence from primary school. Journal of Human Resources. 2013;48(1):236–264. [Google Scholar]
- Crosnoe R, Muller C. Body mass index, academic achievement, and school context: Examining the educational experiences of adolescents at risk of obesity. Journal of Health and Social Behavior. 2004;45(4):393–407. doi: 10.1177/002214650404500403. [DOI] [PubMed] [Google Scholar]
- Cutler DM, Glaeser EL, Shapiro JM. Why have Americans become more obese? Journal of Economic Perspectives. 2003;17(3):93–118. [Google Scholar]
- Datar A, Sturm R. Childhood overweight and elementary school outcomes. International Journal of Obesity. 2006;30(9):1449–1460. doi: 10.1038/sj.ijo.0803311. [DOI] [PubMed] [Google Scholar]
- Datar A, Sturm R, Magnabosco JL. Childhood overweight and academic performance: National study of kindergartners and first-graders. Obesity Research. 2004;12(1):58–68. doi: 10.1038/oby.2004.9. [DOI] [PubMed] [Google Scholar]
- Deaton A, Arora R. Life at the top: The benefits of height. Economics and Human Biology. 2009;7(2):133–136. doi: 10.1016/j.ehb.2009.06.001. [DOI] [PMC free article] [PubMed] [Google Scholar]
- Dietz WH. Health consequences of obesity in youth: Childhood predictors of adult disease. Pediatrics. 1998;101(3 Pt 2):518L25. [PubMed] [Google Scholar]
- Ding W, Lehrer SF, Rosenquist JN, Audrain-McGovern J. The impact of poor health on academic performance: New evidence using genetic markers. Journal of Health Economics. 2009;28(3):578–597. doi: 10.1016/j.jhealeco.2008.11.006. [DOI] [PubMed] [Google Scholar]
- Donnelly JE, Lambourne K. Classroom-based physical activity, cognition, and academic achievement. Preventive Medicine. 2011;51(S1):S36–S42. doi: 10.1016/j.ypmed.2011.01.021. [DOI] [PubMed] [Google Scholar]
- Eide ER, Showalter MH, Goldhaber DD. The relation between children’s health and academic achievement. Children and Youth Services Review. 2010;32(2):231–238. [Google Scholar]
- Fagot-Campagna A, Narayan KMV, Imperatore G. Type 2 diabetes in children. British Medical Journal. 2001;322(7283):377–378. doi: 10.1136/bmj.322.7283.377. [DOI] [PMC free article] [PubMed] [Google Scholar]
- Friedlander SL, Larkin EK, Rosen CL, Palermo TM, Redline S. Decreased quality of life associated with obesity in school-aged children. Archives of Pediatric and Adolescent Medicine. 2003;157(12):1206–1211. doi: 10.1001/archpedi.157.12.1206. [DOI] [PubMed] [Google Scholar]
- Gallagher D, Visser M, Sepulveda D, Pierson RN, Harris T, Heymsfield SB. How useful is body mass index for comparison of body fatness across age, sex, and ethnic groups? American Journal of Epidemiology. 1996;143(3):228–239. doi: 10.1093/oxfordjournals.aje.a008733. [DOI] [PubMed] [Google Scholar]
- Han E, Norton EC, Powell LM. Direct and indirect effects of teenage body weight on adult wages. Economicss & Human Biology. 2011;9(4):381–392. doi: 10.1016/j.ehb.2011.07.002. [DOI] [PubMed] [Google Scholar]
- Hayden-Wade HA, Stein RI, Ghaderi A, Saelens BE, Zabinski MF, Wilfley DE. Prevalence, characteristics, and correlates of teasing experiences among overweight children vs. non-overweight peers. Obesity Research. 2005;13(8):1381–1392. doi: 10.1038/oby.2005.167. [DOI] [PubMed] [Google Scholar]
- Johnson-Taylor WL, Everhart JE. Modifiable environmental and behavioral determinants of overweight among children and adolescents. Obesity. 2006;14(6):929–966. doi: 10.1038/oby.2006.109. [DOI] [PubMed] [Google Scholar]
- Kaestner R, Grossman M. Effects of weight on children’s educational achievement. Economics of Education Review. 2010;28(6):651–661. [Google Scholar]
- Luder E, Melnik TA, DiMaio M. Association of being overweight with greater asthma symptoms in inner city black and Hispanic children. Journal of Pediatrics. 1998;132(4):699–703. doi: 10.1016/s0022-3476(98)70363-4. [DOI] [PubMed] [Google Scholar]
- Manson JE, Skerrett PJ, Greenland P, VanItallie TB. The escalating pandemics of obesity and sedentary lifestyle. Archives of Internal Medicine. 2004;164(3):249–258. doi: 10.1001/archinte.164.3.249. [DOI] [PubMed] [Google Scholar]
- Mocan NH, Tekin E. Obesity, self-esteem and wages. In: Grossman M, Mocan NH, editors. Economic aspects of obesity. Chicago: University of Chicago Press; 2011. pp. 349–380. [Google Scholar]
- Nead KG, Halterman JS, Kaczorowski JM, Auinger P, Weitzman M. Overweight children and adolescents: A risk group for iron deficiency. Pediatrics. 2004;114(1):104–108. doi: 10.1542/peds.114.1.104. [DOI] [PubMed] [Google Scholar]
- Neumark-Sztainer D, Story M. Beliefs and attitudes about obesity among teachers and school health care providers working with adolescents. Journal of Nutrition Education. 1999;31(1):3–9. [Google Scholar]
- Price JH, Desmond SM, Stelzer CM. Elementary school principals’ perceptions of childhood obesity. Journal of School Health. 1987;57(9):367–370. doi: 10.1111/j.1746-1561.1987.tb03225.x. [DOI] [PubMed] [Google Scholar]
- Sabia J. The effect of body weight on adolescent academic performance. Southern Economic Journal. 2007;73(4):871–900. [Google Scholar]
- Stifel DC, Averett SL. Childhood overweight in the US: A quantile regression approach. Economics and Human Biology. 2009;7(3):387–397. doi: 10.1016/j.ehb.2009.05.005. [DOI] [PubMed] [Google Scholar]
- Storch EA, Milsom VA, DeBraganza N, Lewin AB, Geffken GR, Silverstein JH. Peer victimization, psychosocial adjustment, and physical activity in overweight and at-risk-for-overweight youth. Journal of Pediatric Psychology. 2007;32(1):80–89. doi: 10.1093/jpepsy/jsj113. [DOI] [PubMed] [Google Scholar]
- Strauss RS. Childhood obesity and self-esteem. Pediatrics. 2000;105(1):e15. doi: 10.1542/peds.105.1.e15. [DOI] [PubMed] [Google Scholar]
- Taras H. Nutrition and student performance in school. Journal of School Health. 2005;75(6):199–213. doi: 10.1111/j.1746-1561.2005.00025.x. [DOI] [PubMed] [Google Scholar]
- Thompson DR, Obarzanek E, Franko DL, Barton BA, Morisson J, Bro FM, et al. Childhood overweight and cardiovascular disease risk factors: The National Heart, Lung, and Blood Institute growth and health data. Journal of Pediatrics. 2007;150(1):18–25. doi: 10.1016/j.jpeds.2006.09.039. [DOI] [PMC free article] [PubMed] [Google Scholar]
- Tourangeau K, Nord C, Lê T, Pollack JM, Atkins-Burnett S. Early Childhood Longitudinal Study, Kindergarten Class of 1998–99 (ECLS-K), combined user’s manual for the ECLS-K fifth-grade data files and electronic codebooks (NCES 2006-032). US Department of Education. Washington, DC: National Center for Education Statistics; 2006. [Google Scholar]
- Tourangeau K, Nord C, Lê T, Pollack JM, Atkins-Burnett S. Early Childhood Longitudinal Study, Kindergarten Class of 1998–99 (ECLS-K), combined user’s manual for the ECLS-K eighth-grade and K-8 data files and electronic codebooks (NCES 2009-004). US Department of Education. Washington, DC: National Center for Education Statistics; 2009. [Google Scholar]
- Veldwijk J, Fries MCE, Bemelmans WJE, Haveman-Nies A, Smit HA, Koppelman GH, et al. Overweight and school performance among primary school children: The PIAMA birth cohort study. Obesity. 2012;20(3):590–596. doi: 10.1038/oby.2011.327. [DOI] [PubMed] [Google Scholar]
- Wang G, Dietz WH. Economic burden ofobesityin youths aged 6 to 17 years: 1979–1999. Pediatrics. 2002;109(5):109–114. doi: 10.1542/peds.109.5.e81. [DOI] [PubMed] [Google Scholar]
- Zeller MH, Reiter-Purtill J, Ramey C. Negative peer perceptions of obese children in the classroom environment. Obesity. 2008;16(4):755–795. doi: 10.1038/oby.2008.4. [DOI] [PMC free article] [PubMed] [Google Scholar]