Abstract
In all, 651 from 680 centers in 48 countries reported 35 660 hematopoietic SCT (HSCT) in 32 075 patients (13 470 allogeneic (42%), 18 605 autologous (58%)) to the 2011 survey. Main indications were: leukemias; 10 113 (32% 94% allogeneic); lymphoid neoplasias; non-Hodgkin's lymphoma, Hodgkin's lymphoma, plasma cell disorders; 18 433 (57% 12% allogeneic); solid tumours; 1573 (5% 5% allogeneic); and non-malignant disorders; 1830 (6% 92% allogeneic). There were more unrelated donors than HLA identical sibling donors (54% versus 39%); proportion of peripheral blood as stem cell source was 99% for autologous and 73% for allogeneic HSCT. Cord blood was only used in allogeneic transplants (6% of total). In the past 10 years, the overall number of transplants has increased by 53%. Allogeneic HSCT have doubled (from 7272 to 14 549) while, autologous have increased by 32% and continue to increase by about 1100 HSCT per year since 2001. In the past 2 years, an increase of >2000 HSCT per year was seen. Transplant activity is shown by team size. For allogeneic HSCT, we show use of reduced-intensity conditioning versus myeloablative conditioning across Europe and use of post-transplant donor lymphocyte infusions with considerable variation across different countries.
Keywords: haematopoietic SCT, reduced-intensity conditioning, transplant rates, trends, indications
Introduction
Hematopoietic SCT (HSCT) is an established procedure for many acquired and congenital disorders of the hematopoietic system.1, 2, 3, 4 Forecasts predict an on-going increase in HSCT in the near future. The annual activity survey, describing the status of HSCT in Europe, has become an instrument used to observe trends and to monitor changes in technology use.5, 6, 7, 8, 9, 10 The survey captures the numbers of HSCT performed in the preceding year from each participating team, split by indication, donor type and stem cell source. The standardized structure of the survey over many years and the excellent commitment by the participating teams allows us to observe changes over time and to evaluate factors associated with such changes. More recently, the survey has included information on cellular transplants with hematopoietic stem cells for non-hematopoietic use, as well as on the use of non-hematopoietic stem and progenitor cells.11 This coincides with the recent interest of the World Health Organization (www.who.org) in cell and tissue transplants and further stresses the need for adequate and timely information.12
The European Group for Bone Marrow Transplantation (EBMT) analyses in previous years have shown an increase in the annual absolute HSCT numbers and transplant rates (number of HSCT/10 million inhabitants) of about 4–13% (median 8%) for allogeneic and of 1.5–9.5% (median 4%) for autologous HSCT.
This report is based on the 2011 survey data. In addition to transplant rates and indications, stem cell source and donor type in allogeneic HSCT, we provide data on proportions of transplants done in low, intermediate and high transplanting centers and data on important differences among countries in the use of reduced intensity (RIC) versus myeloablative conditioning and in the use of DLI post transplant for recipients of allogeneic HSCT.
Patients and methods
Data collection and validation
Participating teams were requested to report data for 2011 by indication, stem cell source and donor type as listed in Table 1. Quality control measures included several independent systems: confirmation of validity of the entered data by the reporting team, selective comparison of the survey data with MED-A data sets in the EBMT Registry database, cross-checking with the National Registries and onsite visits of selected teams.
Table 1. Numbers of hematopoietic SCTs in Europe 2011 by indication, donor type and stem cell source.
|
HLA-identical sibling |
Mis-matched relative |
Unrelated |
Autologous |
Total |
|||||||||
|---|---|---|---|---|---|---|---|---|---|---|---|---|---|
| BM | PB | CB | BM | PB | CB | BM | PB | CB | BM | PB | Allogeneic | Autologous | |
| Leukemias | 756 | 2880 | 8 | 151 | 312 | 4 | 841 | 4016 | 503 | 28 | 614 | 9471 | 642 |
| AML | 316 | 1417 | 4 | 76 | 163 | 302 | 1897 | 230 | 25 | 482 | 4405 | 507 | |
| Early disease | 230 | 974 | 2 | 30 | 80 | 182 | 991 | 120 | 20 | 413 | 2609 | 433 | |
| Advanced disease | 86 | 443 | 2 | 46 | 83 | 120 | 906 | 110 | 5 | 69 | 1796 | 74 | |
| ALL | 283 | 585 | 3 | 44 | 90 | 3 | 306 | 619 | 164 | 1 | 75 | 2097 | 76 |
| Early disease | 179 | 403 | 19 | 38 | 170 | 382 | 78 | 1 | 55 | 1269 | 56 | ||
| Advanced disease | 104 | 182 | 3 | 25 | 52 | 3 | 136 | 237 | 86 | 20 | 828 | 20 | |
| CML | 38 | 118 | 3 | 13 | 1 | 29 | 173 | 16 | 1 | 391 | 1 | ||
| Early disease | 23 | 42 | 1 | 7 | 15 | 69 | 6 | 163 | |||||
| Advanced disease | 15 | 76 | 2 | 6 | 1 | 14 | 104 | 10 | 1 | 228 | 1 | ||
| Myelodysplastic disorders | 98 | 464 | 20 | 37 | 160 | 866 | 75 | 1 | 13 | 1720 | 14 | ||
| Myeloproliferative disorders | 11 | 114 | 1 | 5 | 2 | 18 | 193 | 10 | 354 | ||||
| CLL | 10 | 182 | 3 | 7 | 26 | 268 | 8 | 1 | 43 | 504 | 44 | ||
| Lymphoproliferative disorders | 80 | 783 | 54 | 50 | 101 | 1001 | 66 | 75 | 16 223 | 2135 | 16 298 | ||
| Plasma cell—myeloma | 25 | 219 | 2 | 10 | 29 | 280 | 13 | 15 | 8326 | 578 | 8341 | ||
| Plasma cell—other | 2 | 10 | 1 | 17 | 3 | 245 | 33 | 245 | |||||
| Hodgkin's lymphoma | 11 | 140 | 31 | 14 | 15 | 134 | 13 | 21 | 2045 | 358 | 2066 | ||
| Non-Hodgkin's lymphoma | 42 | 414 | 21 | 26 | 56 | 570 | 37 | 39 | 5607 | 1166 | 5646 | ||
| Solid tumors | 9 | 8 | 1 | 40 | 8 | 5 | 3 | 66 | 1433 | 74 | 1499 | ||
| Neuroblastoma | 6 | 1 | 23 | 4 | 2 | 3 | 31 | 402 | 39 | 433 | |||
| Soft tissue sarcoma | 1 | 7 | 1 | 1 | 4 | 37 | 10 | 41 | |||||
| Germinal tumors | 1 | 4 | 351 | 1 | 355 | ||||||||
| Breast cancer | 1 | 54 | 1 | 54 | |||||||||
| Ewing | 1 | 2 | 1 | 4 | 1 | 2 | 9 | 211 | 11 | 220 | |||
| Other solid tumors | 2 | 2 | 6 | 2 | 18 | 378 | 12 | 396 | |||||
| Non-malignant disorders | 577 | 260 | 37 | 75 | 107 | 1 | 311 | 187 | 137 | 11 | 127 | 1692 | 138 |
| BM failure—SAA | 200 | 130 | 3 | 11 | 19 | 128 | 82 | 22 | 595 | ||||
| BM failure—other | 51 | 17 | 4 | 6 | 6 | 44 | 24 | 12 | 164 | ||||
| Hemoglobinopathies—thalassemia | 150 | 59 | 11 | 21 | 24 | 21 | 10 | 5 | 301 | ||||
| Hemoglobinopathies—other | 51 | 25 | 10 | 5 | 4 | 6 | 3 | 2 | 106 | ||||
| Primary Immune deficiencies | 88 | 20 | 6 | 26 | 38 | 1 | 75 | 53 | 56 | 6 | 5 | 363 | 11 |
| Inherited disorders of Metabolism | 34 | 7 | 3 | 6 | 15 | 32 | 12 | 37 | 4 | 4 | 146 | 8 | |
| Auto immune disease | 3 | 2 | 1 | 5 | 3 | 3 | 1 | 118 | 17 | 119 | |||
| Others | 28 | 10 | 1 | 2 | 5 | 14 | 26 | 12 | 28 | 98 | 28 | ||
| Total Patients | 1450 | 3941 | 46 | 283 | 514 | 5 | 1275 | 5235 | 721 | 180 | 18 425 | 13 470 | 18 605 |
| Additional transplants | 44 | 286 | 43 | 137 | 1 | 55 | 453 | 60 | 6 | 2500 | 1079 | 2506 | |
| Total Transplants | 1494 | 4227 | 46 | 326 | 651 | 6 | 1330 | 5688 | 781 | 186 | 20 925 | 14 549 | 21 111 |
Abbreviations: CB=cord blood; PB=peripheral blood; SAA=severe aplastic anemia.
Teams
A total of 680 centers from 48 countries were contacted for the 2011 survey (39 European and 9 affiliated countries); of which 651 teams from 46 countries (37 European, 9 affiliated countries) reported their numbers. This corresponds to a 96% return rate and includes 537 active EBMT member teams. Fourteen active teams failed to report in 2011 while 15 teams reported no activity due to transplant program development or closure.
Contacted teams are listed in the appendix in alphabetical order by country, city, EBMT center code, with their reported numbers of first and total HSCT and of first allogeneic and autologous HSCT. The WHO regional office definitions (www.who.org) were used to classify countries as European or Non-European. According to information received, there were no blood or marrow transplants performed in Albania, Andorra, Armenia, Georgia, Liechtenstein, Malta, Moldavia, Monaco, Montenegro and San Marino in 2011. Nine non-European countries participated in the 2011 EBMT survey: Algeria, Iran, Israel, Jordan, Lebanon, Nigeria, Saudi Arabia, South Africa and Tunisia. Their data, 6% of the total data set, are included in all the analyses.
Definitions
Patient and transplant numbers
Wherever appropriate, patient numbers corresponding to the number of patients receiving a first transplant and transplant numbers reflecting the total number of transplants performed are listed. Multiple transplants may include multiple transplants defined as subsequent transplants within a planned double or triple autologous or allogeneic transplant protocol, and retransplants (autologous or allogeneic) defined as unplanned HSCT for rejection or relapse after a previous HSCT.
Information on stem cell source includes BM, peripheral blood or cord blood; transplants with more than one source were categorized as cord blood HSCT if cord blood was present or peripheral blood HSCT if BM and peripheral blood were used. Information on use of RIC transplants, as defined by EBMT, was collected.
Information on additional cellular therapies was subdivided into: HSC for non-hematopoietic use; non-hematopoietic stem cell therapies; MSC therapies for rejection or GvHD prevention/treatment; and donor lymphocyte infusions. Collection of information was harmonized with similar surveys carried out by EULAR (European League against Rheumatism; www.eular.org) and TERMIS-EU (Tissue Engineering and Regenerative Medicine International Society; www.termis.org).11
Transplant rates
Transplant rates, defined as numbers of HSCT per 10 million inhabitants, were computed for each country without adjustments for patients who crossed borders and received their HSCT in a foreign country. Population numbers were obtained from the US census bureau database (http://www.census.gov/population/international/data/idb/rank.php).
Analysis
Wherever appropriate, absolute numbers of transplanted patients or transplants or transplant rates are shown for specific countries, indications or transplant techniques. Team size was defined as low, intermediate or high based on 1–25, 25–75 and >75 patients transplanted. Team size was defined separately for autologous and allogeneic HSCT. To estimate the percentage of allogeneic HSCT done using a RIC regimen and the percentage of allogeneic HSCT that are followed by a DLI, the transplant years 2008–2011 were averaged and compared across countries. For this comparison, only countries with >100 allogeneic HSCT annually were included.
Results
2011 Data
Participating teams in 2011
Of the 651 teams, 403 (62%) did both allogeneic and autologous transplants; 226 (35%) restricted their activity to autologous HSCT only and 12 teams (2%) to allogeneic transplants only. Ten teams (1%) reported having performed no transplants in 2011. The list of the participating teams can be downloaded as a Supplementary informaton file online.
Numbers of patients and transplants
A total 32 075 patients were transplanted in 2011. Of these, the first transplant for 13 470 (42%) was allogeneic, while the first transplant for 18 605 (58%) was autologous.
Furthermore, there were 2073 re-transplants (1018 allogeneic/1055 autologous) and 1512 multiple transplants (61 allogeneic/1451 autologous), bringing the total to 35 660 HSCT procedures, 14 549 allogeneic (41%) and 21 111 autologous (59%) performed in 2011, which is an increase of 7% compared with 2010.13
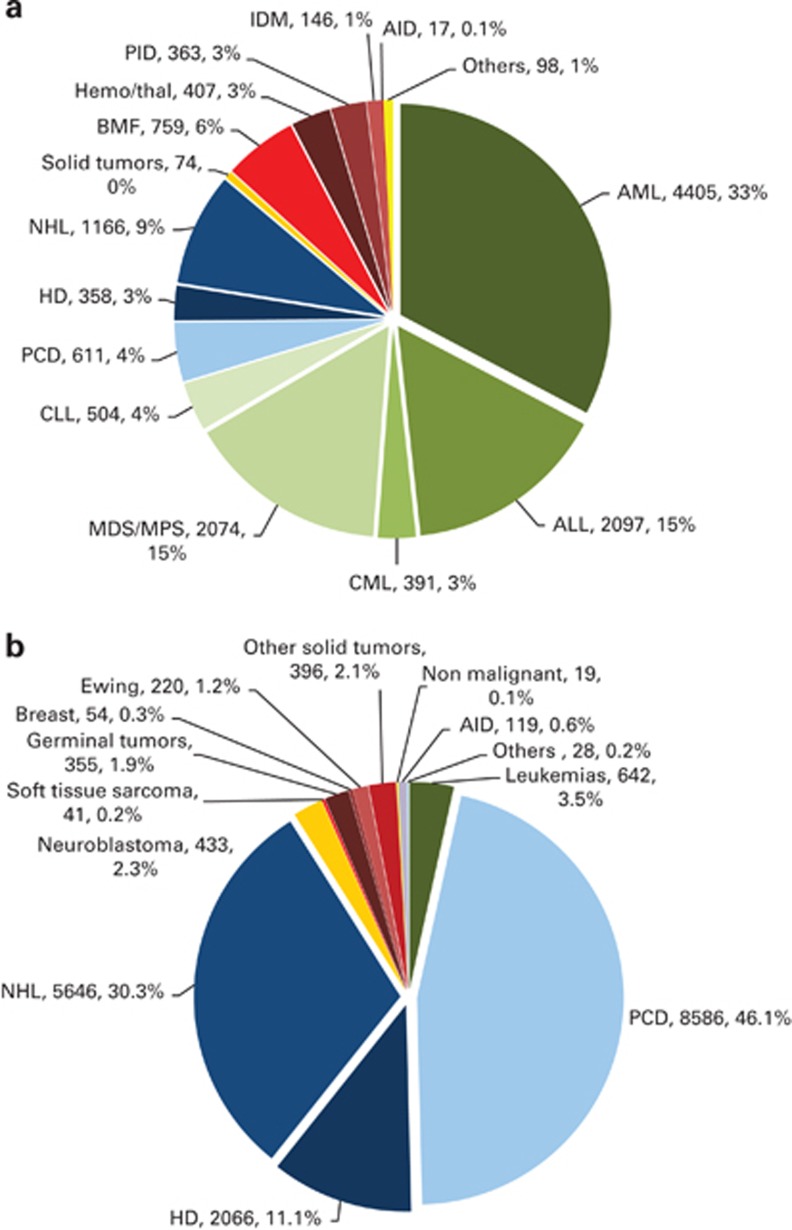
Indications for HSCT in 2011 are listed in detail in Table 1 and their distribution is illustrated in Figures 1a and b: allogeneic HSCT and autologous HSCT, respectively. Main indications were lymphoid neoplasias, including non-Hodgkin's lymphoma, Hodgkin's lymphoma and plasma cell disorders, leukemias, solid tumours and non-malignant disorders. As seen in previous years, the majority of HSCT for lymphoid malignancies were autologous while leukemia is treated more commonly using stem cells from allogeneic donors. Autologous HSCT for non-malignant disorders predominantly include patients with autoimmune disorders.
Figure 1.
Absolute numbers and relative proportions of indications for an HSCT in Europe in 2011. (a) Proportions of disease indications for an allogeneic HSCT in Europe in 2011. (b) Proportions of disease indications for an autologous HSCT in Europe in 2011. BMF=bone marrow failure; HD= Hodgkin's disease; IDM=inherited disorders of metabolism; MDS=myelodysplastic syndrome; MPS=myeloproliferative syndrome; NHL=non-Hodgkin's lymphoma; PCD=plasma cell disroder; PID=primary immunodeficiency.
As compared with the previous year, the total number of transplants increased by 6.9% (9% allogeneic HSCT and 5.5% autologous HSCT). The number of unrelated donor transplants increased by 10% from 7098 to 7799.13 Areas of important changes in transplant activity were an increase in AML first remission allo HSCT by 14%, and in more advanced disease by 9%, and an increase in myelodysplastic syndrome/secondary AML allogeneic HSCT by 20%. Allogeneic HSCT for CLL increased by 24%, there was a decrease of myeloproliferative neoplasm allogeneic HSCT by 26% and for CML not in chronic phase by 11%. In non-malignant diseases, there was an increase in allogeneic HSCT for aplastic anemia by 19%, for thalassemia by 39%, primary immune deficiencies by 10% and in inherited disorders of metabolism by 33%. For autologous transplants, the main increase could be seen for plasma cell disorders (10%) and non-Hodgkin's disorder (3%) while the autoimmune disorders decreased by 20%, but in general, the changes in trends for autologous HSCT were much less dramatic.
Stem cell source and donor type
There were clear differences in the use of stem cell source between autologous and allogeneic HSCT. Of the 21 111 autologous transplants, 186 (1%) were BM derived and 20 925 (99%) were derived from peripheral blood stem cells or from combined peripheral blood and BM.
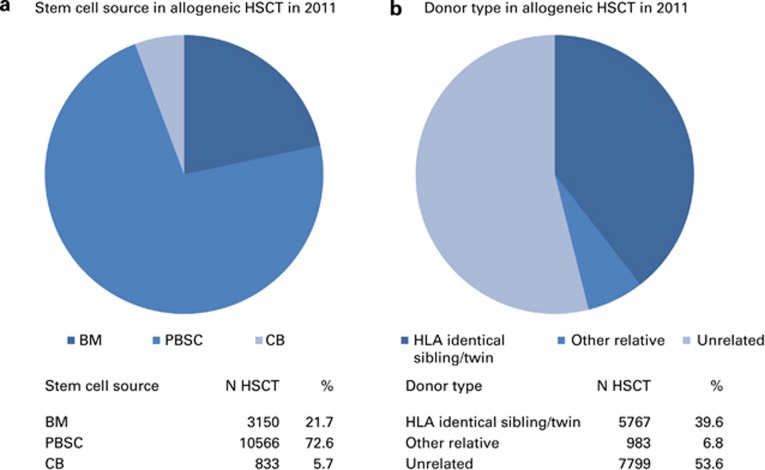
Of the 14 549 allogeneic transplants, 3150 (22%) were BM, 10 566 (72%) were peripheral blood and 833 (6%) were cord blood transplants (Figure 2a). Cord blood was used as the stem cell source for 46 (0.8%) of HLA-identical siblings, 6 (0.6%) from other family members and 781 (10%) of unrelated donors. No autologous cord blood HSCT was reported for 2011. The highest incidence of cord blood transplants from unrelated donors was seen in France, Spain and Italy: 424 (54% of all unrelated cord blood HSCT).
Figure 2.
Donor type and stem cell source in allogeneic HSCT. (a) Stem cell source in allogeneic HSCT in 2011. (b) Donor type in allogeneic HSCT in 2011. CB=cord blood.
The choice of stem cell source differed by main indication for all types of allogeneic HSCT. BM remained the preferred source of stem cells for allogeneic transplants for non-malignant disorders (57%).
Donors for the 14 549 allogeneic HSCT were HLA-identical siblings (5677 (39%) BM or peripheral blood donors; 46 (0.0.3%) targeted cord blood HSCT), other family members (983; 7%), syngeneic twin donors (44; 0.3%), unrelated BM or peripheral blood donors (7,018; 48%) or unrelated cord blood donors (781; 5%) Figure 2b). The percentage of unrelated donor HSCT continues to increase and has reached 54% of all allogeneic HSCT in 2011.14
RIC
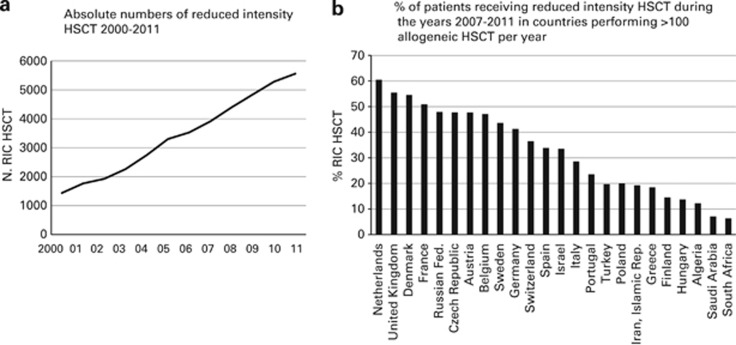
Numbers of RIC HSCT continued to increase from 1436 in 2000 to 5567 in 2011 (Figure 3a).15 RIC conditioning was used for 38% of all allogeneic HSCT, a proportion similar to that of last year's survey. In countries performing >100 allogeneic HSCT per year, the highest percentage of RIC HSCT was seen in the Netherlands (60%). In the United Kingdom, Denmark and France >50% of allogeneic HSCT were performed using RIC but the percentages vary widely with some countries having <20% of transplants done with RIC conditioning (Figure 3b).
Figure 3.
RIC in allogeneic HSCT. (a) Absolute numbers of RIC HSCT 2000–2011. (b) Percentage of patients receiving RIC HSCT during the years 2007–2011 in countries performing >100 allogeneic HSCT per year.
Donor lymphocyte infusions
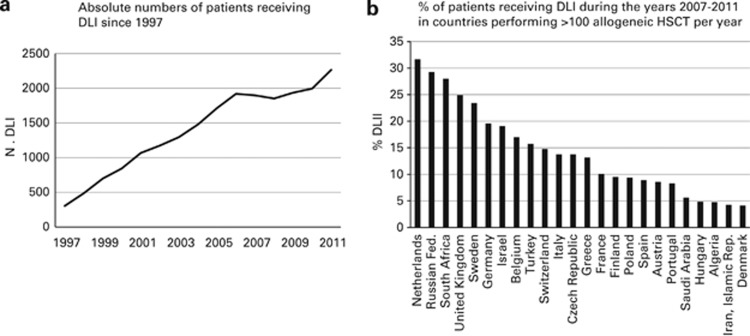
In 1997, 305 patients were reported as having received DLI infusions after transplant; this has increased to 2279 in 2011 and corresponds to 16% of patients with an allogeneic HSCT (Figure 4a). In countries performing >100 HSCT per year, the highest percentage of allogeneic HSCT receiving DLI post transplant can be seen in the Netherlands (32%), with a number of countries in which <5% of transplants are followed by DLI (Figure 4b).
Figure 4.
DLI in allogeneic HSCT. (a) Absolute numbers of patients receiving DLI since 1997. (b) Percentage of patients receiving DLI during the years 2007–2011 in countries performing >100 allogeneic HSCT per year.
Additional cellular therapies
In all, 28 teams from 13 countries reported having treated 281 patients with hematopoietic stem cells for non-hematopoietic use in 2011. The main indications were cardiovascular, 190 (all autologous); neurological, 26 (4 autologous); tissue repair, 55 (50 autologous) and epithelial: 10 (9 autologous). In addition, 330 patients in 71 teams and 16 countries received MSCs for prevention/treatment of GvHD (248), prevention/treatment of graft failure (59) and for unspecified reasons (23).
Transplant rates and team size
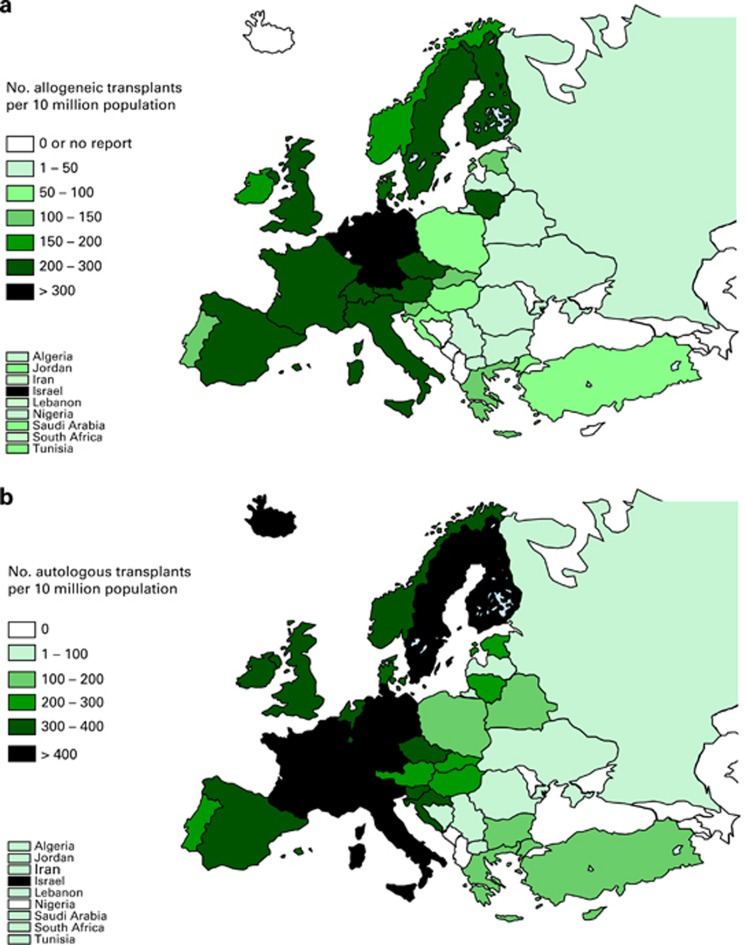
Transplant rates differed substantially between participating European countries (Figure 5a: allogeneic HSCT; Figure 5b: autologous HSCT). These differences related to all types of HSCT.
Figure 5.
Transplant rates in Europe (=total number of HSCT per 10 million inhabitants) by participating country. (a) Allogeneic transplant rates per10 million population in 2011. (b) Autologous transplant rates per 10 million population in 2011.
Transplant rates per 10 million inhabitants for autologous HSCT vary from 14.2 in Ukraine to 519 in Italy, median 151. Transplant rates for allogeneic HSCT vary from either 0 in several countries or 1.3 in Ukraine to 547 in Israel and 380 in Germany, median 109.
To illustrate the impact of team size, transplant teams were grouped into low (1–25 HSCT) intermediate (25–75) HSCT and high (more than 75 HSCT) teams separately for autologous and allogeneic procedures.
In all, 415 of the 651 teams reporting in 2011 performed an allogeneic HSCT in 2011, 203 teams (49% and 2594 HSCT) reported <25 transplants, 169 teams (41% and 7219 HSCT); 25–75 HSCT and 43 teams (10% and 4736 HSCT) performed >75 HSCT in 2011.
Also, 629 of the 651 teams reporting in 2011 performed an autologous HSCT in 2011, 304 teams (48% and 3691 HSCT) reported <25 transplants, 267 teams (43% and 11 643 HSCT); 25–75 HSCT and 58 teams (9% and 5777 HSCT) performed >75 HSCT in 2011. Data are shown in Table 2. It is evident that close to half of the teams fall into the category of low-frequency teams performing <20% of all transplants, be they autologous or allogeneic HSCTs.
Table 2. Numbers of teams and transplants by size category; low, intermediate and high.
| Team size | No. of teams | Percentage of total teams | No. of HSCT | Percentage of total transplants | Median (range) HSCT per team | |
|---|---|---|---|---|---|---|
| Allogeneic | ||||||
| Low | <25 HSCT per team | 203 | 49 | 2594 | 18 | 13 (1–25) |
| Intermediate | 25–75 HSCT per team | 169 | 41 | 7219 | 49 | 40 (26–74) |
| High | >75 HSCT per team | 43 | 10 | 4736 | 33 | 97 (77–287) |
| Total | 415 | 14 549 | ||||
| Autologous | ||||||
| Low | <25 HSCT per team | 304 | 48 | 3691 | 18 | 12 (1–25) |
| Intermediate | 25–75 HSCT per team | 267 | 43 | 11643 | 55 | 42 (26–74) |
| High | >75 HSCT per team | 58 | 9 | 5777 | 27 | 93 (76–227) |
| Total | 629 | 21 111 | ||||
Abbreviation: HSCT=hematopoietic SCT.
Discussion
The EBMT activity survey has been conducted annually since 1990. The 2010 survey had, for the first time, reported >30 000 patients transplanted in a given year. This trend continues with an additional increase by 7% in 2011. This 2011 report is on 35 660 transplants.
HSCT continues to increase for some indications but not for others. Of interest is an important growth of allogeneic HSCT for myelodysplastic syndrome, CLL and for non-malignant disorders, in particular marrow failure and inherited disorders of metabolism. Some indications are decreasing, such as allogeneic transplants for myeloproliferative neoplasias. This is possibly due to the development of new drugs such as janus kinase 2 inhibitors. A success of these drugs may result in decreasing needs for transplant in these diseases similar to the effect the development of tyrosine kinase inhibitors (TKI) had on transplant rates for CML. Of interest, CML was the main indication for allogeneic HSCT in the 1990s, and the highest number of allogeneic HSCT for CML was 1396 in 1999, whereas in 2011 the number of transplants had reduced to 391, which corresponds to 1/4 of the activity before tyrosine kinase inhibitor availability.
We show data on the use of RIC for allogeneic HSCT and in the use of DLI after allogeneic HSCT. Of interest is the wide variation in the use of RIC conditioning and of DLI, which varies widely across countries. As we do not know the precise indications for the choice of these interventions, the appropriateness cannot be analyzed. Discrepancies have to be discussed, however, and there appears to be a need for more standardization in the field as differences up to threefold in the use of a given technology must be considered as evidence for uncertainty about appropriate use.
Finally, there is a description of 2011 transplants by team size. It is obviously beyond the scope of this paper to discuss in detail appropriateness of decision by health planners on how transplant units are established, but we have to acknowledge the fact that approximately half of the centers fall into the category of low-frequency centers with <25 HSCTs in a given category (allogeneic and autologous HSCTs being analyzed separately) and that these low-frequency centers perform <20% of all HSCTs. In a previous paper by the EBMT activity survey, the relationship between transplant rates and team density have been discussed.5 The principles of concentrating activity to few centers in order to maintain the highest degrees of team experience and as a consequence better treatment quality, which also needs to be proven, versus the principle of easy access to care, proximity of patients to the nearest transplant center and as a consequence smaller team size, cannot be easily resolved.
Last, in spite of the economic crisis in Europe, there does not appear to be a decrease in transplant activity since 2009 but rather a continued annual increase in the use of HSCT technology.
Acknowledgments
The cooperation of all participating teams and their staff (listed in the Appendix), the EBMT Co-ordination office; Barcelona, Paris, London (C. Ruiz de Elvira, S. Hewerdine, S. Tran, P. Wilson), the Austrian Registry (ASCTR; H. Greinix, B. Lindner, C.Wagner), the Belgium Registry (Yves Beguin) the Czech BMT Registry (K. Benesova, M. Trnkova), the French Registry (SFGM; N. Milpied, N. Raus ), the German Registry (DRST; H. Ottinger, K. Fuchs, C. Müller, H. Neidlinger. F. Strehle), the Italian Registry (GITMO; A.Rambaldi, R. Oneto, B. Bruno, A. Camboni), the Dutch Registry (HOVON; A. Schattenberg, M. Groenendijk), Spanish BMT Registry (GETH; J. Diez Martin, A. Cedillo), the Swiss Registry (SBST; U. Schanz, H. Baldomero), the Turkish BMT Registry (G. Gurman, M. Arat, F. Arpaci, D. Dursen) and the British Registry (BSBMT; G. Jackson, K. Kirkland, J. Lee) is greatly appreciated. We also thank D. John for database support. EBMT is supported by grants from the corporate sponsors: Gentium SpA, Gilead Sciences Europe Ltd., Celgene International SARL, Astellas Pharma Europe Ltd., Sanofi Oncology, Fresenius Biotech GmbH, Terumo BCT, Therakos Photopheresis, TEVA, Miltenyi Biotec GmbH, Clinigen Group Ltd., Sandoz International GmbH, Macropharma, Pierre Fabre Médicament SAS, Millennium Pharmaceuticals Inc., Amgen Europe GmbH, Exem Consulting SA, and CHUGAI sanofi-aventis.
The authors declare no conflicts of interest.
Footnotes
Supplementary Information accompanies this paper on Bone Marrow Transplantation website (http://www.nature.com/bmt)
Supplementary Material
References
- Copelan EA. Hematopoietic stem-cell transplantation. N Engl J Med. 2006;354:1813–1826. doi: 10.1056/NEJMra052638. [DOI] [PubMed] [Google Scholar]
- Appelbaum FR. Hematopoietic-cell transplantation at 50. N Engl J Med. 2007;357:1472–1475. doi: 10.1056/NEJMp078166. [DOI] [PubMed] [Google Scholar]
- Ljungman P, Bregni M, Brune M, Cornelissen J, de Witte T, Dini G, et al. European Group for Blood and Marrow. Allogeneic and autologous transplantation for haematological diseases, solid tumours and immune disorders: current practice in Europe 2009. Bone Marrow Transplant. 2010;45:219–234. doi: 10.1038/bmt.2009.141. [DOI] [PubMed] [Google Scholar]
- Gratwohl A, Baldomero H, Aljurf M, Pasquini MC, Bouzas LF, Yoshimi A, et al. Hematopoietic stem cell transplantation: a global perspective. JAMA. 2010;303:1617–1624. doi: 10.1001/jama.2010.491. [DOI] [PMC free article] [PubMed] [Google Scholar]
- Gratwohl A, Baldomero H, Schwendener A, Gratwohl M, Apperley J, Frauendorfer K, et al. The EBMT activity survey 2008 impact of team size, team density and new trends. Bone Marrow Transplant. 2011;46:174–191. doi: 10.1038/bmt.2010.69. [DOI] [PubMed] [Google Scholar]
- Gratwohl A. Bone marrow transplantation activity in Europe 1990. Report from the European Group for Bone Marrow Transplantation (EBMT) Bone Marrow Transplant. 19918:197–201. [PubMed] [Google Scholar]
- Gratwohl A, Baldomero H, Horisberger B, Schmid C, Passweg J, Urbano-Ispizua A. Accreditation Committee of the European Group for Blood and Marrow Transplantation (EBMT). Current trends in haematopoietic stem cell transplantation in Europe. Blood. 2002;100:2374–2386. doi: 10.1182/blood-2002-03-0675. [DOI] [PubMed] [Google Scholar]
- Gratwohl A, Baldomero H, Schwendener A, Gratwohl M, Apperley J, Niederwieser D, et al. Joint Accreditation Committee of the International Society for Cellular Therapy; European Group for Blood and Marrow Transplantation; European Leukemia Net. Predictability of hematopoietic stem cell transplantation rates. Haematologica. 2007;92:1679–1686. doi: 10.3324/haematol.11260. [DOI] [PubMed] [Google Scholar]
- Gratwohl A, Baldomero H, Schwendener A, Rocha V, Apperley J, Frauendorfer K, et al. The EBMT activity survey 2007 with focus on allogeneic HSCT for AML and novel cellular therapies. Bone Marrow Transplant. 2009;43:275–291. doi: 10.1038/bmt.2009.7. [DOI] [PubMed] [Google Scholar]
- Gratwohl A, Schwendener A, Baldomero H, Gratwohl M, Apperley J, Niederwieser D, et al. Changes in use of hematopoietic stem cell transplantation; a model for diffusion of medical technology. Haematologica. 2010;95:637–643. doi: 10.3324/haematol.2009.015586. [DOI] [PMC free article] [PubMed] [Google Scholar]
- Martin I, Baldomero H, Bocelli-Tyndall C, Slaper-Cortenbach I, Passweg J, Tyndall A. The survey on cellular and engineered tissue therapies in Europe in 2009. Tissue Eng Part A. 2011;17:2221–2230. doi: 10.1089/ten.tea.2011.0131. [DOI] [PMC free article] [PubMed] [Google Scholar]
- World Health Organisation, WHO ( ( http://www.who.int/topics/transplantation/en/ ).
- Passweg JR, Baldomero H, Gratwohl A, Bregni M, Cesaro S, Dreger P, et al. The EBMT activity survey: 1990-2010. Bone Marrow Transplant. 2012;47:906–923. doi: 10.1038/bmt.2012.66. [DOI] [PubMed] [Google Scholar]
- Foeken LM, Green A, Hurley CK, Marry E, Wiegand T, Oudshoorn M. Monitoring the international use of unrelated donors for transplantation: the WMDA annual reports. Bone Marrow Transplant. 2010;45:811–818. doi: 10.1038/bmt.2010.9. [DOI] [PubMed] [Google Scholar]
- Bacigalupo A, Ballen K, Rizzo D, Giralt S, Lazarus H, Ho V, et al. Defining the intensity of conditioning regimens: working definitions. Biol Blood Marrow Transplant. 2009;15:1628–1633. doi: 10.1016/j.bbmt.2009.07.004. [DOI] [PMC free article] [PubMed] [Google Scholar]
Associated Data
This section collects any data citations, data availability statements, or supplementary materials included in this article.


