

Abstract
Background. Exclusive enteral nutrition (EEN) is a well-established approach to the management of Crohn's disease. Aim. To determine effects of EEN upon inflammation and gut barrier function in a colitis mouse model. Methods. Interleukin-10-deficient mice (IL-10−/−) were inoculated with Helicobacter trogontum and then treated with EEN, metronidazole, hydrocortisone, or EEN and metronidazole combination. Blood and tissue were collected at 2 and 4 weeks with histology, mucosal integrity, tight junction integrity, inflammation, and H. trogontum load evaluated. Results. H. trogontum induced colitis in IL-10−/− mice with histological changes in the cecum and colon. Elevated mucosal IL-8 mRNA in infected mice was associated with intestinal barrier dysfunction indicated by decreased transepithelial electrical resistance and mRNA of tight junction proteins and increased short-circuit current, myosin light chain kinase mRNA, paracellular permeability, and tumor necrosis factor-α and myeloperoxidase plasma levels (P < 0.01 for all comparisons). EEN and metronidazole, but not hydrocortisone, treatments restored barrier function, maintained gut barrier integrity, and reversed inflammatory changes along with reduction of H. trogontum load (versus infected controls P < 0.05). Conclusion. H. trogontum infection in IL-10−/− mice induced typhlocolitis with intestinal barrier dysfunction. EEN and metronidazole, but not hydrocortisone, modulate barrier dysfunction and reversal of inflammatory changes.
1. Introduction
Inflammatory bowel diseases (IBDs), including ulcerative colitis (UC) and Crohn's disease (CD), are a group of conditions characterized by chronic relapsing inflammation of the gastrointestinal tract [1–4]. Despite extensive research conducted over many years, the causes of IBD are still unclear. However, a defective intestinal epithelial barrier and continuous bacterial antigen stimulation of mucosal immunity have been proposed as important etiological factors of IBD in genetically susceptible individuals [5–7].
It is well accepted that luminal bacteria play an important role in the initiation and progression of IBD [8, 9]. The strongest evidence for this conclusion comes from studies utilizing rodent models of colitis [8, 10] and is also supported by clinical observations [5, 6]. A number of animal studies have employed the interleukin-10 deficient mice (IL-10−/−) mouse model, given that IL-10 is known to suppresses the secretion of numerous proinflammatory cytokines [11, 12]. This model has been shown to readily develop moderate-to-severe IBD when triggered by events that compromise their mucosal barrier, such as Helicobacter species [8]. While many studies using the IL-10−/− Helicobacter model have focused on H. hepaticus or H. bilis, other enterohepatic species including H. cinaedi, H. typhlonius, and H. trogontum (a Gram-negative microaerophilic bacterium initially isolated from rats) [13, 14] have also been shown to initiate colitis in IL-10−/− mice [10, 15, 16]. For instance, in the study of Whary et al., in which both Helicobacter free IL-10−/− (B6 background) and B6 mice were infected with H. trogontum, a rapid development of an acute-on-chronic typhlocolitis, epithelial hyperplasia, and dysplasia was observed following infection of Helicobacter free IL-10−/− mice on a B6 background with H. trogontum [10]. Based on these findings, Whary and colleagues stated that “this model should prove useful in dissecting the pathogenesis of various clinical and pathological features noted in inflammatory bowel disease (both CD and UC) of humans.” The choice of this species is further supported by a recent study by our group that has demonstrated that H. trogontum can adhere to host cells through flagella-microvillus interactions and invade causing a membrane ruffling-like effect and severe cell damage, which may account for loss of barrier function following infection with this bacterium [17]. Further, in the same study we identified within the secretome fraction of H. trogontum three proteins belonging to the type six secretion system, which we also showed were present in H. bilis, H. hepaticus, and H. cinaedi [17]. We have also detected H. trogontum DNA in biopsy and fecal samples of children with CD [18, 19].
It is generally accepted that luminal antigen and adjuvants from intestinal microbiota drive an inflammatory response in the intestinal mucosa. Tumor necrosis factor (TNF)-α is a key proinflammatory mediator in this mucosal response and subsequently stimulates additonal cytokines including IL-8 and myeloperoxidase (MPO) which promote inflamamtory cell recruitment and activation. This mucosal response causes disruption of intestinal tight junction barrier function resulting in an increase in permeability to additional luminal antigen and adjuvants, which further drives the response [20, 21]. Given this, mechanisms that control barrier function and the action of TNF-α and other proinflammatory effectors are extremely important in maintaining disease control as well as intestinal tissue integrity.
Several therapeutic approaches are used for the treatment of IBD including antibiotics, corticosteroids, and biological agents. Previously, the goal of therapy was to reduce inflammation, and although this is still a priority, achieving mucosal healing is now considered the gold standard of therapy. Unfortunately, while current therapies can rapidly alleviate symptoms, they do not cure IBD and are limited with improvements in mucosal inflammatory lesions and mucosal healing [22–24]. The only exception to this are biological therapies, which can robustly control mucosal inflammation and induce mucosal healing along with improvement of clinical symptoms [25–27]. However, similar to antibiotics and corticosteroids, they are associated with undesirable side effects consequent to prolonged use [14, 22–24, 28, 29].
The rationale for antibiotic treatment, including metronidazole (MNZ), ornidazole, and ciprofloxacin, in IBD is based upon a body of evidence showing that luminal bacteria have a role in the pathogenesis of IBD [24, 30]. These antibiotics are used in clinical practice for controlling symptoms and preventing septic complications in patients with active CD [24, 31]. They are known to alter the bacterial composition of the intestine by changing the balance between different bacterial groups [32, 33]. This may explain their role in treating the exacerbation of CD in clinical practice [34–36]. In chronic inflammatory diseases antibiotics can directly or indirectly suppress the intestine's immune system to reduce disease severity [24, 34–36].
The rationale for the use of corticosteroids in IBD relates to their efficacy in current clinical practice to achieve rapid symptomatic relief in many patients [37, 38]. Two commonly used corticosteroids are hydrocortisone (HC) and methylprednisolone. Despite the dramatic success of these corticosteroid medications in achieving clinical remission in CD patients, they have not been shown to have an impact on the maintenance of long-term remission or upon mucosal healing [37].
Over the last 3 decades exclusive enteral nutrition (EEN) has been demonstrated not only to be a valid therapeutic option for induction and maintenance of remission of CD in both adults and children but also to have very few side effects [28, 39, 40]. EEN involves the administration of a liquid elemental or polymeric formula (PF) exclusively, with cessation of normal diet for a period of 6 to 8 weeks [22, 28]. Elemental formula contains individual amino acids, while PF is composed of intact proteins. Pediatric studies have demonstrated that PF not only has equivalent efficacy to elemental formula, but due to its improved palatability, it is also associated with increased tolerance and compliance [22, 41]. PF, as used for EEN, improves nutritional status and can induce clinical remission [22, 28, 39]. A number of studies have reported that clinical and endoscopic improvements in pediatric CD are associated with reduced mucosal mRNA levels of key proinflammatory mediators [22, 39, 42–44].
Despite the well-defined clinical benefits of EEN [22, 39, 44], its mechanisms of action remain unclear. Our aim was to use a mouse model of colitis to investigate the mucosal healing associated with various treatments of IBD. We investigated 4 first-line CD therapies [EEN, HC (in an oral liquid form), MNZ, and a combination of EEN and MNZ], which are used at diagnosis at the Sydney Children's Hospital, Australia. These therapies were chosen to replicate the therapeutic aspects of human CD in IL-10−/− murine model of colitis. To study mucosal healing, we measured transepithelial electrical resistance (TEER: a measure of tight junction integrity), short-circuit current (Isc: a measure of charged ion flow across a membrane), the tight junction associated proteins including claudin-1, occludin and zonula occludens (ZO)-1, and myosin light chain kinase (MLCK) which have been shown to be accurate and reliable measures of intestinal barrier function [45–51].
2. Materials and Methods
2.1. Reagents
PCR primers and TRIzol reagent were purchased from Invitrogen (Carlsbad, CA, USA). MNZ, HC, and basic chemicals were obtained from Sigma Chemical Company (St. Louis, MO, USA). Osmolite (Abbott Nutrition, Australia Pty Ltd, Sydney, NSW; the composition of Osmolite is provided in Supplementary Table 1 of the Supplementary Material available online at http://dx.doi.org/10.1155/2013/909613) was used for PF.
2.2. Preparation of H. trogontum Inoculation
H. trogontum LRB 8581 (susceptible to MNZ) was grown on Horse Blood Agar [Blood Agar Base no. 2 supplemented with 8% defibrinated horse blood (Oxoid; Heidelberg West, VIC, Australia)], and incubated under microaerobic conditions for 72 hours at 37°C. The cells were then harvested from the plates using 0.9% saline solution, washed, and then transferred to fresh 0.9% saline solution to obtain an inoculum of 1 × 10⁸ CFU/mL.
2.3. Model of Colitis in IL-10−/− Mice on a C57BL/6 Background
Six-to-eight-week-old IL-10−/− mice on a C57BL/6 background were bred at the Australian Bioresources Centre, Moss Vale, Australia. Given that the presence of Helicobacter species in the gastrointestinal tract of mice has been associated with spontaneous colitis development, the IL-10−/− mice used in this study were bred and maintained in conditions that ensured they were Helicobacter free prior to the commencement of the study. All mice (n = 71; Table 1) were housed in microisolator cages in groups of 2–6, in a 12-hour light/dark cycle and a constant temperature of 20 ± 5°C. All experiments were approved by the Animal Care and Ethics Committee (ACEC) of the University of New South Wales, Sydney, Australia (no. 11/15B).
Table 1.
Population, sex, and group description of IL-10−/− mice on a C57BL/6 background.
| Group no. | Group description | Total number of mice | |
|---|---|---|---|
| 1 | Noninfeced control group; no infection and no treatment (66.7% female) | 9 (killed time 0) | |
|
| |||
| Treatments | week 2 | week 4 | |
|
| |||
| 2 | Infected control group; treatment: sterilized water (n = 12; 58.3% female) | 6 | 6 |
| 3 | 1HC group; treatment: HC (n = 12; 41.7% female) | 6 | 26 |
| 4 | 3EEN group; treatment: 4PF (n = 13; 46.2% female) | 8 | 5 |
| 5 | 5MNZ group; treatment: MNZ (n = 13; 46.2% female) | 7 | 6 |
| 6 | EEN + MNZ group; treatment: a combination of PF and MNZ (n = 12. 50% female) | 6 | 6 |
1Hydrocortisone; 2mice in this group were euthanized at week 3 because of severe diarrhea, dehydration, and weight loss (their indexes were compared to those of other groups at week 4 throughout this study); 3exclusive enteral nutrition; 4polymeric formula; 5metronidazole.
For induction of colitis, each mouse was orogastrically inoculated with 100 μL of H. trogontum on 3 occasions over the period of 5 days. Immediately after the final inoculation, clinically relevant treatments were commenced as described in Table 1. All treatment regimens were given in a liquid form in the drinking bottle ad libitum. The liquids were replaced every 24 hours. The concentrations of HC and MNZ provided in the drinking bottle were calculated based on the average liquid intake and average weight of each animal. The average mouse weight at 8 weeks was approximately 25 g, with an average daily water consumption of 4 mL. Based on these values, the following concentrations, extrapolated from human doses, were used: HC at a dose of 5 mg/kg/day [52]; MNZ at a dose of 10 mg/kg/day [32]. PF was provided as a sole nutrient/water source [22, 28] with exclusion of standard mouse chow (Lab Diet 5001; PMI Nutrition Inc., LLC, Brentwood, MO; the chemical composition of the standard mouse chow diet is provided in Supplementary Table 2).
Over the period of the study, the mice were monitored daily for diarrhea and any signs of dehydration (loss of skin elasticity) shallow breathing, unkempt fur, and extraordinary/antisocial behavior, and the body weight of the mice was measured every 48 hours. If any signs of severe diarrhea, dehydration, and weight loss (greater than 20% of original body weight) developed, they were euthanized immediately.
Two weeks after initiation of the treatments, half the animals were euthanized and tissue was collected (n = 33). The remaining animals (n = 29) were euthanized after 4 weeks and tissue collected. All the animals in the HC group were euthanized when moribund at week 3 rather than week 4 due to ethical considerations. However, their indexes were compared to those of other groups at week 4 throughout this study. At necroscopy, blood was collected by cardiac puncture with cecum and colon also collected and fixed in 10% formalin for histological injury evaluation and immunofluorescence labelling. Colon was also collected into RNAlater [40 mL 0.5 M EDTA (Sigma), 25 mL 1.0 M sodium citrate (Sigma), 700 g ammonium sulfate (Sigma), and 935 mL distilled water at pH of 5.2] and stored at −20°C for PCR examinations, and fresh tissue was used for assessment of mucosal integrity and permeability in an Ussing chamber.
2.4. Histological Examination
Macroscopic evaluation was based on criteria reflecting inflammation, including bowel wall thickening, luminal distension and bleeding, intestinal tissue necrosis and rupture, intestinal edema, and erythema and haemorrhage. Following macroscopic evaluation, cecum and colonic tissues were fixed in 10% buffered formalin solution and embedded in paraffin. The embedded specimens were then sectioned (6 μm), stained with Hematoxylin and Eosin, and examined by light microscopy. The slides were assigned a histological injury score using a scheme modified from Madsen et al. [9]. This score ranged from 0 (minimal injury) to 15 (maximal injury) by scoring 4 criteria [9], epithelial hyperplasia (0–3), lamina propria mononuclear and neutrophilic infiltration (0–4 and 0–4, resp.), and mucosal ulceration (0–4; Supplementary Table 3). A veterinary pathologist who was blind to the treatment received carried out the histological scoring. The mucosal thickness was also measured. This was undertaken by taking a photomicrograph of each section and using image analysis software to measure the thickness.
2.5. Ussing Chamber Experiments
The Ussing chamber (World Precision Instruments Inc., FL, USA) was used to measure the TEER and Isc of fresh colonic tissues. Colon segments were immediately excised postmortem and placed in a fresh Ussing chamber buffer (116.0 mM NaCl, 5.4 nM KCl, 0.4 mM MgCl2, 1.8 mM CaCl2, 5.5 mM glucose, 26.0 mM NaHCO3, and 0.9 mM NaH2PO4 at pH of 7.4). Tissue segments were then opened along the mesenteric border, cut into a flat sheet, and rinsed free of luminal contents with phosphate buffered saline (PBS; Gibco Invitrogen, Carlsbad, CA., USA) prior to being vertically mounted in the Ussing chamber. The chamber exposed tissues to 10 mL of circulating oxygenated buffer at 37°C on both the mucosal and serosal sides. The serosal bathing solution contained 10.0 mM glucose as a source of energy, which was osmotically balanced by mannitol (10.0 mM) on the mucosal side. The chamber was connected to matched voltage and current electrodes (EKV and EKC, resp.; World Precision Instruments Inc.) through a KCl saturated agar bridge to monitor the potential differences across the tissues. Following equilibration for 30 minutes, the Isc, an index of net active ion passage, was recorded continually in the voltage clamp mode at 0 potential difference. A voltage pulse of 2 mV was imposed for 3 seconds at 60-second intervals across the colon tissues in order to estimate the TEER (expressed as Ω·cm2), as a surface area normalized ratio of imposed voltage pulse to the observed deflection in resultant circuit current, according to the Ohm's law formula:
| (1) |
2.6. Permeation Experiments
In addition to electrophysiological measurements, the mucosal-to-serosal permeability of fresh colonic tissues based on a paracellular marker was assessed using the Ussing chamber. Type VI horseradish peroxidase (HRP; Sigma), with a molecular mass of ~44 kDa, was used as a model protein probe. HRP is an established paracellular marker and has been extensively utilized to study macromolecular permeability [45, 47–49, 53]. As it is a relatively large molecule (similar in size to antigenic proteins known to stimulate immune responses), it cannot readily diffuse across the cell membrane nor pass through intact tight junctions making it a good candidate to measure tight junctional impairments [45, 49]. Further, the amount of HRP crossing the epithelial layer can be easily measured using a kinetic enzymatic assay [47–49, 53]. In the permeation experiments, HRP (10.0−5 M) [45, 47–49] was added to the mucosal buffer once equilibrium was reached (30 minutes after colon tissues had been placed in the Ussing chamber). After 1 minute, serosal samples (500 μL) were collected, after which they were collected every 30 minutes for 2 hours. On each occasion the collected buffer was replaced with fresh buffer to maintain constant volume. Enzymatic activity of HRP was measured using a modified kinetic assay as previously described [45].
2.7. Enzyme-Linked Immunosorbent Assay (ELISA) for TNF-α and MPO
To measure the plasma levels of TNF-α (a master proinflammatory cytokine of the innate immune response) and MPO (a marker of eosinophil and neutrophil activation) [54, 55], TNF-α (abcam, CA, USA) and MPO (abcam) ELISAs were performed using commercial kits according to the manufacturers' instructions. The minimum detectable dose of TNF-α was less than 60 pg/mL, while that of MPO was 0.6 ng/mL. The absorptions were measured at 450 nm in an ELISA microplate reader (BioTek, NY, USA). The results are expressed as percentage of the noninfected controls over the period of 4 weeks.
2.8. RNA Extraction and Real-Time (RT) PCR
Total RNA was extracted from tissue which had been stored in RNAlater by manually homogenizing the tissues with a mortar and pestle in TRIzol reagent (Invitrogen). To remove contaminating DNA, the Turbo DNA free kit (Ambion, Austin, USA) was utilized as described previously [45]. The total RNA concentration was determined by reading the absorbance at 260/280 nm using a NanoDrop ND-1000 spectrophotometer (NanoDrop Technologies, Wilmington, DE, USA). cDNA was then synthesized through reverse transcription reaction using superscript III reverse transcriptase enzyme (Invitrogen) according to the manufacturer's instruction. Reactions were carried out in a thermocycler (Corbett Research, Australia).
RT-PCRs were carried out using the Realplex Mastercycler (Eppendorf, Barkhausenweg, Hamburg, Germany) with the SYBR-green (BioRad) fluorescence quantification system as previously described [45]. In a total volume of 25 μL, each RT-PCR reaction contained primer pair mix (Invitrogen), 12.5 μL of 1x iQ TM SYBR Green RT-PCR buffer, nuclease-free water (Ambion), and 5 μL of cDNA (2 ng/μL) as a template, except for negative controls. All the RT-PCR primers were specifically designed for mouse occludin, claudin-1, ZO-1, myosin light chain kinase (MLCK), macrophage inflammatory protein 2 (MIP-2), lipopolysaccharide-induced CXC chemokine (LIX), TNF-α and β2-microglobulin (β2M) as a reference. Primer sequences for the RT-PCR were as follows: (1) mouse occludin [56], forward: 5′-ATG TCC GGC CGA TGC TCT C-3′, reverse: 5′-CTT TGG CTG CTC TTG GGT CTG TAT-3′; (2) mouse claudin-1 [57], forward: 5′-AGG AAA GGC CCT TCA GCA GAG CAA-3′, reverse: 5′-GTG CCC CCT CTT GACT CAT GCA AC-3′; (3) mouse ZO-1 [56], forward: 5′-ACC CGA AAC TGA TGC TGT GGA TAG-3′, reverse: 5′-AAA TGG CCG GGC AGA GAC TTG TGT A-3′; (4) mouse MLCK [58], forward: 5′-ACA TGC TAC TGA GTG GCC TCT CT-3′, reverse: 5′-GGC AGA CAG GAC ATT GTT TAA GG-3′; (5) mouse MIP-2 [59], forward: 5′-CGC CCA GAC AGA AGT CAT AG-3′, reverse: 5′-TCC TCC TTT CCA GGT CAG TTA-3′; (6) mouse LIX [59], forward: 5′-GGT CCA CAG TGC CCT ACG-3′, reverse: 5′-GCG AGT GCA TTC CGC TTA-3′; and (7) mouse TNF-α [60], forward: 5′-ATC ATC TTC TCA AAA TTC GAG TGA C-3′, reverse: 5′-CTA GTT GGT TGT CTT TGA GAT CCA T-3′. The cycle profile consisted of denaturation at 95°C for 2 minutes, followed by 40 cycles of 95°C for 20 seconds, 63°C for 30 seconds, and 72°C for 60 seconds. The PCR products were then analyzed for homogeneity by melting curve analysis. No primer dimers were detected during the 40 amplification cycles. Realplex software was used to calculate the cycle threshold (Ct) for each reaction. The results were expressed as 2−ΔΔ Ct. Reported Ct value for each sample is an average of the values obtained from 4 independent runs.
2.9. Detection of H. trogontum in the Colon of Mice Using 16S rRNA PCR
DNA was extracted from approximately 200 mg of colonic tissue, which had been stored in RNAlater, using the Qiagen Puregene Core kit A (Qiagen, Hilden, Germany) according to the manufacturer's instructions. Although we were able to determine H. trogontum colonization status by PCR in the majority of the mice, in some mice insufficient colonic tissue was available. However, as histological assessment, TEER, Isc, HRP flux, gene expression of MIP-2, LIX, and TNF-α were determined in colonic samples from all mice, colonization status was inferred based on these parameters.
The concentration and quality of DNA were measured using a NanoDrop ND-1000 Spectrophotometer (NanoDrop Technologies). The H. trogontum PCR was performed using the primer pair B72 and B39 previously designed by Mendes et al. [13]. The PCR reactions were performed in a 25 μL reaction mixture consisting of 10 pmol of each primers B72 (forward: 5′-CATAGGTAACATGCCCCA-3′; Sigma) and B39 (reverse: 5′-CTGTTTTCAAGCTCCCC-3′; Sigma), 1x PCR buffer (Fisher Biotech, Wembley, WA, Australia), 200.0 μM of each deoxynucleoside triphosphate (dNTP; Fisher Biotech), 2.0 mM MgCl2 (Fisher Biotech), 0.825 U of Taq polymerase (Fisher Biotech), and 2 μL of DNA. The thermal cycling conditions for the primers B79 and B39 were 94°C for 45 seconds, 63°C for 45 seconds, and 72°C for 1 minute for 25 cycles. Following the PCR, 5 μL of the PCR products was subjected to gel electrophoresis (with a constant voltage of 100 for 22 minutes), stained with 1X GelRed Nucleic Acid Gel Stain (Biotium, Hayward, CA, USA), and visualized under UV transillumination (BioRad, Hercules, USA). For PCR analysis, samples resulting in 888 bp fragment and displaying a single band were considered PCR positive for H. trogontum. The limit of detection of the PCR was <40 pg DNA.
2.10. Immunofluorescence Staining of ZO-1 Protein
Paraffin-embedded colonic sections (6 μm) were used for fluorescent labelling of the tight junction protein ZO-1. Paraffin-embedded sections were dewaxed in Histoclear (National Diagnostics, Atlanta, GA, US) for 10 minutes before rehydrating with 100%, 75%, and 50% ethanol (Fronine laboratory supplies, Australia). Prior to application of primary antibody, antigen retrieval was performed by heating the sections in Tri-sodium citrate buffer [1.47 g Tri-sodium citrate (Sigma), 2.2 mL 1.0 M HCl (Sigma), and 500 mL distilled water at pH 6.0] for 30 seconds on high power in microwave (1000 W). Sections were then rinsed 3 times (for 5 minutes) with PBS (Gibco) blocked with 10% normal donkey serum (Sigma) in 0.1% bovine serum albumin (Sigma) in PBS for 20 minutes at room temperature. Sections were then incubated for a further hour with primary antibody mouse anti-ZO-1 (1 : 200 diluted in 2% normal donkey serum; Invitrogen). Following 3 washes in PBS, the slides were incubated with donkey anti-mouse ALEXA 488 (1 : 500 diluted in 2% normal donkey serum; Invitrogen) at room temperature, for 30 minutes in the dark. After 3 more washes with PBS, slides were mounted with Vectashield + DAPI mounting medium (Vector laboratories, Burlingame, CA, USA) and were imaged using an Axioplan 2 microscope (Zeiss, Oberkochen, Germany) and AxioVision software (Zeiss).
2.11. Statistical Analysis
Data are presented as mean ± standard deviation (SD) and analyzed using GraphPad Prism software (version 4.0 for windows; GraphPad Software, San Diego, CA, USA). Statistical analysis employed the one-way ANOVA test for comparison of multiple groups with a Tukey's posttest to assess statistical differences among all groups. Spearman's correlation was used for all correlations. The bacterial qualitative comparisons were performed using the Fisher exact test. P values of ≤0.05 were considered to be statistically significant.
3. Results
3.1. Body Weight
Infected untreated mice (infected controls) showed moderate-to-severe weight loss over the period of 4 weeks (versus noninfected controls P < 0.01; Figure 1). Similarly, infected mice treated with HC showed weight loss over the duration of 3 weeks (versus infected controls P = NS; Figure 1). However, infected mice treated with EEN, MNZ, or EEN + MNZ gained weight over the 4-week experimental period (versus infected controls P < 0.01 for all comparisons; Figure 1).
Figure 1.
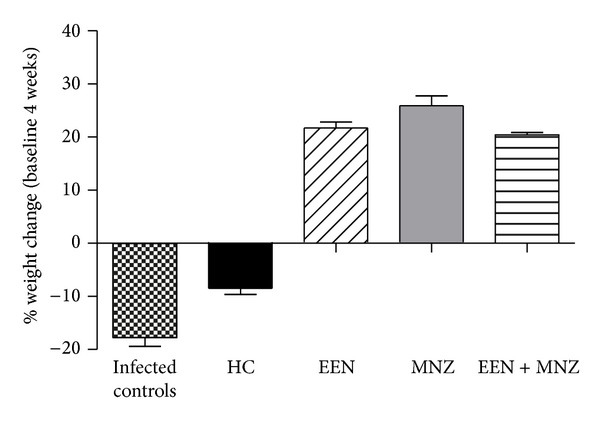
Average body weight of male and female C57BL/6 mice. Six-to-eight-week-old IL-10−/− mice (male and female) were infected with 100 μL 1 × 10⁸ CFU/mL of H. trogontum and then treated with hydrocortisone (HC), exclusive enteral nutrition (EEN), metronidazole (MNZ), or a combination of EEN and MNZ commenced. In the infected control groups, H. trogontum caused a significant weight loss over the period of 4 weeks (versus noninfected controls P < 0.01). However, infected but (EEN, MNZ, and EEN + MNZ) treated mice gained weight over the 4-week treatment period (versus infected controls P < 0.01 for all comparisons). Mice in the HC group rapidly developed weight loss over the 3-week experimental period (versus infected controls P = NS; versus noninfected controls P < 0.01). NS: not significant; P > 0.05.
3.2. H. trogontum Infection and Association with Onset of Typhlocolitis in Mice
All mice, except for the noninfected controls, were infected with H. trogontum by 3 inoculations over 5 days. The presence of H. trogontum in the colon was determined at 2 weeks and 4 weeks using an H. trogontum 16S rRNA specific PCR.
H. trogontum DNA was not detected in any of the assayed colon specimens from noninfected controls (n = 4; 0% positive; Supplementary Table 4 and Supplementary Figure 1). At 2 and 4 weeks, H. trogontum DNA was detected in 75% of colon specimens collected from infected controls (Supplementary Table 4 and Supplementary Figure 1). In contrast, H. trogontum DNA was not detected in any of the colon specimens obtained from infected EEN treated mice (weeks 2 and 4: 0% positive; Supplementary Table 4 and Supplementary Figure 1). In the MNZ and the EEN + MNZ treated mice, H. trogontum was detected in only 25% of the mice (Supplementary Table 4 and Supplementary Figure 1). H. trogontum was detected in 100% of the colon specimens collected from the infected but HC treated mice at the 2- and 3-week time points (Supplementary Table 4 and Supplementary Figure 1).
Although H. trogontum could only be detected in 75% of the mice infected with H. trogontum (Supplementary Table 4 and Supplementary Figure 1), as shown later, all of the mice in this group were shown to have a moderate-to-severe typhlocolitis with elevated levels of inflammatory markers (at 2 and 4 weeks), which would strongly suggest that infection was present in these mice. The failure to detect H. trogontum was likely due to the fact that the number of H. trogontum in the colonic samples collected fell below the limit of detection of the PCR (<40 pg DNA).
The macroscopic appearance of the cecum and colon of noninfected control mice was normal as was the histological appearance, as indicated by minimal/no mononuclear or polymorphonuclear cell infiltration, minimal/no evidence of histological injury, erosion or epithelial hyperplasia. The average histological injury score for the noninfected controls was 3 ± 3 for cecum and 3 ± 1 for colon (Figures 2(a) and 2(b)). In contrast, in the H. trogontum infected animals, macroscopic examination showed luminal distension, erythema and intestinal edema, with the intestinal changes being most pronounced in the cecum and colon, decreasing towards the ileum. All the mice in this group developed a moderate-to-severe typhlocolitis with acute-on-chronic tissue damage that worsened progressively throughout the experiment which resulted in an average cecal and colonic histological injury score of 8 ± 2 and 10 ± 3 (Figure 2(a)) at week 2 and 9 ± 3 and 10 ± 3 (Figure 2(b)) at week 4, respectively (versus noninfected controls P < 0.01 for all comparisons). In order to evaluate the efficacy of the treatments in abrogating histological lesions induced by H. trogontum, all comparisons were made to the noninfected controls. Macroscopically, no visible abnormalities were found in the cecum and colon of the infected animals that had undergone treatment, while the histological injury score was significantly less in these groups. In the EEN treatment group, the average cecal and colonic scores were 6 ± 4 and 7 ± 3 (Figure 2(a)) at weeks 2 and 3 ± 2 and 5 ± 2 (Figure 2(b)) at week 4, respectively (P = NS for all comparisons). In the MNZ group, the average cecal and colonic histological injury scores were correspondingly 6 ± 3 and 6 ± 4 (Figure 2(a)) at week 2 and 5 ± 2 and 5 ± 2 (Figure 2(b)) at week 4 (P = NS for all comparisons), while for the EEN + MNZ treated mice the scores were 7 ± 2 and 8 ± 3 (P < 0.01 for both comparisons; Figure 2(a)) at week 2and 6 ± 2 and 6 ± 3 (P < 0.05 for both comparisons; Figure 2(b)) at week 4. In the HC treated animals, the total cecal and colonic histological injury scores were 8 ± 4 and 8 ± 3 (Figure 2(a)) at week 2 and 9 ± 2 and 9 ± 4 (Figure 2(b)) at week 3, respectively (P < 0.01 for all comparisons).
Figure 2.
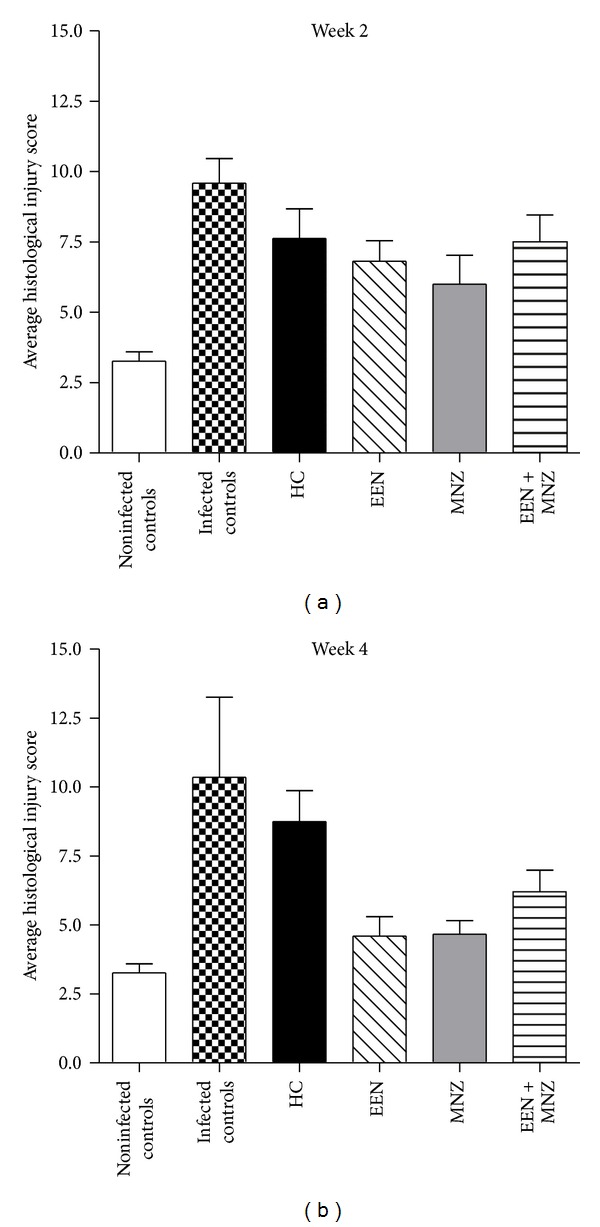
Histopathological changes in the colon of noninfected and infected/treated mice. Hematoxylin and Eosin stained sections of the colon from each mouse were examined by light microscopy at week 2 (a) and week 4 (or week 3 for HC group) (b) after the commencement of treatment. Mucosal ulceration, epithelial hyperplasia, lamina propria mononuclear, and neutrophil infiltration were scored on an ascending scale, from 0 to 15, of severity of histological injury. In the infected animals, the total colonic histological injury score was significantly higher than that of the noninfected controls (weeks 2 and 4: P < 0.01 for both comparisons). The histological injury score was significantly less in infected groups that had undergone 2–4 weeks of treatments (weeks 2 and 4: versus infected controls P < 0.01 for all comparisons). The only exception to this was with HC, where a slight decrease in colonic histological injury score was noted; however, the differences were not significant (week 2 and 3: versus infected controls P = NS for both comparisons; versus noninfected controls P < 0.01 for both comparisons). NS: not significant; P > 0.05. HC: hydrocortisone; EEN: exclusive enteral nutrition; MNZ: metronidazole.
In the noninfected control group, the cecal and colonic mucosal thicknesses were 146 ± 18 μm and 187 ± 16 μm, respectively. The mucosal thickness in the infected controls was significantly higher as compared to the noninfected controls (week 2: cecum 346 ± 7 μm, colon 452 ± 3 μm; week 4: cecum 356 ± 6 μm, colon 454 ± 8 μm; P < 0.01 for all comparisons). Except for the mice treated with HC, no significant statistical difference was found in the mucosal thickness of infected but treated mice as compared with the noninfected controls (P = NS for all comparisons). The group of mice treated with HC had a slightly lower mean mucosal thickness as compared with the infected controls (week 2: cecum: 320 ± 5 μm, colon 416 ± 6 μm; week 3: cecum 352 ± 9 μm, colon 432 ± 3 μm; P = NS for all comparisons), while this was significantly higher than that of the noninfected controls (weeks 2 and 3: P < 0.01 for all comparisons).
3.3. Epithelial Electrophysiology of Intestinal Mucosa
Epithelial electrophysiology Ussing chamber studies were employed to assess gut barrier function in the mice. TEER was calculated to provide an overall assessment of gut barrier functions. TEER was 155 ± 28 Ω·cm2 for the noninfected controls and was significantly lower in infected controls (weeks 2 and 4: versus noninfected controls P < 0.01 for both comparisons; Figures 3(a) and 3(b)). Interestingly, there was no significant difference in TEER of infected but EEN, MNZ and EEN + MNZ treated mice compared to the noninfected controls (weeks 2 and 4: P = NS for all comparisons; Figures 3(a) and 3(b)). The group of mice treated with HC had TEER levels below the noninfected controls (weeks 2 and 3: P < 0.01 for both comparisons) but elevated slightly but not significantly compared with the infected controls (weeks 2 and 3: P = NS for both comparisons; Figures 3(a) and 3(b)).
Figure 3.
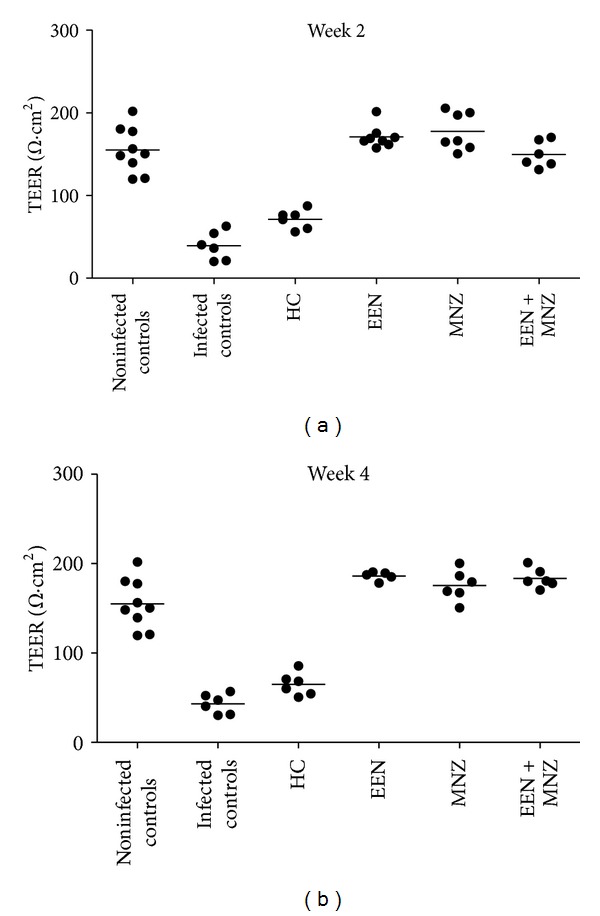
TEER of intestinal mucosa of male and female C57BL/6 mice. Mice from each group were euthanized either 2 weeks (a) or 4 weeks (3 weeks in HC group) (b) following treatment, and colon tissue was collected. Tissue segments were opened along the mesenteric border and then cut into flat sheet and placed into the Ussing chamber with TEER measured. H. trogontum significantly decreased TEER in the infected controls (weeks 2 and 4: versus noninfected controls P < 0.01 for both comparisons). In contrast, the EEN, MNZ, and EEN + MNZ treatments remarkably ameliorated the increased TEER observed in infected controls (weeks 2 and 4: versus noninfected controls P = NS for all comparisons). The group of mice treated with HC had TEER levels below the noninfected controls (weeks 2 and 3: P < 0.01 for both comparisons) but elevated slightly but not significantly compared with the infected controls (week 2 and 3: P = NS for both comparisons). Bars indicate mean. NS: not significant; P > 0.05. TEER: transepithelial electrical resistance; HC: hydrocortisone; EEN: exclusive enteral nutrition; MNZ: metronidazole.
Isc was measured to assess ion movement across the epithelium (Figures 4(a) and 4(b)). Isc increased in infected controls compared to noninfected controls (week 2 and 4: P < 0.01 for both comparisons; Figures 4(a) and 4(b)). Isc levels in treated mice (EEN, MNZ, and EEN + MNZ) were equivalent to those of the noninfected controls (week 2 and 4: P = NS for all comparisons) except for mice treated with HC, where Isc levels were below infected controls (week 2: P < 0.01; week 3: P = NS) but elevated as compared with the noninfected controls (week 2 and 3: P < 0.01 for both comparisons; Figures 4(a) and 4(b)).
Figure 4.
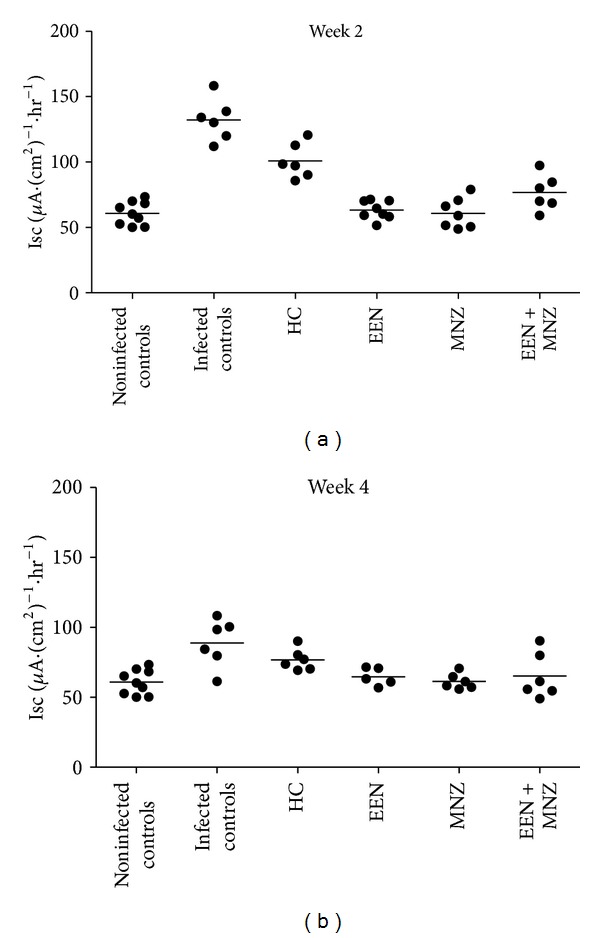
Mucosal tissue Isc measurements in ex vivo experiments. Tissue segments were mounted in the Ussing chamber, with Isc measured. (a) Isc levels following 2-week treatment or no treatment (noninfected controls); (b) Isc levels following 4-week treatment (or 3-week treatment for the HC group) or no treatment. In comparison with the noninfected controls, H. trogontum induced a significant increase in Isc in the infected controls (weeks 2 and 4: P < 0.01 for both comparisons). However, no change in Isc was observed in the infected but (EEN, MNZ and EEN + MNZ) treated mice (weeks 2 and 4: versus noninfected controls P = NS for all comparisons). The group of mice treated with HC for either 2 or 3 weeks had reduced Isc levels compared to the infected controls (week 2: P < 0.01; week 3: P = NS) but were elevated compared to the noninfected control mice (weeks 2 and 3 P < 0.01 for both comparisons). Bars indicate mean. NS: not significant; P > 0.05. Isc: short-circuit current; HC: hydrocortisone; EEN: exclusive enteral nutrition; MNZ: metronidazole.
3.4. Intestinal Tight Junction Permeability to HRP
Macromolecular permeability of the epithelium was assessed by mucosal-to-serosal flux of HRP. A HRP flux of 102 ± 9 nM/hr was calculated for the noninfected controls (Table 2). Consistent with the epithelial electrophysiology results, mucosal-to-serosal HRP flux was significantly increased in infected controls (weeks 2 and 4: versus noninfected controls P < 0.01 for both comparisons; Table 2) but unchanged in the infected and EEN, MNZ, EEN + MNZ treated mice (Table 2). Similar to previous findings, the infected but HC treated mice had a HRP flux that was lower than infected controls but still significantly higher than the noninfected controls (Table 2).
Table 2.
Mucosal-to-serosal 1HRP permeability flux.
| Groups | Week 2 | Week 4 | ||||
|---|---|---|---|---|---|---|
| HRP flux (nM/hr) | 2 P | 3 P | HRP flux (nM/hr) | 2 P | 3 P | |
| Infected controls | 150 ± 9 | <0.01 | — | 141 ± 17 | <0.01 | — |
| 4HC | 120 ± 9 | <0.01 | <0.05 | 118 ± 5 | <0.01 | <0.01 |
| 5EEN | 89 ± 8 | NS | <0.01 | 90 ± 10 | NS | <0.01 |
| 6MNZ | 99 ± 3 | NS | <0.05 | 85 ± 11 | NS | <0.01 |
| EEN + MNZ | 87 ± 6 | NS | <0.01 | 86 ± 10 | NS | <0.01 |
1Horseradish peroxidase.
Data are mean values ± SD.
2 P versus noninfeced controls (HRP flux: 102 ± 9 nM/hr).
3 P versus infected controls.
Significant P values are in bold (P ≤ 0.05).
NS: not significant; P > 0.05.
4Hydrocortisone; 5exclusive enteral nutrition; 6metronidazole.
3.5. Plasma Levels of TNF-α and MPO
Next, we examined whether PF and the nonnutritional therapeutic agents used in the current study had the capacity to restore normal inflammatory marker levels in infected animals. As shown in Figure 5, a marked increase in both TNF-α and MPO plasma concentrations was observed in the infected mice after H. trogontum challenge over the period of 4 weeks (versus noninfected controls P < 0.01 for both comparisons). Of particular note, all the treatments, except for HC, were able to eliminate inflammation by reducing TNF-α and MPO levels relative to the H. trogontum infected controls (P < 0.01 for all comparisons; versus noninfected controls P = NS for all comparisons; Figure 5). In the HC group, by week 3, both TNF-α and MPO plasma levels were also significantly reduced (versus infected controls P < 0.01 for both comparisons); however, these levels remained elevated relative to the noninfected controls (P < 0.01 for both comparisons; Figure 5).
Figure 5.
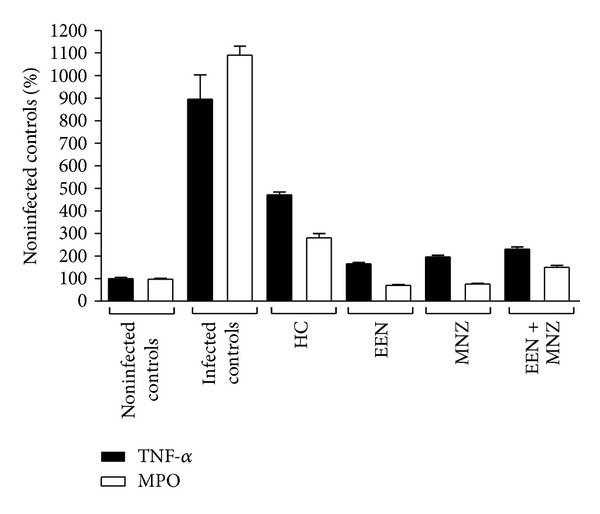
Plasma levels of TNF-α and MPO in male and female C57BL/6 mice. At necropsy, following 4-week treatments cardiac puncture was performed to collect blood. The plasma TNF-α and MPO activity were then determined using corresponding ELISA kits. H. trogontum infected mice (infected controls) displayed a trend of increased plasma TNF-α and MPO activity over the 4-week experimental period as compared with the noninfected controls (P < 0.01). In contrast, in comparison to the infected controls, the C57BL/6 mice showed significantly lower TNF-α and MPO plasma levels in response to the EEN, MNZ, and a combination of EEN and MNZ over the period of 4 weeks (P < 0.01 for all comparisons; versus noninfected controls P = NS for all comparisons). In the HC group, by week 3, the TNF-α and MPO plasma levels were significantly below infected controls (P < 0.01 for both comparisons) but remained elevated relative to the noninfected controls (P < 0.01 for both comparisons). Data are expressed as percentage of the noninfected controls over the period of 4 weeks. Bars indicate mean. NS: not significant; P > 0.05. HC: hydrocortisone; EEN: exclusive enteral nutrition; ELISA: enzyme-linked immunosorbent assay; MNZ: metronidazole.
3.6. Intestinal Gene Expression of MIP-2, LIX, and TNF-α
As mentioned earlier, the chemokines MIP-2 and LIX (homologs of human IL-8) have been found to be expressed in mouse intestinal epithelial cells and to contribute to the pathology of a number of animal models of disease [59]. Therefore, in the current study, the mucosal inflammatory response was assessed by measuring gene expression of MIP-2, LIX, and TNF-α.
In comparison with the noninfected controls, MIP-2, LIX, and TNF-α mRNA levels were significantly upregulated in infected controls (weeks 2 and 4: P < 0.01 for all comparisons; Figures 6(a) and 6(b)). In mice treated with EEN, MNZ, or EEN + MNZ, there was no difference in MIP-2, LIX, and TNF-α mRNA expression, as compared with the noninfected controls (weeks 2 and 4: P = NS for all comparisons; Figures 6(a) and 6(b)). In contrast, infected animals treated with HC had MIP-2, LIX, and TNF-α expression levels below the infected controls (week 2 and week 3: P < 0.01 for all comparisons; Figures 6(a) and 6(b)) but elevated compared with the noninfected controls (weeks 2 and 3: P < 0.01 for all comparisons; Figures 6(a) and 6(b)). In addition, mucosal MIP-2, LIX, and TNF-α mRNA levels correlated with mucosal-to-serosal HRP flux (Table 3).
Figure 6.
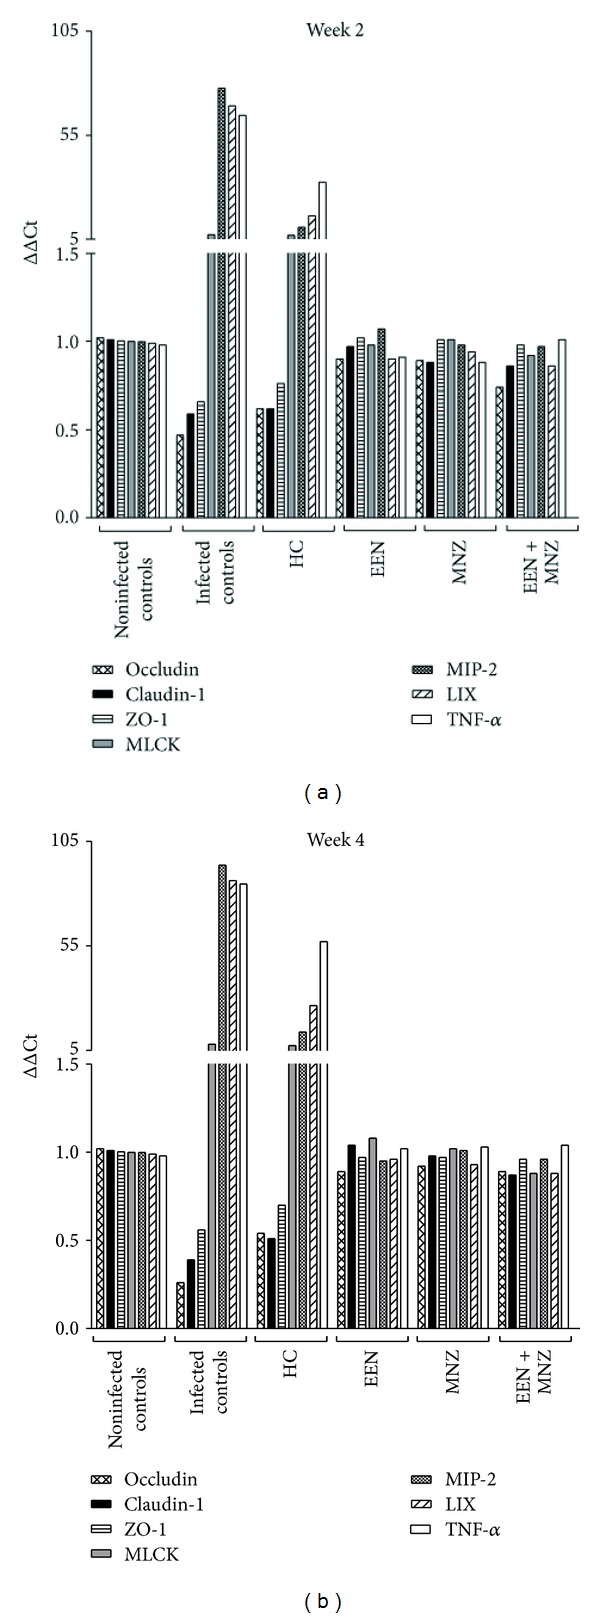
Mucosal gene expression of tight junction structural proteins, MIP-2, LIX, TNF-α, and MLCK in male and female C57BL/6 mice. RNA from the colon of each mouse was extracted and subjected to RT-PCR. (a) Gene expression levels following 2-week treatment or no treatment (noninfected controls); (b) gene expression levels following 4-week treatment (or 3-week treatment for the HC group) or no treatment. mRNA expression of occludin, claudin-1 and ZO-1 in the infected control mice were significantly decreased after infection with H. trogontum (weeks 2 and 4: versus noninfected controls P < 0.01 for all comparisons), while MIP-2, LIX, TNF-α, and MLCK gene expressions were upregulated (weeks 2 and 4: versus noninfected controls P < 0.01 for all the comparisons). Administration of EEN, MNZ, EEN + MNZ to the infected mice abrogated any effects of H. trogontum as mRNA expression levels of genes associated with tight junctions, MIP-2, LIX, TNF-α, and MLCK were similar to that of the noninfected controls (week 2 and 4: P = NS and versus infected controls P < 0.01 for all the comparisons). However, HC only partially downregulated transcription of MIP-2, LIX, and TNF-α (weeks 2 and 3: versus infected controls P < 0.01 for all comparisons) with a slight rise in gene expression of occludin, claudin-1, and ZO-1 (weeks 2 and 3: versus infected controls P = NS for all comparisons). In addition, HC failed to decrease the gene expression levels of MLCK to those of the noninfected controls, even after 3 weeks (weeks 2 and 3: versus infected controls P = NS for both comparisons). NS: not significant; P > 0.05. MIP-2: macrophage inflammatory protein 2; LIX: lipopolysaccharide-induced CXC chemokine; TNF-α: tumor necrosis factor α; MLCK: myosin light chain kinase; ZO: zonula occludens; IL-8: interleukin-8; Ct: cycle threshold; HC: hydrocortisone; EEN: exclusive enteral nutrition; MNZ: metronidazole.
Table 3.
Spearman's correlation values for markers of inflammation with 1HRP flux and with mucosal MLCK gene expression.
| Correlation parameters | 2MIP-2 | 3LIX | 4TNF-α |
|---|---|---|---|
| HRP | Noninfeced controls: r = 0.61, P = 0.03 | Noninfeced controls: r = 0.78, P < 0.01 | Noninfeced controls: r = 0.74, P < 0.01 |
| Infected controls: r = 0.68, P < 0.01 | Infected controls: r = 0.71, P < 0.01 | Infected controls: r = 0.75, P < 0.01 | |
| 5HC: r = 81, P < 0.01 | HC: r = 0.52, P = 0.03 | HC: r = 0.77, P < 0.01 | |
| 6EEN: r = 0.80, P < 0.01 | EEN: r = 0.53, P = 0.04 | EEN: r = 0.88, P < 0.01 | |
| 7MNZ: r = 0.72, P < 0.01 | MNZ: r = 0.68, P = 0.01 | MNZ: r = 0.69, P < 0.01 | |
| EEN + MNZ: r = 0.71, P < 0.01 | EEN + MNZ: r = 0.84, P < 0.01 | EEN + MNZ: r = 0.63, P < 0.01 | |
|
| |||
| 8MLCK | Noninfeced controls: r = 0.82, P < 0.01 | Noninfeced controls: r = 0.69, P < 0.01 | Noninfeced controls: r = 0.79, P < 0.01 |
| Infected controls: r = 0.73, P < 0.01 | Infected controls: r = 0.66, P = 0.01 | Infected controls: r = 85, P < 0.01 | |
| HC: r = 0.67,P = 0.01 | HC: r = 0.84, P < 0.01 | HC: r = 0.76, P < 0.01 | |
| EEN: r = 0.75, P < 0.01 | EEN: r = 0.64, P = 0.02 | EEN: r = 0.78, P < 0.01 | |
| MNZ: r = 0.59, P = 0.01 | MNZ: r = 0.77, P < 0.01 | MNZ: r = 0.63, P = 0.01 | |
| EEN + MNZ: r = 0.68, P < 0.01 | EEN + MNZ: r = 0.71, P < 0.01 | EEN + MNZ: r = 0.69, P < 0.01 | |
1Horseradish peroxidase; 2macrophage inflammatory protein 2; 3lipopolysaccharide-induced CXC chemokine; 4tumor necrosis factor α; 5hydrocortisone; 6exclusive enteral nutrition; 7Metronidazole. 8myosin light chain kinase.
3.7. Analysis of Tight Junction Proteins and MLCK
Changes in expression of MLCK and tight junction associated genes in response to inflammatory mediators [1, 3, 45] have been reported to play a vital role in epithelial barrier function. To investigate this MLCK, occludin, claudin-1, and ZO-1 gene expressions were assessed. In infected mice, MLCK gene expression was upregulated (weeks 2 and 4: versus noninfected controls P < 0.01 for both comparisons); while the gene expression levels of occludin, claudin-1, and ZO-1 were downregulated (weeks 2 and 4: versus noninfected controls P < 0.01 for all comparisons; Figures 6(a) and 6(b)). In contrast, mRNA expression levels of genes associated with tight junctions as well as MLCK were not significantly different in the infected but treated mice (weeks 2 and 4: versus noninfected controls P = NS for all comparisons; Figures 6(a) and 6(b)). The only exception to this was with HC, where a slight rise in the expression of occludin, claudin-1, and ZO-1 was noted; however, the differences were not significant (weeks 2 and 3: versus infected controls P = NS for all comparisons; Figures 6(a) and 6(b)). In this group, gene expression of MLCK did fall slightly but not significantly as compared with the infected control group (weeks 2 and 3: P = NS for both comparisons; Figures 6(a) and 6(b)). In addition, mucosal MLCK gene expression correlated closely with mucosal MIP-2, LIX, and TNF-α mRNA expression (Table 3).
ZO-1 cellular localization was also investigated. In the noninfected control animals ZO-1 appeared as a continuous band localized at the intracellular border (Figure 7(a)). For mice infected with H. trogontum there appeared a progressive reorganization of the ZO-1 with displacement of the protein away from the cellular border and increased frequency of strand breaks (Figure 7(b)). In infected but (EEN, MNZ, and EEN + MNZ) treated mice, the ZO-1 protein appeared to be restricted to the tight junctions and the cellular periphery similar to the noninfected controls (Figures 7(c)–7(e)). ZO-1 staining in mice treated with HC appeared similar to infected control mice (Figure 7(f)).
Figure 7.
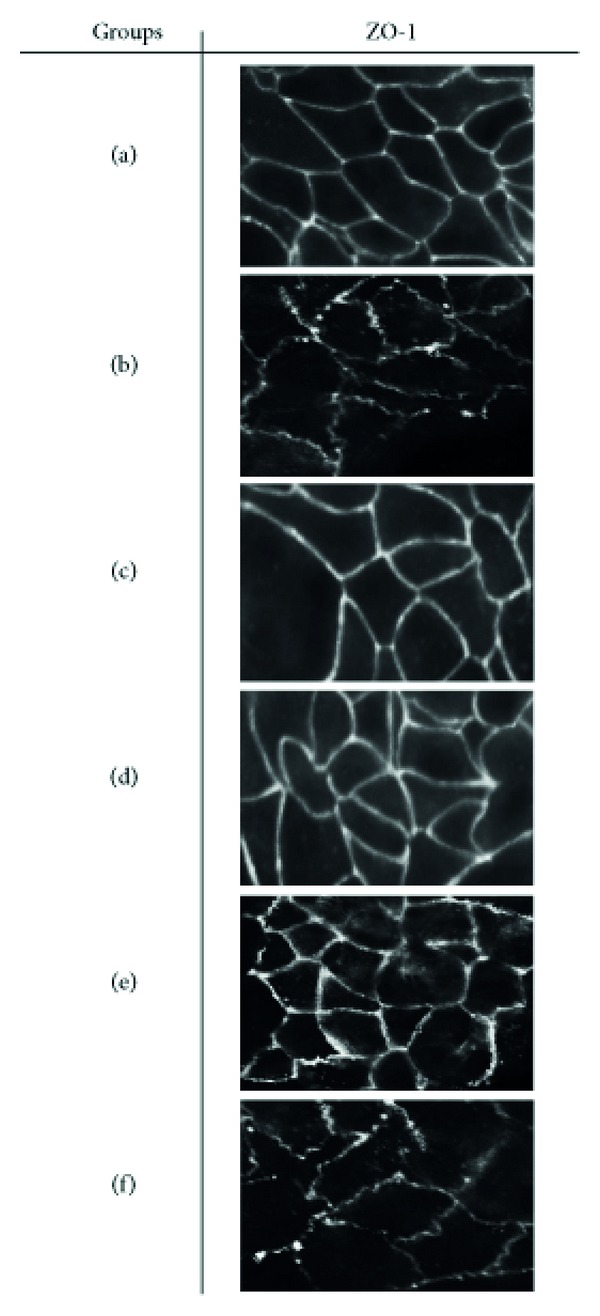
Distribution of ZO-1 in C57BL/6 mice intestinal epithelium. Colon sections from infected/treated and noninfected control groups were fluorescent labelled with antibody to the tight junction protein ZO-1 and were imaged using an Axioplan 2 microscope (Zeiss; ×40 magnification) and AxioVision software (Zeiss). In the noninfected controls (a), the ZO-1 was localized to both the apical lateral borders, as well as between the epithelial cells. In the infected controls (b), however, H. trogontum infection disrupted the distribution of the ZO-1 with visible breakage in the ZO-1 strands. H. trogontum also induced the ZO-1 internalization with a decrease in staining intensity at the epithelial cell borders (b). Following 4-week treatment with the EEN (c), MNZ (d), and a combination of EEN and MNZ (e), ZO-1 strands appeared intact and were sharply localized to the cellular margins. The breakage in the ZO-1 strands and its displacement in the cell borders observed in the infected controls were not markedly changed by the HC treatment (f). ZO: zonula occludens; HC: hydrocortisone; EEN: exclusive enteral nutrition; MNZ: metronidazole.
4. Discussion
Breakdown of the intestinal epithelial barrier in association with luminal bacteria plays an important role in the pathogenesis of IBD [1, 8]. This study examined the effect of several current CD treatments, including HC, EEN, MNZ, and a combination of EEN and MNZ, on the intestinal barrier using an H. trogontum infected IL-10 gene-deficient mouse model of colitis. As previously reported by Whary et al. [10], we observed that infection of IL-10 gene-deficient mice with H. trogontum induces severe typhlocolitis with tissue damage and disruption of intestinal barrier function. Using this model we observed that treatment with EEN or MNZ abrogated intestinal barrier dysfunction, whereas treatment with HC only partially did.
The healthy intestinal barrier is composed of a monolayer of epithelial cells sitting on a specialized extracellular matrix [61–64]. The epithelial cells provide an essential part of the mucosal barrier [61–64]. These cells are involved in both initiate and adaptive immune responses [1, 63] and can control the passage of ions, nutrients, water, and macromolecules across the epithelium [62, 65]. Passage occurs through cell pinocytosis and tight junctions [1, 2]. Tight junctions are highly dynamic, forming a seal between adjacent epithelial cells which excludes luminal bacteria, byproducts, and noxious substances [1, 2]. Tight junctions are composed of transmembrane proteins, including occludin, claudins and junctional adhesion molecules [1, 45, 62] which are linked to the actin and myosin filaments through cytoplasmic plaque proteins, including ZO-1 [1, 45, 62]. The correct and intact association of transmembrane and cytoplasmic proteins is critical for maintaining a functional intestinal barrier. Mucosal damage and loss of intestinal barrier function is a feature of IBD [1, 45, 62, 65].
Strong evidence indicating the importance of the epithelium in gut responses in IBD comes from in vitro studies of intestinal epithelial cells [45, 62, 66] and supported by murine models of colitis [8, 10, 14]. Several reports based on in vitro analysis indicate that increased intestinal permeability in IBD is closely associated with elevated proinflammatory cytokines, including TNF-α and IL-8, and decreased tight junction strand numbers and complexity [1, 45, 66]. Elevated proinflammatory cytokines have been shown to promote the transcription of MLCK [45, 62, 63]. When MLCK is activated, it phosphorylates myosin resulting in disruption of tight junction proteins [45, 62, 65]. In addition, transcription of genes associated with tight junctions is inhibited by the proinflammatory cytokines [45, 62]. These events facilitate the disruption of tight junctions and loss of barrier function, leading to a loss of ions and solutes in the form of leaky flux diarrhea [13, 66] and increased penetration of luminal bacteria, antigens, and potentially harmful toxins into the mucosa [1, 62]. Monitoring of these events using electrophysiological measures showed that EEN and MNZ could completely abrogate any loss in barrier function.
The current goal of IBD therapy is not only to control inflammation but to also promote healing of the bowel. The clinical benefits of current therapies are well documented; however, there are only a limited number of studies that have investigated the effects of therapies on the gut epithelium and how these influence mucosal healing. In the current study, we replicated the therapeutic aspects of human IBD in murine model of colitis to investigate their effects on gut epithelium in a murine model of colitis. This included oral HC, EEN, MNZ, and a combination of EEN and MNZ. Of these therapies, only mice receiving EEN and MNZ had complete resolution of gut barrier function, whereas HC treatment only partially restored gut barrier function. A previous report by Oz et al. [67] used IL-10−/− mice which spontaneously developed colitis when exposed to normal gut flora. Mice were then fed an enteral formula diet either rich or poor in transforming growth factor (TGF)-β2. Mice with a diet rich in TGF-β2 did not develop prolapse or diarrhea and had lower pathological scores in comparison to mice fed the diet lacking TGF-β2 [67]. Consistent with the reduced inflammation, the results of the current study also indicated that EEN and MNZ and their combination downregulated mucosal expression of proinflammatory cytokines as well as MLCK to maintain intestinal tight junction function and structure. The improvement in intestinal barrier function, therefore, likely prevented subsequent infiltration of immune cells and upregulation of cytokine expression in response to enteric antigens in the colon. Although EEN, MNZ, and their combination induced mucosal healing and reduced H. trogontum load in the majority of mice (EEN 100%; MNZ 75%; EEN + MNZ 75% reduction), to below the threshold of PCR detection, only EEN showed a significant reduction as compared to the infected controls. This indicated that the outcomes were not solely consequent to antibacterial effects. In addition, HC only partially maintained gut barrier integrity and failed to prevent weight loss. HC had no effect in reducing H. trogontum load to below the threshold of PCR detection in all animals assayed. This is not surprising as there is no evidence in the literature supporting the reduction of the pathogenic bacterial load as a potential effect of HC. In contrast, several lines of evidence suggest that corticosteroids, including HC, produce their effect on immune cells by activating the glucocorticoid receptors to regulate not only the transcription of various steroid-response target genes involved in inflammatory process but also inhibit the production of a large number of proinflammatory cytokines (e.g., TNF-α, IL-1, -6, and -8) [37]. Consistent with this evidence, we ascertained that HC acts primarily by immunosuppressive mechanisms as the animals receiving HC had partial reductions in inflammatory markers (e.g., TNF-α, MIP-2, LIX, and MPO). One explanation of HC activity in this model may be that HC does not remove the intestinal proinflammatory bacteria, the anti-inflammatory properties of HC may not be sufficient to completely inhibit inflammation, and therefore the balance swings to continued, albeit a reduced, inflammatory response.
Based on the outcomes of this study, our previous findings [42, 68], and with the help of clinical data [68–70], it is rational to suggest that EEN may act with a similar mechanism(s) to MNZ to induce mucosal healing. There is evidence that both EEN and MNZ have anti-inflammatory properties [22, 30–36, 45, 70]. For instance, de Jong et al. [42] reported that PF has direct anti-inflammatory effects on enterocytes, preventing their chemokine response to proinflammatory mediators in the colonic epithelial cell lines. Several reports have also demonstrated that antibiotics/probiotics directly or indirectly suppress the intestinal immune response, improve mucosal barrier function, and reduce gut translocation of bacteria [30, 32–36, 71–73]. Consistent with this evidence, we ascertained that only groups receiving EEN, MNZ, or a combination of EEN and MNZ had reductions in H. trogontum load as well as MIP-2, LIX, and TNF-α (key proinflammatory immunological mediators that contribute to tissue injury in the pathogenesis of the disease) mRNA levels in the colonic mucosa. Although H. trogontum was still detected in some MNZ mice, in these mice inflammation had resolved, suggesting that MNZ does possess anti-inflammatory properties as well as antibacterial properties. It has been reported that infliximab treatment, which completely blocks inflammation, not only promotes mucosal healing but also reduces bacterial load within the gut [74, 75]. Given this, one might hypothesize that similar results of mucosal healing could be achieved with partial suppression of inflammation plus reduction of bacterial load.
In summary, this study has demonstrated that H. trogontum infection in IL-10−/− mice generates acute-on-chronic typhlocolitis, thus reconfirming that infection of IL-10−/− mice with H. trogontum produces a picture similar to that observed in IBD, particularly CD. This model could also be considered as a rapid screening tool to evaluate mucosal healing and gut function in response to nutritional and nonnutritional therapies. The current work also ascertained that administration of EEN, MNZ (or a combination of EEN and MNZ) to infected mice reduced mucosal cytokine levels and lead to recovery of barrier function, along with resolution of mucosal inflammatory events and reduction in H. trogontum load. The resolution of gut barrier function likely enhanced resolution of the inflammatory process in the mucosa. Whereas with HC treatment, inflammation is reduced even though gut function is not restored which likely inhibits resolution of the inflammatory process. Therefore, these findings provide a plausible explanation as to the observation that CD patients achieve mucosal healing more readily following EEN than following treatment with corticosteroids [23]. While the mechanisms of action of PF are likely to be due to both direct intracellular mechanism(s) and alteration of the gut mucosa, further investigations that will more precisely define these mechanism(s) are required.
Supplementary Material
Composition of Osmolite (Abbott Nutrition; per 100 mL), as used for polymeric formula (PF) in the current study, is provided in Supplementary Table 1. As mentioned in the materials and methods, all animals, except for Exclusive Enteral Nutrition (EEN) group, were fed standard chow which its chemical composition is summarized in Supplementary Table 2. Cecum and colon tissues, obtained from each mouse at necroscopy, were examined and assigned a histological injury score corresponding to the severity of inflammation observed using a scheme modified from Madsen et al [9]. Histological scores ranged from 0 (minimal injury) to 15 (maximal injury) by scoring 4 criteria including epithelial hyperplasia (0-3), lamina propria mononuclear infiltration (0-4), Neutrophil infiltration (0-4) and mucosal ulceration (0-4) as outlined in Supplementary Table 3. Following histological examination, association of the average histological injury score with the presence and/or absence of Helicobacter trogontum in colon tissue, obtained from Interleukin (IL)-10-deficient mice at week 2 and 4, were assessed and the results are summarized in Supplementary Table 4. As shown in Supplementary Figure 1, the presence and/or absence of H. trogontum in the colon of noninfected, infected and infected but treated mice was evaluated at week 2 and week 4 using H. trogontum 16S rRNA specific polymerase chain reaction (PCR).
Conflict of Interests
None of the authors has a conflict of interests or any commercial association that may pose a conflict of interests.
Authors' Contribution
All authors were involved in the study design; Lily Nahidi performed the majority of experiments; Andrew S. Day and Hazel M. Mitchell proposed the idea; all authors were involved in data analysis and interpretation; John S. Munday quantified intestinal inflammation; Nadeem O. Kaakoush grew and prepared Helicobacter trogontum for murine infection; Lily Nahidi drafted the paper; all authors revised the paper for important intellectual content; Lily Nahidi, Steven T. Leach, and Karina Huinao analyzed the data; Andrew S. Day, Hazel M. Mitchell, and Steven T. Leach obtained funding; Steven T. Leach provided technical or material support; Andrew S. Day, Steven T. Leach, and Hazel M. Mitchell supervised the study; all authors, listed below, approved the final version of the paper. Lily Nahidi, Steven T. Leach, Hazel M. Mitchell, Nadeem O. Kaakoush, Daniel A. Lemberg, John S. Munday, Karina Huinao, and Andrew S. Day.
Acknowledgments
This study was funded, in part, by the National Health and Medical Research Council (Grant no. 510230). Dr. Nadeem O. Kaakoush is supported by an Early Career Fellowship from the National Health and Medical Research Council (Grant no. 1012413). Professor Andrew S. Day is a member of Janssen Advisory Board, New Zealand. Laboratory investigations were performed in the Westfield Research Laboratories. Osmolite was supplied by Abbott Nutrition Australia.
References
- 1.Förster C. Tight junctions and the modulation of barrier function in disease. Histochemistry and Cell Biology. 2008;130(1):55–70. doi: 10.1007/s00418-008-0424-9. [DOI] [PMC free article] [PubMed] [Google Scholar]
- 2.Zeissig S, Bürgel N, Günzel D, et al. Changes in expression and distribution of claudin 2, 5 and 8 lead to discontinuous tight junctions and barrier dysfunction in active Crohn’s disease. Gut. 2007;56(1):61–72. doi: 10.1136/gut.2006.094375. [DOI] [PMC free article] [PubMed] [Google Scholar]
- 3.Reuter BK, Pizarro TT. Mechanisms of tight junction dysregulation in the SAMP1YitFc model of crohn’s disease-like ileitis. Annals of the New York Academy of Sciences. 2009;1165:301–307. doi: 10.1111/j.1749-6632.2009.04035.x. [DOI] [PubMed] [Google Scholar]
- 4.de Jong NSH, Leach ST, Day AS. Fecal S100A12: a novel noninvasive marker in children with Crohn’s disease. Inflammatory Bowel Diseases. 2006;12(7):566–572. doi: 10.1097/01.ibd.0000227626.72271.91. [DOI] [PubMed] [Google Scholar]
- 5.Linskens RK, Huijsdens XW, Savelkoul PHM, Vandenbrouckc-Grauls CMJE, Meuwissen SGM. The bacterial flora in inflammatory bowel disease: current insights in pathogenesis and the influence of antibiotics and probiotics. Scandinavian Journal of Gastroenterology. 2001;36(234) Supplement:29–40. doi: 10.1080/003655201753265082. [DOI] [PubMed] [Google Scholar]
- 6.Fiocchi C. Inflammatory bowel disease: etiology and pathogenesis. Gastroenterology. 1998;115(1):182–205. doi: 10.1016/s0016-5085(98)70381-6. [DOI] [PubMed] [Google Scholar]
- 7.Laukoetter MG, Nava P, Nusrat A. Role of the intestinal barrier in inflammatory bowel disease. World Journal of Gastroenterology. 2008;14(3):401–407. doi: 10.3748/wjg.14.401. [DOI] [PMC free article] [PubMed] [Google Scholar]
- 8.Fox JG, Ge Z, Whary MT, Erdman SE, Horwitz BH. Helicobacter hepaticus infection in mice: models for understanding lower bowel inflammation and cancer. Mucosal Immunology. 2011;4(1):22–30. doi: 10.1038/mi.2010.61. [DOI] [PMC free article] [PubMed] [Google Scholar]
- 9.Madsen KL, Doyle JS, Jewell LD, Tavernini MM, Fedorak RN. Lactobacillus species prevents colitis in interleukin 10 gene-deficient mice. Gastroenterology. 1999;116(5):1107–1114. doi: 10.1016/s0016-5085(99)70013-2. [DOI] [PubMed] [Google Scholar]
- 10.Whary MT, Danon SJ, Feng Y, et al. Rapid onset of ulcerative typhlocolitis in B6.129P2-IL10tm1Cgn (IL-10−/−) mice infected with Helicobacter trogontum is associated with decreased colonization by altered Schaedler’s flora. Infection and Immunity. 2006;74(12):6615–6623. doi: 10.1128/IAI.01091-06. [DOI] [PMC free article] [PubMed] [Google Scholar]
- 11.Lindsay JO, Hodgson HJF. Review article: the immunoregulatory cytokine interleukin-10: a therapy for Crohn’s disease? Alimentary Pharmacology and Therapeutics. 2001;15(11):1709–1716. doi: 10.1046/j.1365-2036.2001.01093.x. [DOI] [PubMed] [Google Scholar]
- 12.Ye MB, Bak JP, An CS, et al. Dietary β-glucan regulates the levels of inflammatory factors, inflammatory cytokines, and immunoglobulins in interleukin-10 knockout mice. Journal of Medicinal Food. 2011;14(5):468–474. doi: 10.1089/jmf.2010.1197. [DOI] [PubMed] [Google Scholar]
- 13.Mendes EN, Queiroz DMM, Dewhirst FE, Paster BJ, Moura SB, Fox JG. Helicobacter trogontum sp. nov., isolated from the rat intestine. International Journal of Systematic Bacteriology. 1996;46(4):916–921. doi: 10.1099/00207713-46-4-916. [DOI] [PubMed] [Google Scholar]
- 14.Moura SB, Mendes EN, Queiroz DMM, et al. Microbiological and histological study of the gastrointestinal tract of germ-free mice infected with Helicobacter trogontum . Research in Microbiology. 1999;150(3):205–212. doi: 10.1016/s0923-2508(99)80037-0. [DOI] [PubMed] [Google Scholar]
- 15.Shen Z, Feng Y, Rogers AB, et al. Cytolethal distending toxin promotes Helicobacter cinaedi-associated typhlocolitis in interleukin-10-deficient mice. Infection and Immunity. 2009;77(6):2508–2516. doi: 10.1128/IAI.00166-09. [DOI] [PMC free article] [PubMed] [Google Scholar]
- 16.Franklin CL, Gorelick PL, Riley LK, et al. Helicobacter typhlonius sp. nov., a novel murine urease-negative Helicobacter species. Journal of Clinical Microbiology. 2001;39(11):3920–3926. doi: 10.1128/JCM.39.11.3920-3926.2001. [DOI] [PMC free article] [PubMed] [Google Scholar]
- 17.Kaakoush NO, Sirianni A, Raftery MJ, et al. The secretome of Helicobacter trogontum . Helicobacter. 2013;18(4):316–320. doi: 10.1111/hel.12045. [DOI] [PubMed] [Google Scholar]
- 18.Zhang L, Day A, McKenzie G, Mitchell H. Nongastric Helicobacter species detected in the intestinal tract of children. Journal of Clinical Microbiology. 2006;44(6):2276–2279. doi: 10.1128/JCM.02017-05. [DOI] [PMC free article] [PubMed] [Google Scholar]
- 19.Man SM, Zhang L, Day AS, Leach S, Mitchell H. Detection of enterohepatic and gastric Helicobacter species in fecal specimens of children with crohn’s disease. Helicobacter. 2008;13(4):234–238. doi: 10.1111/j.1523-5378.2008.00607.x. [DOI] [PubMed] [Google Scholar]
- 20.Miyauchi E, Morita H, Okuda J, Sashihara T, Shimizu M, Tanabe S. Cell wall fraction of Enterococcus hirae ameliorates TNF-α-induced barrier impairment in the human epithelial tight junction. Letters in Applied Microbiology. 2008;46(4):469–476. doi: 10.1111/j.1472-765X.2008.02332.x. [DOI] [PubMed] [Google Scholar]
- 21.Kruidenier L, Verspaget HW. Review article: oxidative stress as a pathogenic factor in inflammatory bowel disease: radicals or ridiculous? Alimentary Pharmacology and Therapeutics. 2002;16(12):1997–2015. doi: 10.1046/j.1365-2036.2002.01378.x. [DOI] [PubMed] [Google Scholar]
- 22.Day AS, Whitten KE, de Jong NSH. Nutrition and nutritional management of Crohn’s disease in children and adolescents. Current Nutrition and Food Science. 2006;2(1):3–13. [Google Scholar]
- 23.Berni Canani R, Terrin G, Borrelli O, et al. Short- and long-term therapeutic efficacy of nutritional therapy and corticosteroids in paediatric Crohn’s disease. Digestive and Liver Disease. 2006;38(6):381–387. doi: 10.1016/j.dld.2005.10.005. [DOI] [PubMed] [Google Scholar]
- 24.Harris A, Feller ER, Shah SA. Medical therapy of IBD in 2009. Medicine and Health, Rhode Island. 2009;92(3):78–81. [PubMed] [Google Scholar]
- 25.Van Assche G, Vermeire S, Rutgeerts P. Mucosal healing and anti TNFs in IBD. Current Drug Targets. 2010;11(2):227–233. doi: 10.2174/138945010790309902. [DOI] [PubMed] [Google Scholar]
- 26.Rutgeerts P, Vermeire S, Van Assche G. Biological therapies for inflammatory bowel diseases. Gastroenterology. 2009;136(4):1182–1197. doi: 10.1053/j.gastro.2009.02.001. [DOI] [PubMed] [Google Scholar]
- 27.Ferrante M, Van Assche G. Medical therapy and mucosal healing. Current Drug Targets. 2012;13(10):1294–1299. doi: 10.2174/138945012802429679. [DOI] [PubMed] [Google Scholar]
- 28.Day AS, Whitten KE, Sidler M, Lemberg DA. Systematic review: nutritional therapy in paediatric Crohn’s disease. Alimentary Pharmacology and Therapeutics. 2008;27(4):293–307. doi: 10.1111/j.1365-2036.2007.03578.x. [DOI] [PubMed] [Google Scholar]
- 29.Papa A, Mocci G, Scaldaferri F, et al. New therapeutic approach in inflammatory bowel disease. European Review for Medical and Pharmacological Sciences. 2009;13(supplement 1):33–35. [PubMed] [Google Scholar]
- 30.Thukral C, Travassos WJ, Peppercorn MA. The role of antibiotics in inflammatory bowel disease. Current Treatment Options in Gastroenterology. 2005;8(3):223–228. doi: 10.1007/s11938-005-0014-z. [DOI] [PubMed] [Google Scholar]
- 31.Ishikawa T, Okamura S, Oshimoto H, Kobayashi R, Mori M. Metronidazole plus ciprofloxacin therapy for active Crohn’s disease. Internal Medicine. 2003;42(4):318–321. doi: 10.2169/internalmedicine.42.318. [DOI] [PubMed] [Google Scholar]
- 32.Madsen KL, Doyle JS, Tavernini MM, Jewell LD, Rennie RP, Fedorak RN. Antibiotic therapy attenuates colitis in interleukin 10 gene-deficient mice. Gastroenterology. 2000;118(6):1094–1105. doi: 10.1016/s0016-5085(00)70362-3. [DOI] [PubMed] [Google Scholar]
- 33.Colpaert S, Liu Z, De Greef B, Rutgeerts P, Ceuppens JL, Geboes K. Effects of anti-tumour necrosis factor, interleukin-10 and antibiotic therapy in the indometacin-induced bowel inflammation rat model. Alimentary Pharmacology and Therapeutics. 2001;15(11):1827–1836. doi: 10.1046/j.1365-2036.2001.01111.x. [DOI] [PubMed] [Google Scholar]
- 34.Sutherland L, Singleton J, Sessions J, et al. Double blind, placebo controlled trial of metronidazole in Crohn’s disease. Gut. 1991;32(9):1071–1075. doi: 10.1136/gut.32.9.1071. [DOI] [PMC free article] [PubMed] [Google Scholar]
- 35.Colombel J-F, Lémann M, Cassagnou M, et al. A controlled trial comparing ciprofloxacin with mesalazine for the treatment of active Crohn’s disease. The American Journal of Gastroenterology. 1999;94(3):674–678. doi: 10.1111/j.1572-0241.1999.935_q.x. [DOI] [PubMed] [Google Scholar]
- 36.Shen B, Achkar J-P, Lashner BA, et al. A randomized clinical trial of ciprofloxacin and metronidazole to treat acute pouchitis. Inflammatory Bowel Diseases. 2001;7(4):301–305. doi: 10.1097/00054725-200111000-00004. [DOI] [PubMed] [Google Scholar]
- 37.Yang Y-X, Lichtenstein GR. Corticosteroids in Crohn’s disease. The American Journal of Gastroenterology. 2002;97(4):803–823. doi: 10.1111/j.1572-0241.2002.05596.x. [DOI] [PubMed] [Google Scholar]
- 38.Creed TJ, Probert CSJ. Review article: steroid resistance in inflammatory bowel disease: mechanisms and therapeutic strategies. Alimentary Pharmacology and Therapeutics. 2007;25(2):111–122. doi: 10.1111/j.1365-2036.2006.03156.x. [DOI] [PubMed] [Google Scholar]
- 39.Borrelli O, Cordischi L, Cirulli M, et al. Polymeric diet alone versus corticosteroids in the treatment of active pediatric Crohn’s disease: a randomized controlled open-label trial. Clinical Gastroenterology and Hepatology. 2006;4(6):744–753. doi: 10.1016/j.cgh.2006.03.010. [DOI] [PubMed] [Google Scholar]
- 40.Beattie RM. Nutritional management of Crohn’s disease in childhood. Journal of the Royal Society of Medicine. 1998;91(3):135–137. doi: 10.1177/014107689809100306. [DOI] [PMC free article] [PubMed] [Google Scholar]
- 41.Alhagamhmad MH, Day AS, Lemberg DA, et al. An update of the role of nutritional therapy in the management of Crohn's disease. Journal of Gastroenterology. 2012;47(8):872–882. doi: 10.1007/s00535-012-0617-9. [DOI] [PubMed] [Google Scholar]
- 42.de Jong NSH, Leach ST, Day AS. Polymeric formula has direct anti-inflammatory effects on enterocytes in an in vitro model of intestinal inflammation. Digestive Diseases and Sciences. 2007;52(9):2029–2036. doi: 10.1007/s10620-006-9449-x. [DOI] [PubMed] [Google Scholar]
- 43.Breese EJ, Michie CA, Nicholls SW, et al. Tumor necrosis factor α-producing cells in the intestinal mucosa of children with inflammatory bowel disease. Gastroenterology. 1994;106(6):1455–1466. doi: 10.1016/0016-5085(94)90398-0. [DOI] [PubMed] [Google Scholar]
- 44.Fell JME, Paintin M, Arnaud-Battandieri F, et al. Mucosal healing and a fall in mucosal pro-inflammatory cytokine mRNA induced by a specific oral polymeric diet in paediatric Crohn’s disease. Alimentary Pharmacology and Therapeutics. 2000;14(3):281–289. doi: 10.1046/j.1365-2036.2000.00707.x. [DOI] [PubMed] [Google Scholar]
- 45.Nahidi L, Day AS, Lemberg DA, Leach ST. Differential effects of nutritional and non-nutritional therapies on intestinal barrier function in an in vitro model. Journal of Gastroenterology. 2012;47(2):107–117. doi: 10.1007/s00535-011-0471-1. [DOI] [PubMed] [Google Scholar]
- 46.Lewis K, Caldwell J, Phan V, et al. Decreased epithelial barrier function evoked by exposure to metabolic stress and nonpathogenic E. coli is enhanced by TNF-α . The American Journal of Physiology. 2008;294(3):G669–G678. doi: 10.1152/ajpgi.00382.2007. [DOI] [PubMed] [Google Scholar]
- 47.Santos J, Yates D, Guilarte M, Vicario M, Alonso C, Perdue MH. Stress neuropeptides evoke epithelial responses via mast cell activation in the rat colon. Psychoneuroendocrinology. 2008;33(9):1248–1256. doi: 10.1016/j.psyneuen.2008.07.002. [DOI] [PubMed] [Google Scholar]
- 48.Teitelbaum AA, Gareau MG, Jury J, Ping CY, Perdue MH. Chronic peripheral administration of corticotropin-releasing factor causes colonic barrier dysfunction similar to psychological stress. The American Journal of Physiology. 2008;295(3):G452–G459. doi: 10.1152/ajpgi.90210.2008. [DOI] [PubMed] [Google Scholar]
- 49.Kiliaan AJ, Saunders PR, Bijlsma PB, et al. Stress stimulates transepithelial macromolecular uptake in rat jejunum. The American Journal of Physiology. 1998;275(5):G1037–G1044. doi: 10.1152/ajpgi.1998.275.5.G1037. [DOI] [PubMed] [Google Scholar]
- 50.Wang F, Graham WV, Wang Y, Witkowski ED, Schwarz BT, Turner JR. Interferon-γ and tumor necrosis factor-α synergize to induce intestinal epithelial barrier dysfunction by up-regulating myosin light chain kinase expression. The American Journal of Pathology. 2005;166(2):409–419. doi: 10.1016/s0002-9440(10)62264-x. [DOI] [PMC free article] [PubMed] [Google Scholar]
- 51.Ma TY, Boivin MA, Ye D, Pedram A, Said HM. Mechanism of TNF-α modulation of Caco-2 intestinal epithelial tight junction barrier: role of myosin light-chain kinase protein expression. The American Journal of Physiology. 2005;288(3):G422–G430. doi: 10.1152/ajpgi.00412.2004. [DOI] [PubMed] [Google Scholar]
- 52.Trune DR, Wobig RJ, Kempton JB, Hefeneider SH. Steroid treatment in young MRL.MpJ-Fas(lpr) autoimmune mice prevents cochlear dysfunction. Hearing Research. 1999;137(1-2):167–173. doi: 10.1016/s0378-5955(99)00148-3. [DOI] [PubMed] [Google Scholar]
- 53.Cecilia Berin M, Yang P-C, Ciok L, Waserman S, Perdue MH. Role for IL-4 in macromolecular transport across human intestinal epithelium. The American Journal of Physiology. 1999;276(5):C1046–C1052. doi: 10.1152/ajpcell.1999.276.5.C1046. [DOI] [PubMed] [Google Scholar]
- 54.Johnson JL, Hong H, Monfregola J, Catz SD. Increased survival and reduced Neutrophil infiltration of the liver in rab27a- but not munc13-4-deficient mice in Lipopolysaccharide-induced systemic inflammation. Infection and Immunity. 2011;79(9):3607–3618. doi: 10.1128/IAI.05043-11. [DOI] [PMC free article] [PubMed] [Google Scholar]
- 55.Tide A-K, Sjögren T, Svensson M, et al. 2-Thioxanthines are mechanism-based inactivators of myeloperoxidase that block oxidative stress during inflammation. Journal of Biological Chemistry. 2011;286(43):37578–37589. doi: 10.1074/jbc.M111.266981. [DOI] [PMC free article] [PubMed] [Google Scholar]
- 56.Sun X, Yang H, Nose K, et al. Decline in intestinal mucosal IL-10 expression and decreased intestinal barrier function in a mouse model of total parenteral nutrition. The American Journal of Physiology. 2007;294(1):G139–G147. doi: 10.1152/ajpgi.00386.2007. [DOI] [PubMed] [Google Scholar]
- 57.Blanchard AAA, Watson PH, Shiu RPC, et al. Differential expression of claudin 1, 3, and 4 during normal mammary gland development in the mouse. DNA and Cell Biology. 2006;25(2):79–86. doi: 10.1089/dna.2006.25.79. [DOI] [PubMed] [Google Scholar]
- 58.Zhi G, Ryder JW, Huang J, et al. Myosin light chain kinase and myosin phosphorylation effect frequency-dependent potentiation of skeletal muscle contraction. Proceedings of the National Academy of Sciences of the United States of America. 2005;102(48):17519–17524. doi: 10.1073/pnas.0506846102. [DOI] [PMC free article] [PubMed] [Google Scholar]
- 59.Ruddy MJ, Shen F, Smith JB, Sharma A, Gaffen SL. Interleukin-17 regulates expression of the CXC chemokine LIX/CXCL5 in osteoblasts: implications for inflammation and neutrophil recruitment. Journal of Leukocyte Biology. 2004;76(1):135–144. doi: 10.1189/jlb.0204065. [DOI] [PubMed] [Google Scholar]
- 60.Brewer KL, Nolan TA. Spinal and supraspinal changes in tumor necrosis factor-α expression following excitotoxic spinal cord injury. Journal of Molecular Neuroscience. 2007;31(1):13–21. doi: 10.1007/BF02686114. [DOI] [PubMed] [Google Scholar]
- 61.Pulimeno P, Bauer C, Stutz J, Citi S. PLEKHA7 is an adherens junction protein with a tissue distribution and subcellular localization distinct from ZO-1 and E-Cadherin. PLoS ONE. 2010;5(8) doi: 10.1371/journal.pone.0012207.e12207 [DOI] [PMC free article] [PubMed] [Google Scholar]
- 62.Edelblum KL, Turner JR. The tight junction in inflammatory disease: communication breakdown. Current Opinion in Pharmacology. 2009;9(6):715–720. doi: 10.1016/j.coph.2009.06.022. [DOI] [PMC free article] [PubMed] [Google Scholar]
- 63.Henderson P, Van Limbergen JE, Schwarze J, Wilson DC. Function of the intestinal epithelium and its dysregulation in inflammatory bowel disease. Inflammatory Bowel Diseases. 2011;17(1):382–395. doi: 10.1002/ibd.21379. [DOI] [PubMed] [Google Scholar]
- 64.Roda G, Sartini A, Zambon E, et al. Intestinal epithelial cells in inflammatory bowel diseases. World Journal of Gastroenterology. 2010;16(34):4264–4271. doi: 10.3748/wjg.v16.i34.4264. [DOI] [PMC free article] [PubMed] [Google Scholar]
- 65.Weber CR, Turner JR. Inflammatory bowel disease: is it really just another break in the wall? Gut. 2007;56(1):6–8. doi: 10.1136/gut.2006.104182. [DOI] [PMC free article] [PubMed] [Google Scholar]
- 66.Gibson PR. Increased gut permeability in Crohn’s disease: is TNF the link? Gut. 2004;53(12):1724–1725. doi: 10.1136/gut.2004.047092. [DOI] [PMC free article] [PubMed] [Google Scholar]
- 67.Oz HS, Ray M, Chen TS, McClain CJ. Efficacy of a transforming growth factor β2 containing nutritional support formula in a murine model of inflammatory bowel disease. Journal of the American College of Nutrition. 2004;23(3):220–226. doi: 10.1080/07315724.2004.10719364. [DOI] [PubMed] [Google Scholar]
- 68.Leach ST, Mitchell HM, Eng WR, Zhang L, Day AS. Sustained modulation of intestinal bacteria by exclusive enteral nutrition used to treat children with Crohn’s disease. Alimentary Pharmacology and Therapeutics. 2008;28(6):724–733. doi: 10.1111/j.1365-2036.2008.03796.x. [DOI] [PubMed] [Google Scholar]
- 69.Pryce-Millar E, Murch SH, Heusckel RB. Enteral nutrition therapy in Crohn's disease changes the mucosal flora. Journal of Pediatric Gastroenterology and Nutrition. 2004;39(1):p. S289. [Google Scholar]
- 70.Lionetti P, Callegari M, Cavicchi M. Enteral nutrition-induced remission is associated with profound modification of the intestinal microflora in Crohn's disease. Journal of Pediatric Gastroentersology and Nutrition. 2004;39:p. S106. [Google Scholar]
- 71.Madsen K, Cornish A, Soper P, et al. Probiotic bacteria enhance murine and human intestinal epithelial barrier function. Gastroenterology. 2001;121(3):580–591. doi: 10.1053/gast.2001.27224. [DOI] [PubMed] [Google Scholar]
- 72.Medellin-Peña MJ, Wang H, Johnson R, Anand S, Griffiths MW. Probiotics affect virulence-related gene expression in Escherichia coli O157:H7. Applied and Environmental Microbiology. 2007;73(13):4259–4267. doi: 10.1128/AEM.00159-07. [DOI] [PMC free article] [PubMed] [Google Scholar]
- 73.Gareau MG, Jury J, MacQueen G, Sherman PM, Perdue MH. Probiotic treatment of rat pups normalises corticosterone release and ameliorates colonic dysfunction induced by maternal separation. Gut. 2007;56(11):1522–1528. doi: 10.1136/gut.2006.117176. [DOI] [PMC free article] [PubMed] [Google Scholar]
- 74.de Ridder L, Rings EHHM, Damen GM, et al. Infliximab dependency in pediatric Crohn’s disease: long-term follow-up of an unselected cohort. Inflammatory Bowel Diseases. 2008;14(3):353–358. doi: 10.1002/ibd.20329. [DOI] [PubMed] [Google Scholar]
- 75.Yee AMF, Pochapin MB. Treatment of complicated sarcoidosis with infliximab anti-tumor necrosis factor-α therapy. Annals of Internal Medicine. 2001;135(1):27–31. doi: 10.7326/0003-4819-135-1-200107030-00010. [DOI] [PubMed] [Google Scholar]
Associated Data
This section collects any data citations, data availability statements, or supplementary materials included in this article.
Supplementary Materials
Composition of Osmolite (Abbott Nutrition; per 100 mL), as used for polymeric formula (PF) in the current study, is provided in Supplementary Table 1. As mentioned in the materials and methods, all animals, except for Exclusive Enteral Nutrition (EEN) group, were fed standard chow which its chemical composition is summarized in Supplementary Table 2. Cecum and colon tissues, obtained from each mouse at necroscopy, were examined and assigned a histological injury score corresponding to the severity of inflammation observed using a scheme modified from Madsen et al [9]. Histological scores ranged from 0 (minimal injury) to 15 (maximal injury) by scoring 4 criteria including epithelial hyperplasia (0-3), lamina propria mononuclear infiltration (0-4), Neutrophil infiltration (0-4) and mucosal ulceration (0-4) as outlined in Supplementary Table 3. Following histological examination, association of the average histological injury score with the presence and/or absence of Helicobacter trogontum in colon tissue, obtained from Interleukin (IL)-10-deficient mice at week 2 and 4, were assessed and the results are summarized in Supplementary Table 4. As shown in Supplementary Figure 1, the presence and/or absence of H. trogontum in the colon of noninfected, infected and infected but treated mice was evaluated at week 2 and week 4 using H. trogontum 16S rRNA specific polymerase chain reaction (PCR).