Abstract
In this article, we present a modified interleaved segmented echo-planar imaging (SEPI) sequence with a center-out k-space trajectory that is especially designed for susceptibility-weighted imaging applications. We introduce a simple and efficient technique to phase correct the acquired SEPI data in the presence of moderate field inhomogeneities. This phase correction reduces the distortion in the phase-encoding direction without requiring an extra reference scan. With the use of a center-out k-space trajectory and a low-spatial-frequency phase map, phase discontinuities between segments can be eliminated, in principle, iteratively using a fast Fourier transform from the center segment to the outermost segment in k-space. With an extra echo added in front of the echo train, neither phase unwrapping nor an extra reference scan is required to obtain a low-spatial-frequency phase map. The method is shown to remove blurring and reduce geometric distortion caused by phase changes from echo to echo in both phantom and human data. The method is most useful for high-resolution imaging applications and moderate factors of speed improvement.
Keywords: Segmented echo-planar imaging, Iterative phase correction, Center-out k-space trajectory, GDC-SEPI
1. Introduction
Multi-shot or interleaved segmented echo-planar imaging (SEPI) offers higher resolution and better off-resonance behavior compared with single-shot EPI. Since the inception of EPI in 1977 [1] and that of SEPI in 1986 [2], the main challenges have been to remove off-resonance effects from background field effects and to correct for non-ideal sampling. Improved gradients and calibration techniques along with the echo-time shifting (ETS) technique [3] effectively eliminate ghosting or blurring caused by the phase discontinuity between segments. However, the distortion caused by off-resonance phase errors in the phase-encoding direction remains fairly large. There are even special applications in magnetic resonance angiography [4,5] and susceptibility-weighted imaging (SWI) [6] when only even or odd echoes are sampled to maintain special flow properties, such as motion compensation. With increased inter-echo spacing, distortion also increases. Field mapping methods [7–9] can effectively reduce image distortion originating from off-resonance effects such as B0 field inhomogeneity and chemical shift. The field map is usually derived from phase information obtained from either double-echo gradient-echo images or offset spin-echo images. However, the phase residual derived from different echo times has to be unwrapped to get the field inhomogeneity map [10]. Using multiple reference scans [11] and multi-echo gradient-echo imaging [12] makes it possible to reduce B0 field inhomogeneity effects more accurately by eliminating eddy current effects. Chen and Wyrwicz [13] further developed a phase-shifted EPI pulse sequence that takes into account all off-resonance effects, including gradient waveform imperfections, and their method does not require phase unwrapping. Finally, there are brute force approaches using the generalized inverse transform to perform off-resonance correction and attempts to speed these up by using fast conjugate phase reconstruction algorithms [14,15]. In this study, we looked into one special case where only even or odd echoes are sampled and used a center-out k-space trajectory, instead of the conventional sequential bottom–up k-space trajectory, for SEPI. The technique is useful for SWI where a bright arterial signal is desired. The approach we take can account for phase variations between echoes caused by arbitrary moderate two-dimensional (2D) spatial field inhomogeneities. Although we focus on the use of phase from the central part of k-space, the method works even better when an accurate high-resolution phase image is available. Given the rapid scanning possible today, it is not excessive to imagine having the full phase information for use in future applications.
2. Theory
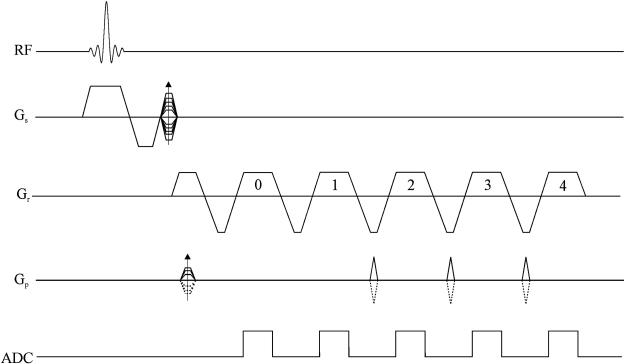
It is well known that the off-resonance artifact mainly manifests itself as distortion when cartesian k-space trajectories are used [14]. In this study, we ignored the phase error term related to the readout direction because the bandwidths used are usually very large [8,12]. The segmented data collection scheme is shown in Fig. 1. Only the even echoes are sampled. In our approach, the center of k-space is sampled first. Ignoring the relaxation effects, the sampled k-space data, s(mΔkx,nΔky,lΔT), with the matrix size, Nx×Ny, can be represented as (for a left-handed system)
| (1) |
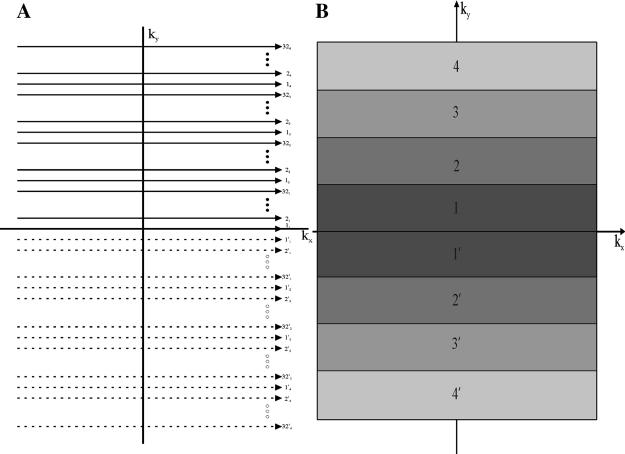
where ρ(x,y) is the spin density of the scanned object, ΔT is the inter-echo time interval (i.e., the time duration between two consecutive even echoes) and l is the echo index on the echo train (see Fig. 1) (l is implicitly a function of n). In Eq. (1), l starts from 1 because the data sampled on the first echo (0th echo on the echo train) are not used to fill k-space (see Fig. 2). In addition, l corresponds to the region number labeled in Fig. 2 and ϕ(x,y,lΔT) is the phase error. This phase term originates from off-resonance effects and is related to the phase evolution in the phase-encoding direction as follows:
| (2) |
where ω0(x,y)=γΔB(x,y) is representative of the local field inhomogeneity and TE(0) is the echo time of the first echo in the echo train.
Fig. 1.
Sketch of the proposed sequence diagram with a turbo speed factor of 4. Only the even echoes in the echo train are sampled (this represents what is often referred to as a flyback method). The top half of k-space is covered with the phase-encoding table and phase-encoding blips as shown (continuous lines), while the lower half of k-space is covered by inverting the polarity of the phase-encoding table and phase-encoding blips (dashed lines). Notice that data acquired at the 0th echo are for calibration purposes; hence, there is no phase-encoding blip between echo 0 and echo 1. No ETS is applied to the acquisition.
Fig. 2.
(A) Sketch of the 2D k-space trajectory with a turbo speed factor of 4. The top half of k-space (continuous lines) is covered by 32-shot interleaved SEPI (assuming 256 k-space lines in total). Each k-space line is labeled as kj, with k as the shot number and j as the order on each interleave. Notice the center-out k-space trajectory. Thirty-two other shots are used to cover the lower half of k-space (dashed lines), with each line labeled as . (B) Sketch of the 2D k-space coverage by region. Each shaded region represents that part of k-space acquired at the same echo time. The number in each shaded region corresponds to the echo number in the echo train (Fig. 1). Each region contains 32 phase-encoding lines.
A formal means to compensate for the phase accrual due to local field inhomogeneities is to multiply each sampling point in k-space by the phase conjugate of the inhomogeneity accrued:
| (3) |
The difficulty in straightforward implementation of this method is that a Fourier transform of the corrected data must be applied for each (x,y) point. This is tantamount to having performed a generalized inverse transform in terms of the processing it would take to reconstruct the entire object. The main objective of this work was to show that this problem can be solved easily and quickly with a unique iterative Fourier transform approach between k-space and the imaging domain.
3. Materials and methods
3.1. Sequence design
Fig. 1 shows a sketch of the proposed 2D sequence diagram with a turbo speed factor of 4 (64-shot interleaved EPI to cover 256 k-space lines). Again, only the even echoes are sampled. The 0th echo is for calibration purposes only, and the first two echoes sample the same central k-space. The phase map derived from the first two echoes can be applied directly to later echoes without phase unwrapping. With high resolution (say, 256 or more k-space lines), the central k-space region (both regions 1 and 1′) is practically large enough to give a good estimate of the phase map. The phase evolution ϕ(x,y) between the first and second echoes is a linear function of ω0(x,y) and echo spacing ΔT:
| (4) |
This phase continues to evolve from echo to echo with the same functional form.
Fig. 2 shows a representative sketch of 2D k-space collected with a 64-shot interleaved SEPI sequence with a center-out trajectory. It takes the first 32 shots to cover the lower half of k-space and then another 32 shots to cover the upper half of k-space. The key observation here is that with the center-out k-space trajectory (and interleaving the data without an echo-time shift), the k-space data can be separated into regions in which the data are acquired at the same echo time (Fig. 2B) and, therefore, have the same phase evolution pattern. Regions in k-space are labeled with the corresponding echo number with which echo the data are acquired.
3.2. Iterative reconstruction approach
The main idea in this work was to take the data and merge them in a way that all data points have experienced effectively the same phase evolution — i.e., they act as if they were all collected at the same echo time. We do this by starting with the central part of k-space and modifying its phase and then going through an iterative approach as described below to absorb all the different k-space regions collected. Let L be the largest region index; we then multiply both sides of Eq. (3) by exp(iω0(x,y)LΔT):
| (5) |
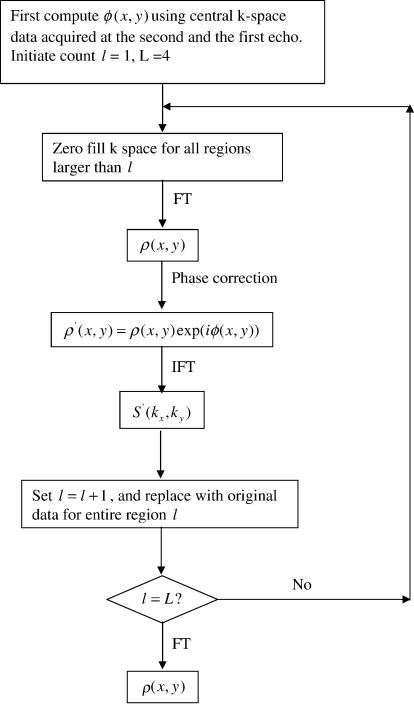
Eq. (5) now serves as a guide in defining the iterative procedure. To correct from the center of k-space outward, first replace all data points in k-space in regions other than 1 and 1′ with zero. Then, Fourier transform the zero-filled k-space to the image domain to get a complex image ρ(x,y). Next, multiply ρ(x,y) with exp(iϕ(x,y)) to get ρ′(x,y). Then, Fourier transform ρ′(x,y) back to k-space and replace the data points in regions 2 and 2′ with the original data points. These new k-space data are in theory the same as those that would have been acquired if all the data in all regions (1, 1′, 2 and 2′) had been collected at the third echo (i.e., the data points in regions 1 and 1′ appear as if they had been collected at the same time as those in regions 2 and 2′). Theoretically, there will be no phase discontinuity among regions 1, 1′ and 2, 2′ at this point. The next step is to let region represent the merged k-space of all regions (1, 1′, 2 and 2′). The same procedure can now be applied to phase correct region to eliminate the effect of the phase evolution between echo three and echo four and create a new k-space that appears as if it was collected at the fourth echo. This method is continued one more time to correct for the phase evolution to the fifth echo. The final image will now appear to have been acquired (at least as far as phase effects are concerned) at effectively one echo time, the final echo time. The proposed iterative reconstruction approach is also illustrated in the flowchart in Fig. 3.
Fig. 3.
Schematic flowchart of the iterative reconstruction method.
3.3. Simulation
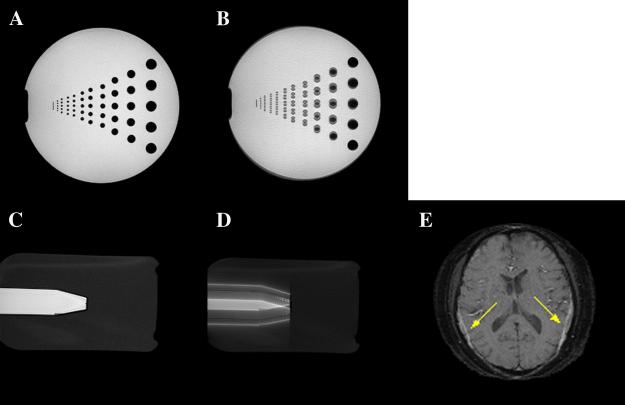
For the SEPI, the currently accepted technique is the ETS method [3]. ETS effectively reduces the k-space discontinuities between k-space lines. The ETS method helps reduce imaging artifacts such as ghosting, blurring and Gibbs ringing, but image distortion still remains. Combining the center-out k-space trajectory and ETS not only doubles image distortion compared with the bottom–up k-space trajectory but also adds additional distortion in the opposite direction. Fig. 4 shows the distortion artifacts related to the center-out k-space trajectory and ETS with both phantom simulation and an in vivo acquisition. Fig. 4B and D show simulated SEP images with ETS and the center-out k-space trajectory, respectively. The resolution phantom (Fig. 4B) indicates that ETS is not a suitable method for center-out k-space trajectory approach since the double-direction distortion makes a mess of smaller structures. Both the oil/water phantom (Fig. 4D) and the in vivo image (Fig. 4E) show a large fat shift in both directions. Obviously, the overlay of shifted fat signal on the brain parenchyma (pointed by yellow arrows) creates bad artifacts.
Fig. 4.
(A) Gradient-echo phantom image as a reference. (B) Simulated SEP image with ETS and center-out k-space trajectory. Note the duplication of the circles into two components. (C) Gradient-echo oil/water phantom as a reference. (D) Simulated SEP image with ETS and center-out k-space trajectory. Note the duplication of the oil into two components. (E) In vivo brain image with ETS and center-out k-space trajectory. Note the splitting of the fat into two components each shifting in opposite directions (yellow arrows in Fig. 4E).
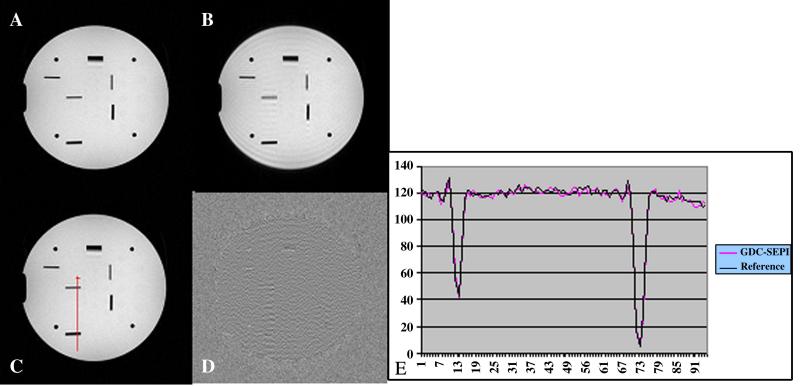
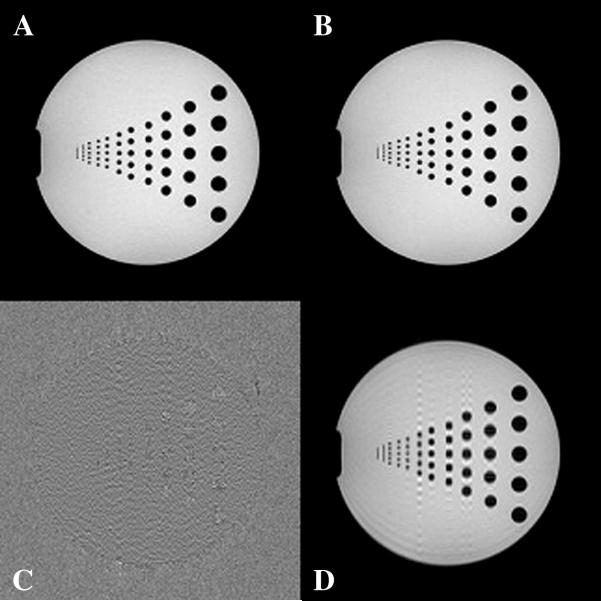
How well does the proposed method fare under different conditions such as a smoothly varying field like the resolution phantom or sharp field changes like the water/oil phantom? We simulated images using k-space data sets acquired with a multi-echo gradient-echo sequence. The multi-echo sequence has fixed echo spacing such that we could reassemble k-space from a set of k-space lines coming from different echo times as if the reassembled k-space had been acquired with the proposed SEPI sequence with a center-out k-space trajectory. Figs. 5 and 6 demonstrate that when the field is varying smoothly such that the phase map from the central k-space represents the phase reasonably well, the proposed geometric distortion-corrected (GDC) SEPI method works superbly. Measured profiles (Fig. 5) indicate that the biggest residuals are actually still within the noise level. Fig. 6 shows dramatically reduced coherent ringing as well.
Fig. 5.
(A) Gradient-echo image as a reference. (B) Simulated image without proposed iterative phase correction. (C) Corrected GDC-SEP image. (D) Residual image between (A) and (C). (E) Measured profiles across the pixels along the red line in (D). Note that the red line is across the visible coherent ringings between two resolution bars, which also happens to be close to the highest residual error. The measured profiles indicate that the biggest residual is still within the noise level.
Fig. 6.
(A) Reference gradient-echo image. (B) GDC-SEP image after phase correction. (C) Residual image between (A) and (B). (D) Image (B) before phase correction. Note the dramatically reduced coherent ringing after phase correction.
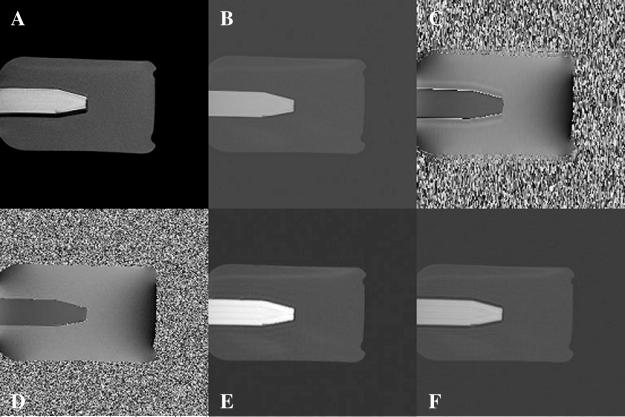
In the case of rapid field changes such as those shown in Fig. 7, central k-space is not large enough to give a good estimation of the field at the boundary of the oil and water (Fig. 7C). Poor estimation of the phase results in signal loss at the boundaries (Fig. 7F). If we use the whole k-space to estimate the phase (Fig. 7D), then the signal lost gets recovered (Fig. 7E). However, both Fig. 7E and F have the same ringing artifacts (caused by the T2* difference between oil and water). Accounting for phase variations from echo to echo does not correct the artifacts related to discontinuities in k-space caused by T2* decay. Furthermore, Fig. 7A shows a simulated SEP image showing a major fat shift along the phase-encoding direction. Compared with Fig. 7A, the fat signal in Fig. 7D and that in Fig. 7E do not shift relative to the reference image. This demonstrates that the proposed method is accomplishing its goal of removing geometric distortion.
Fig. 7.
(A) SEP image. (B) Gradient-echo image. (C) Phase image from central k-space. (D) Phase image from all of k-space. (E) GDC-SEP image using (D) as a phase map. (F) GDC-SEP image using (C) as a phase map.
3.4. Image acquisition parameters
Both phantom and in vivo data were acquired on a 1.5-T Siemens Sonata (Erlangen, Germany) system. The phantom data were acquired with the following parameters: resolution, 0.5×1×2 mm3; 64 slices; number of echoes in the readout echo train, 5; echo spacing (ΔT)=8 ms; echo time of the first echo, 10 ms; and TR, 51 ms. The in vivo data were acquired with resolution=1×1×2 mm3, 64 slices, number of echoes in the readout echo train=5, echo spacing=7.5 ms, echo time of the first echo=22.5 ms and TR=61 ms. The original raw data sets were downloaded to a PC for offline image reconstruction and the proposed phase correction.
4. Results
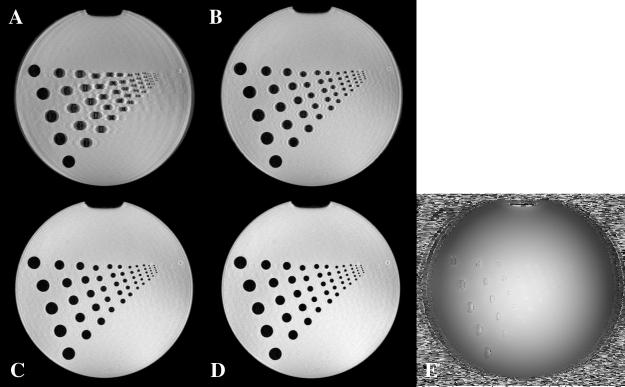
Fig. 8A is a phantom magnitude image reconstructed from the raw data acquired with the sequence shown in Fig. 1 without any phase correction. The largest resolution circle is reasonably well delineated with the central k-space region alone. The phase discontinuities between echoes cause severe artifacts, including distortion, ghosting and blurring for the low-resolution circles. Fig. 8B and C are the intermediate results after the first and second iterations of the proposed phase correction, respectively. Fig. 8D is the result after the final iteration of the phase correction. From Fig. 8B to C to D, we see continued improvement of the image quality, although much of the improvement comes after the first iteration. Further effects refine the higher-resolution components as expected, albeit only to the degree that the central phase correctly estimates the high-resolution phase behavior. After the full correction, geometric distortion, ghosting and blurring are mostly gone, which indicates successful reduction of the effects of phase evolution between echoes. However, the correction is not perfect in the area of the smallest circles. There are residual ripples that are the result of missing high-frequency information in the phase map. There is also some remnant low-spatial-frequency Gibbs ringing present.
Fig. 8.
(A) Magnitude image reconstructed without the proposed iterative phase correction. (B) Magnitude image reconstructed after the first iteration. (C) Magnitude image reconstructed after the second iteration. (D) Magnitude image reconstructed after the final (third) iteration of the phase correction. (E) Phase map estimated from the central k-space.
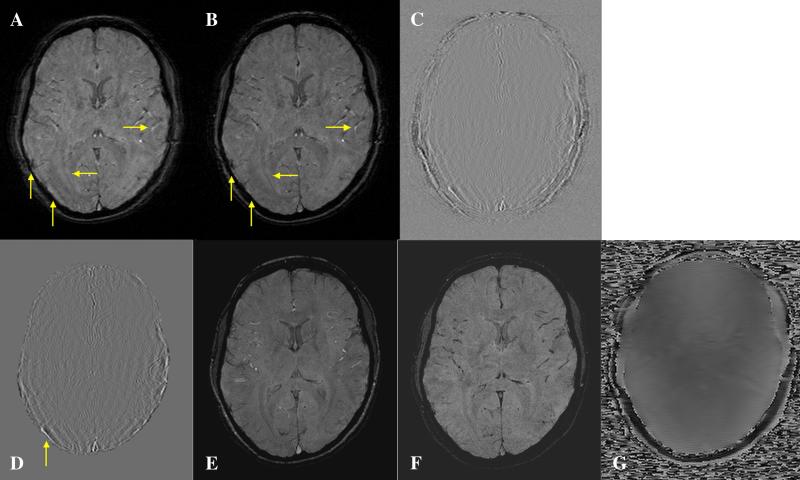
Part of the motivation for this work was the need to obtain SW images that first could be acquired quickly at 1.5 T and second would appear to be flow compensated for arterial flow. To demonstrate that this is possible, we used the sequence shown in Fig. 1 to acquire raw data in vivo for a neuroimaging example. For SWI, we need a longer echo time [4], so we began the sequence with the first echo time being 22.5 ms and echo spacing of 7.5 ms. With a turbo speed factor of 4 (64-shot EPI to cover 256 k-space lines), this sequence only took about 4 min to cover 64 slices (whole brain coverage) instead of the usual 16 min. Fig. 9A shows a magnitude image reconstructed simply with the usual Fourier transform without any phase correction. Blurring is seen throughout the image especially where there is fat. Fig. 9B shows a magnitude image reconstructed after the proposed phase correction. Fig. 9B shows the improvement in the sharpness of the image. Two residual images (Fig. 9C and D) between Fig. 9A and B are displayed as well to show the improvement with the iterative phase correction technique. Fig. 9C reveals that the dominant residual error is in the neighborhood of fat signal. Fig. 9D shows only the area of brain parenchyma in order to appreciate the improvement of fine structures in the brain. Fig. 9E shows a magnitude image acquired with a conventional SWI sequence (with TE/TR=40/57 ms) (which took about 8 min to cover only 32 slices or half of the brain) and serves as a reference image here. For the conventional SW image, arterial and venous signals are naturally separated with the arterial signal being bright and the venous signal being dark. Fig. 9F shows a magnitude image acquired with a Siemens SEPI sequence. Both arteries and veins appear dark in Fig. 9F. This makes separating arteries and veins problematic. The center-out k-space acquisition used to acquire Fig. 9B leads to bright arteries and dark veins as expected and produces contrast similar to that seen with conventional SWI. There does remain some vessel misregistration artifact caused by the fact that only the central part of k-space is flow compensated in the phase-encoding direction.
Fig. 9.
(A) Magnitude image of a human brain before the proposed phase correction. (B) Magnitude image reconstructed after the proposed phase correction. (C) Residual image between (A) and (B). (D) Same as (C) showing only the signal change in the area of brain parenchyma. (E) Magnitude image acquired with a conventional SWI sequence. (F) Magnitude image acquired with a sequential sampled SEPI sequence. (G) Phase map estimated from the central k-space. Note the sharpened vessel and optic radiation [horizontal arrows in (A) and B)]. The vertical arrows point to the much improved magnitude image.
5. Discussion
The results shown here represent an improvement in image quality and visualization of arteries compared with a sequential SEPI approach with ETS correction. The method is fast, requires no phase unwrapping and no extra reference scan and should be easily implemented online. However, there is a tradeoff between the turbo speed factor and the accuracy of the phase map. Practically, this approach becomes better and better as the matrix size increases and the number of shots remains the same. Along the same lines, if one could use an extra reference scan to get an accurate high-resolution phase map if time or motion between scans is not an issue, all shift effects would be ideally corrected. Furthermore, the use of higher resolution should improve the response for the smaller structures and fat signal, which was not possible with the current implementation of the central k-space approach (see Fig. 9A and B). For example, for a 1024 acquisition, the central 256 points would be used to estimate phase and would be flow compensated as well, yielding even better recovered arterial signal. This is of particular value in methods such as SWI, where small veins and microbleeds are the major foci.
For any high-resolution 3D imaging SWI method, a small voxel size requires a fairly low bandwidth to ensure enough signal-to-noise ratio. This implies that the turbo speed factor cannot be too high, for otherwise the duration of the echo train would be too long and T2* filtering will become a problem. Of course, as with any segmented approach, one assumes that the subject does not move between scans. However, using more modern techniques (e.g., propeller) may make segmented methods more viable in the future [16]. It is of interest to note that this method works very well on the sharp edges of the phantom, which is often very difficult for any reconstruction method to accomplish. Often, methods that do poorly on phantoms do reasonably well on human data. This gives us the confidence that it should be possible to fine-tune any remnant error in the human data from perhaps eddy current or other effects over time to make this approach viable clinically.
Although we performed the iterative procedure from the central data outward, in principle, this process could also be done from the outermost k-space toward the center. In practice, we found that this approach was not as robust as the correction done from the center of k-space outward. The reason for this could be that the phase estimate from the center of k-space was not accurate enough to represent the high-spatial-frequency components well.
The overall improvement of the clinically relevant images may not be as evident as that of the phantoms that have very sharp edges, but they are equally important. For example, Fig. 9B has dramatically sharpened edges. This can be understood from the fact that the center of k-space already creates a reasonable (albeit blurred) low-resolution image itself. This GDC-SEPI method attempts to correct the local blurring (which is actually a form of ghosting or aliasing that manifests as only small shifts of several pixels and hence can equally be called blurring). This blurring is another form of geometric distortion in this case, where it is most evident both in the fat and at air–tissue interfaces, such as the edge of the brain. With the iterative correction, Fig. 9B now has better definition of the internal structures, sharper edges and no remnant fat shift and is much closer to the standard SW image compared with the sequential SEPI approach shown in Fig. 9F.
6. Conclusions
In summary, we have introduced a new iterative phase correction method that makes it possible to collect and correct for full 2D phase evolution in interleaved SEPI. The method is capable of removing chemical shift and geometric distortion. If this proves to be robust in clinical situations, then the method would have major implications for high-resolution clinical applications of sequences such as SWI.
Acknowledgments
This work was supported in part by grants NIH 2R01 HL062983 and State of Michigan 085P5200251.
References
- 1.Mansfield P. Multi-planar image formation using NMR spin echoes. J Phys Chem. 1977;10:L5–L58. [Google Scholar]
- 2.Haacke EM, Bearden FH, Clayton JR, Linga NR. An iterative recontructive technique for GDC-SEPI. Radiology. 1986;158:521–9. doi: 10.1148/radiology.158.2.3941881. [DOI] [PubMed] [Google Scholar]
- 3.Feinberg DA, Oshio K. Phase errors in multi-shot echo planar imaging. Magn Reson Med. 1994;32:535–9. doi: 10.1002/mrm.1910320418. [DOI] [PubMed] [Google Scholar]
- 4.Luk Pat GT, Meyer CH, Pauly JM, Nishimura DG. Reducing flow artifacts in echo-planar imaging. Magn Reson Med. 1997;37:436–47. doi: 10.1002/mrm.1910370323. [DOI] [PubMed] [Google Scholar]
- 5.Beck G, Li D, Haacke EM, Noll TG, Schad LR. Reducing oblique flow effects in interleaved EPI with a center reordering technique. Magn Reson Med. 2001;45:623–9. doi: 10.1002/mrm.1084. [DOI] [PubMed] [Google Scholar]
- 6.Haacke EM, Xu Y, Cheng YN, Reichenbach JR. Susceptibility weighted imaging. Magn Reson Med. 2004;52:612–8. doi: 10.1002/mrm.20198. [DOI] [PubMed] [Google Scholar]
- 7.Weisskoff RM, Davis TL. Correcting gross distortion on echo planar images.. Proceeding of the SMRM 11th Annual Meeting; Berlin. 1992.p. 4515. [Google Scholar]
- 8.Jezzard P, Bababan RS. Correction for geometric distortion in echo planar images from B0 field variations. Magn Reson Med. 1995;34:65–73. doi: 10.1002/mrm.1910340111. [DOI] [PubMed] [Google Scholar]
- 9.Reber PJ, Wong EC, Buxton KB, Frank LR. Correction of off resonance-related distortion in echo-planar imaging using EPI-based field maps. Magn Reson Med. 1998;39:328–30. doi: 10.1002/mrm.1910390223. [DOI] [PubMed] [Google Scholar]
- 10.Liang ZP. A model-based method for phase unwrapping. IEEE Trans Med Imaging. 1996;15:893–7. doi: 10.1109/42.544507. [DOI] [PubMed] [Google Scholar]
- 11.Wan X, Gullberg GT, Parker DL, Zeng GL. Reduction of geometric and intensity distortions in echo-planar imaging using a multireference scan. Magn Reson Med. 1997;37:932–44. doi: 10.1002/mrm.1910370619. [DOI] [PubMed] [Google Scholar]
- 12.Chen NK, Wyrwicz AM. Correction for EPI distortion using multi-echo gradient-echo imaging. Magn Reson Med. 1999;41:1206–13. doi: 10.1002/(sici)1522-2594(199906)41:6<1206::aid-mrm17>3.0.co;2-l. [DOI] [PubMed] [Google Scholar]
- 13.Chen NK, Wyrwicz AM. Optimized distortion correction technique for echo planar imaging. Magn Reson Med. 2001;45:525–8. doi: 10.1002/1522-2594(200103)45:3<525::aid-mrm1070>3.0.co;2-s. [DOI] [PubMed] [Google Scholar]
- 14.Schomberg H. Off-resonance correction of MR images. IEEE Trans Med Imaging. 1999;18:481–95. doi: 10.1109/42.781014. [DOI] [PubMed] [Google Scholar]
- 15.Noll DC, Meyer CH, Pauly JM, Nishimura DG, Macovski A. A homogeneity correction method for magnetic resonance imaging with time-varying gradients. IEEE Trans Med Imaging. 1991;10:629–37. doi: 10.1109/42.108599. [DOI] [PubMed] [Google Scholar]
- 16.Pipe JG. Motion correction with PROPELLER MRI: application to head motion and free-breathing cardiac imaging. Magn Reson Med. 1999;42:963–9. doi: 10.1002/(sici)1522-2594(199911)42:5<963::aid-mrm17>3.0.co;2-l. [DOI] [PubMed] [Google Scholar]


