

Abstract
Dendritic spines are the site of the majority of excitatory synapses, the loss of which correlates with cognitive impairment in patients with Alzheimer disease. Substantial evidence indicates that amyloid-β (Aβ) peptide, either insoluble fibrillar Aβ deposited into plaques or soluble non-fibrillar Aβ species, can cause spine loss but the concurrent contributions of fibrillar Aβ and non-fibrillar Aβ to spine loss has not been previously assessed. We used multiple-label immunohistochemistry to measure spine density, size, and f-actin content surrounding plaques in the cerebral cortex in the PSAPP mouse model of Aβ deposition. Our approach allowed us to measure fibrillar Aβ plaque content and an index of non-fibrillar Aβ species concurrently. We found that spine density was reduced within 6 μm of the plaque perimeter, remaining spines were more compact, and f-actin content per spine was increased. Measures of fibrillar Aβ plaque content were associated with reduced spine density near plaques, whereas measures of non-fibrillar Aβ species were associated with reduced spine density and size, but not altered f-actin content. These findings suggest that strategies to preserve dendritic spines in AD patients may need to address both non-fibrillar and fibrillar forms of Aβ and that non-fibrillar Aβ may exert spine toxicity through pathways not mediated by depolymerization of f-actin.
Keywords: Alzheimer disease, Amyloid beta, Dendritic spine, Genetic mouse models, Phalloidin, X-34
INTRODUCTION
Alzheimer disease (AD) is the most common form of dementia and is characterized clinically by progressive loss of memory and cognitive function and progressive impairments in behavior. A number of neurodegenerative changes underlie these clinical manifestations. Two neuropathologic hallmarks of AD are extracellular amyloid plaques composed of amyloid-β (Aβ) peptide and intracellular neurofibrillary tangles, consisting of hyperphosphorylated microtubule-associated protein tau (1, 2). Other pathologic changes include widespread cortical synapse loss, neuronal loss, and reactive gliosis (3). Of these pathologic alterations, loss of synapses is the best structural correlate of cognitive impairments in AD (4, 5). Genetic, in vitro, and in vivo studies have implicated soluble Aβ as a primary cause of the synapse loss in AD (6).
In cerebral cortex, dendritic spines are the site of the majority of excitatory synapses. Substantial evidence indicates that progressive loss of dendritic spines in AD is due to effects of Aβ, either insoluble fibrillar Aβ deposited into amyloid plaques, or non-fibrillar Aβ species lacking amyloid structure, the latter including soluble oligomers and protofibrils (7). In organotypic slice culture, both exogenous exposure to soluble Aβ and overexpression of endogenous Aβ by neurons dramatically reduce dendritic spine density (8, 9). Transcranial multiphoton imaging studies in transgenic mouse models of AD have shown that dendrites passing through or near fibrillar Aβ plaques undergo spine loss (10, 11). Transgenic mouse model studies have also revealed that fibrillar Aβ plaques are surrounded by a halo of oligomeric Aβ and have reported a loss of excitatory synapses within this halo region (12). Confocal microscopy in the PSAPP mouse model and in AD autopsy brain tissue has confirmed reduced densities of dendritic spines in proximity to fibrillar Aβ plaques (13). While informative, these studies did not address the relative contributions to dendritic spine loss of fibrillar Aβ in plaques and concurrently measured non-fibrillar (soluble) Aβ species.
Current understanding of dendritic spine maintenance and elimination has focused mainly on the regulation of the spine f-actin network. Long-term potentiation (LTP) is a form of activity-dependent synaptic plasticity that is widely believed to be the cellular basis for learning and memory. Enlargement of single spines has been shown to be associated with LTP (14), and requires polymerization of g-actin into f-actin (15). Conversely, long-term depression (LTD), another form of activity-dependent plasticity, has been shown to induce dendritic spine shrinkage and elimination via f-actin depolymerization (15–17). Studies conducted in rodent hippocampus have demonstrated that soluble Aβ oligomers can enhance LTD and inhibit LTP, suggesting that Aβ-induced spine loss engages mechanisms that reduce f-actin content in spines. (18,19).
In the present study, we used a novel multiple-label immunohistochemical approach in the PSAPP transgenic mouse model of Aβ deposition to measure spine density, size, and f-actin content surrounding plaques in the cerebral cortex. In addition, our approach allowed us to concurrently measure fibrillar Aβ plaque content and an index of non-fibrillar Aβ species, examining their relationship to spine parameters. We found that dendritic spine density was reduced and remaining spines were more compact within 6 μm of the plaque perimeter, with a concomitant increase in f-actin content per spine. Measures of fibrillar Aβ plaque content were associated with reduced spine density near plaques, while measures of non-fibrillar Aβ species were associated with reduced spine density, size, and shape complexity, but not with altered f-actin content.
MATERIALS AND METHODS
Transgenic Animals
Double transgenic PSAPP mice were generated by mating male APP Tg2576 (K670N/M671L) mice (20) (Taconic Farms, Germantown, NY) with female M146L PS1 mice (mutant PS1, line 6.2, University of South Florida) (21). The Tg 2576 mice were derived from a C57B6/SJL × C57B6 background; the M146L PS1 animals were derived from a Swiss-Webster/B6D2F1 × B6D2F1 background (22). Food and water were available ad libitum and a 12/12-hour light/dark cycle was maintained. All studies were approved by the University of Pittsburgh Institutional Animal Care and Use Committee. All mice were male to circumvent concerns about estrous cycling.
Tissue Preparation and Immunohistochemistry
PSAPP mice were anesthetized with isoflurane and perfused transcardially with phosphate buffer followed by cold 4% paraformaldehyde. Brains were removed, immersion-fixed in cold 4% paraformaldehyde for 24 hours and cryoprotected in a series of 15% and 30% sucrose solutions. Sections were cut coronally at 40 μm on a freezing sledge microtome and stored at −20°C in cryoprotectant solution (23). A single section was selected for analysis from each of 4 12-week-old, 3 15-week-old, and 4 18-week-old mice, matched for rostral-caudal level using cytoarchitectonic features (~bregma −2.30 mm [24]).
Histochemical staining of fibrillar Aβ plaques was performed using X-34, a highly fluorescent Congo red derivative, which binds peptides and proteins in fibrillar β-pleated sheet conformations (“amyloid”) with a high affinity (25). Because immunoreactivity of fibrillar Aβ plaques to anti-Aβ antibodies is weak unless a formic acid pre-treatment is used to break up the fibrillar β-pleated sheet structure (25), we used 3 different antibodies, each in the absence of formic acid pre-treatment, to visualize non-fibrillar Aβ. The 6E10 antibody (biotinylated, SIG-39340; Covance, Emeryville, CA) is directed against the N-terminus of human Aβ peptide. The 4G8 antibody (biotinylated, SIG-39240, Covance) is directed against Aβ amino acids 17–24. Western blot analyses provide clear evidence that 6E10 and 4G8 are reactive with soluble monomeric and oligomeric species of Aβ (26, 27). Because both of these antibodies may cross-react with the Aβ precursor protein (APP), we also used the anti-Aβx-40 antibody (AB5074P; Millipore, Temecula, CA), which is directed against the neo-epitope at amino acid 40 of the Aβ peptide and has human and mouse species reactivity. This antibody predominantly labels Aβ 1-40, and does not label longer Aβ forms (e.g. 1-42) or full-length APP (28). Histochemical staining of dendritic spines was accomplished with the f-actin binding mushroom toxin phalloidin, conjugated to Alexa Fluor 568 (A12380; Invitrogen, Eugene, OR) (29). Although a direct, linear relationship specifically between phalloidin fluorescence intensity and f-actin concentration has not been firmly established, we have previously shown that detected fluorescence intensity is directly related to the intensity of fluorescent microspheres embedded in thick sections, and can be used to measure protein concentration accurately (30, 31)
Free-floating tissue sections were incubated in 1% NaBH4 for 30 minutes followed by a 3-hour incubation at room temperature in phosphate buffered saline (PBS) containing 5% normal human serum, 5% goat serum, and 0.3% Triton X-100, and then incubated with PBS containing 5% normal human serum, 5% goat serum, and a 1:1000-dilution of biotinylated 6E10 antibody, a 1:1000 dilution of biotinylated 4G8 antibody, or a 1:100 dilution of anti-Aβx-40 antibody for 24 hours at 4°C. Next tissue sections were incubated for 24 hours at 4°C in PBS containing 5% normal human serum, 5% goat serum, phalloidin conjugated to Alexa Fluor 568 at a concentration of 1.5 μL/mL and either a 1:500 dilution of streptavidin conjugated to Alexa Fluor 488 (Invitrogen) or 1:500 goat anti-rabbit secondary antibody conjugated to Alexa Fluor 488 (Invitrogen). All tissue sections were then mounted on slides and after drying for 1 hour the sections were rehydrated for 5 minutes in PBS. Sections were incubated for 10 minutes in 100 μM stock solution of X-34, and then dipped in distilled water and incubated in 0.2% sodium hydroxide made in 80% unbuffered ethanol for 2 minutes; they were then soaked in distilled water for 10 minutes. Sections were coverslipped with Vectashield hard set (Vector Laboratories, Burlingame, CA). Final mean section thickness was 10.45 ± 4.409 μm (SD). Sections were processed and analyzed in 2 separate immunohistochemistry runs.
Microscopy
Data acquisition was performed on an Olympus (Center Valley, PA) BX51 WI upright microscope equipped with an Olympus spinning disk confocal (SDCM) using an Olympus PlanAPO N 60X 1.42 N.A. oil immersion objective. The SDCM was equipped with an ORCA-R2 camera (Hamamatsu, Bridgewater, NJ), MBF CX9000 front mounted digital camera (MicroBrightField, Inc., Natick, MA), BioPrecision2 XYZ motorized stage with linear XYZ encoders (Ludl Electronic Products Ltd., Hawthorne, NY), excitation and emission filter wheels (Ludl Electronic Products Ltd), and equipped with a Sedat Quad 89000 filter set (Chroma Technology Corp., Bellows Falls, VT). The microscope was controlled by Stereo Investigator software (MicroBrightField, Inc.) and illuminated using a Lumen 220 metal halide lamp (Prior Scientific, Rockland, MA).
Using Stereo Investigator software, the cerebral cortex of each tissue section was first outlined and a systematic random sampling grid was then randomly rotated and applied to each tissue section (Figure, Supplemental Digital Content 1, http://links.lww.com/NEN/A474). At each site, defined by the intersection of the grid with the cortical gray matter, the investigator determined if a visible single plaque (defined by the presence of X-34-positive staining) was present within the 512 × 512 field of view at high power. When a single plaque was present it was then recentered in the field of view and, if it fit within the 512 × 512 pixels window of uniform fluorescence illumination, it was used for quantification, that is, an image stack was collected.
Each 3-dimensional image stack consisted of image planes of 512 × 512 pixels (~ 3058 μm2) that were separated by 0.25 μm and acquired throughout the tissue section starting at the slide. At each plane, data were collected using the following filters: excitation 403 ± 6 nm/emission 457 ± 25 nm, excitation 490 ± 10) nm/emission 528 ± 19 nm, and excitation 555 ± 14 nm/emission 617 nm ± 37 nm. Exposure times (150 seconds, 1000 seconds, and 1100 seconds, respectively) were maintained for all experiments and there were no instances of pixel saturation in any stack.
Image Processing
To control for differences in background fluorescence intensity across animals, sections, and image stacks, the mode of the histogram was identified and subtracted. The choice of this approach reflected several considerations. First, because labeled objects of interest (i.e. dendritic spines) represent a minority of the voxels, the modal value is reflective of the background. Second, this approach is without the potential for operator bias. Third, non-specific background fluorescence is variable between sites and across samples (32), particularly in tissue sections.
Following background subtraction, the phalloidin channel was transformed to enhance automated detection of dendritic spines. Specifically, the final output was a subtraction of Gaussian filter channels of 2 different standard deviations of the Gaussian distribution s(σ) ([σ = 0.7] − [σ = 2.0]). Figure, Supplemental Digital Content 2, http://links.lww.com/NEN/A475 demonstrates this concept with a 500-nm fluorescent bead. Data segmentation of the Gaussian filter transformation of the phalloidin channel to create binary mask objects was performed as previously described (30) except that threshold settings were evenly spaced (50 grey levels; Fig. 1A). This approach provides for quantification of large numbers of phalloidin-labeled objects, with little contribution of non-specific fluorescent signal (Figure, Supplemental Digital Content 3, http://links.lww.com/NEN/A476). Image channels for non-fibrillar Aβ, fibrillar Aβ plaques and phalloidin, but not the Gaussian filter transformation channel, were deconvolved using the constrained iterative algorithm included in SlideBook 5.13. After deconvolution, a region of interest containing the entire fibrillar Aβ plaque was manually defined and a threshold segmentation set at 50 grayscale units above background was applied to the X-34 channel intensity to generate a binary mask object of the plaque. Twelve contiguous 3-dimensional concentric shells were constructed around the outer edge of the fibrillar Aβ plaque (Fig. 1B). Each shell was created using the mask dilation command in SlideBook, which allowed each shell mask, starting with the mask of the plaque, to be increased in radial size by exactly 2 μm from the prior mask. The prior mask was then subtracted from this larger mask to create each shell. The coordinates of the centroid for each phalloidin channel mask object were used to assign each mask object to a single shell, allowing for the analysis of dendritic spine density, morphology, and relative fluorescence intensity at known distances from the fibrillar Aβ plaque.
Figure 1.

Approach to image processing. (A.1–A.3) Image processing. Raw single plane image of dendritic spines labeled with phalloidin (red), amyloid-β (Aβ)-Immunoreactivity (green), and fibrillar Aβ plaque (blue) (A.1). The raw image was processed using the constrained iterative (CI) algorithm deconvolution for the Aβ-Immunoreactivity (green) and fibrillar Aβ plaque (blue) and the Gaussian filter transformation for dendritic spines (red). Dendritic spines are now clearly defined punctate structures and the amyloid and Aβ-Immunoreactive structures are refined (A.2). Generation of a binary mask (blue) using Iterative threshold segmentation of the Gaussian filter transformation (red) from the image seen in (A.2) shows the precision of dendritic spine coverage achieved using this processing technique. For extraction of relative fluorescence intensity within spines, the mask shown is overlayed on the CI deconvolved phalloidin channel (A.3). (B.1–B.3) Three-dimensional shells surrounding a plaque. A single plane from a CI deconvolved image with dendritic spines (red), Aβ-Immunoreactivity (green), and fibrillar Aβ plaque (blue) (B.1). Outline of the first 4 (of 12) shells used in the analysis; each is expanded by 2 μm from the edge of the fibrillar Aβ plaque overlayed on (A) (B.2). Three-dimensional surface rendering of lower half of the same image stack with a representative shell shown in dark blue (B.3).
Statistical Methods
Initial comparison of spine parameters as a function of distance (0 to 6 μm and greater than 6 μm) from the fibrillar Aβ plaque for the 134 measured plaques used linear mixed models with a first order autoregressive covariance structure. Subject level effects were animal, with repeated measures of plaque and shell. Fixed effects were fibrillar Aβ plaque volume, mean X-34 fluorescence intensity within the plaque, total non-fibrillar Aβ intensity within the shell, immunohistochemistry run, and (to control for any possible effects of the small difference in ages between mice) age group. For analysis of the impact of plaque and non-fibrillar Aβ effects on dendritic spine density, linear mixed models with a first order autoregressive covariance structure were used to analyze each concentric shell. Plaque was a repeated measure within animal, with fixed effects of fibrillar Aβ plaque volume, mean X-34 fluorescence intensity within the plaque, total non-fibrillar Aβ intensity within the shell, immunohistochemistry run, and age group. Spine density in each shell, i.e. at each distance from the plaque, was the dependent variable. Based on the results of the preceding linear mixed models, further analyses of spine density, morphology and total f-actin content per spine were conducted for shells within 0 to 6 μm of the plaque perimeter. These analyses used mixed models, with repeated measures within animals of plaque and shell, and fixed effects of fibrillar Aβ plaque volume, mean X-34 fluorescence intensity within the plaque, total non-fibrillar Aβ intensity within each shell, immunohistochemistry run, and age group. Additional models in which final section thickness was entered to evaluate whether section shrinkage during processing might have influenced the associations did not alter the results except where indicated. All intensity measurements used in the analyses were normalized across immunohistochemistry run to account for assay variability.
RESULTS
Detection of Aβ-Immunoreactivity Surrounding Fibrillar Aβ Plaques
Anti-Aβ antibodies 6E10, 4G8, and anti-Aβx-40 revealed a similar pattern of label concentrated in the immediate surrounding area of the X-34-positive fibrillar Aβ plaque (Fig. 2A). Three-dimensional surface renderings also demonstrated accumulation of Aβ-immunoreactivity around X-34-positive fibrillar Aβ plaques (Fig. 2B). Figure 3 graphically depicts the distribution of 6E10 antibody label as a function of distance from the plaque with the highest Aβ-immunoreactivity located adjacent to the plaque.
Figure 2.

Plaques dual-labeled with X-34 and anti- amyloid-β (Aβ) antibodies. (A) X-34 positive fibrillar Aβ plaques (red) and Aβ-Immunoreactivity detected with anti-Aβ antibodies (green). The antibodies, 6E10, 4G8, and anti-Aβx-40 label the N-terminus, amino acids 17–24, and the C-terminus neo-epitope of Aβ, respectively. Several examples shown for each antibody reveal a similar pattern of label external to the outside edge of the fibrillar Aβ plaque, and in the immediate surrounding areas. (B) Three-dimensional surface rendering of a plaque dual-labeled with X-34 and 6E10. The 3 rotated views illustrate the accumulation of Aβ-Immunoreactivity labeled with 6E10 (green) adjacent to and in the area surrounding an X-34-labeled fibrillar Aβ plaque (red).
Figure 3.

Amyloid-β (Aβ) immunoreactivity (total 6E10 fluorescence intensity) within each 3-dimensional shell as a function of distance from the plaque. The means of 134 plaques analyzed are shown. The majority of the Aβ-Immunoreactivity is concentrated within the first few μm of the fibrillar Aβ plaque. Bars indicate SEM.
Spine Density, Spine Morphology, and Mean Phalloidin Fluorescence Intensity Per Spine Vary as a Function of Distance from Fibrillar Aβ Plaques
Decreased dendritic spine density around fibrillar Aβ plaques was qualitatively observed with near complete spine ablation in the area occupied by the X-34-positive fibrillar Aβ plaque (Figure, Supplemental Digital Content 4, http://links.lww.com/NEN/A477), with reduced spine densities apparent out to a distance of 6 μm from the perimeter of the plaque (Fig. 4). Quantitative analyses of a total of 830,634 spines in the PSAPP mouse cortex confirmed that spine density was lower within this 6-μm perimeter of the Aβ plaque (Fig. 4; Table 1). In contrast, we analyzed spine densities in 16-week-old male C57BL6/J mice (Figure, Supplemental Digital Content 5, http://links.lww.com/NEN/A478). A phantom plaque was created in the middle of each image stack and 12 concentric shells were constructed as in the PSAPP mice and spine densities were calculated. There was no significant difference of spine density between any of the shells in the C57BL6/J mice.
Figure 4.
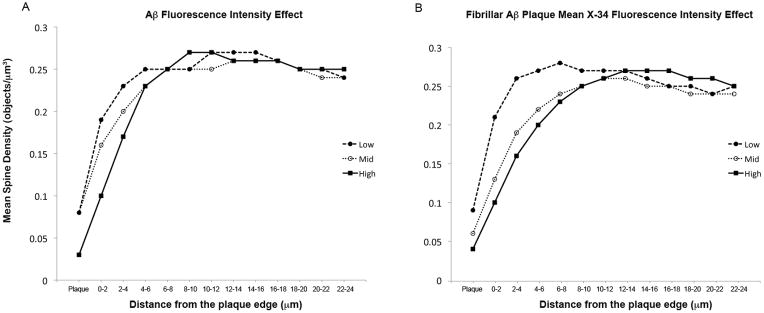
Mean spine density as a function of distance from the plaque. (A, B) Aβ-Immunoreactivity fluorescence intensity (A) and fibrillar Aβ plaque mean X-34 fluorescence intensity (B) are shown separated into low (●), medium (
 ), and high (■) tertiles to demonstrate graphically the effects evaluated in Table 2.
Table 1.
Summary of Dendritic Spine Characteristics as a Function of Distance from the Plaque (n = 134)
| Spine Parameter | Distance from Plaque | F (df) | p | |
|---|---|---|---|---|
| 0–6 μm | 6–24 μm | |||
| n = 110119 Spines | n = 720515 spines | |||
| Density, μm−3 | ||||
| Mean (SD) | 0.161 (0.12) | 0.2556 (0.10) | 629.63 | < 0.001 |
| Range | < 0.01–0.52 | < 0.01–0.53 | (1,1720) | |
| Volume, μm3 | ||||
| Mean (SD) | 0.076 (0.03) | 0.079 (0.03) | 13.80 | < 0.001 |
| Range | 0.01–0.19 | 0.02–0.20 | (1,1492) | |
| Surface Area, μm2 | ||||
| Mean (SD) | 1.41 (0.44) | 1.47 (0.44) | 23.47 | < 0.001 |
| Range | 0.27–3.18 | 0.61–3.04 | (1,1492) | |
| Shape Complexity, Sphericity−1 | ||||
| Mean (SD) | 1.64 (0.09) | 1.66 (0.08) | 57.04 | < 0.001 |
| Range | 1.37–2.02 | 1.46–1.89 | (1,1508) | |
| Normalized Total Phalloidin Intensity per Spine, gray level | ||||
| Mean (SD) | 29443 (26249) | 24287 (18620) | 25.08 | < 0.001 |
| Range | 68–279006 | 1832–223278 | (1,1558) | |
In addition to reductions in spine density within the 6-μm perimeter of the Aβ plaque, spine volume was lower in this region and spine surface area was reduced, resulting in a reduction in spine shape complexity (Table 1). Despite these changes in spine morphology, there was no decrease in mean phalloidin intensity per spine. In fact there was a significant increase in these values within the 6-μm perimeter, indicating an increased concentration of f-actin within these spines.
Relationships of Spine Density, Spine Morphology, and Mean Phalloidin Fluorescence Intensity Per Spine with Fibrillar Aβ Plaque Volume, Aβ Plaque Mean X-34 Fluorescence Intensity, and Non-Fibrillar Aβ 6E10 Fluorescence Intensity
Linear mixed models showed that a decrease in spine density was independently associated with greater fibrillar Aβ plaque mean X-34 fluorescence intensity the first 6 μm from the plaque and with greater total Aβ-immunoreactivity (6E10 fluorescence intensity) within the first 2 μm of the plaque edge (Table 2; Fig. 4). No significant effect was seen due to fibrillar Aβ plaque volume.
Table 2.
Stepwise linear regressions of spine densities starting within the fibrillar Aβ plaque and extending to a distance of 24 μm from the plaque perimeter
| Predictor Variable | Distance | Beta | T | P value |
|---|---|---|---|---|
| Fibrillar Aβ Plaque Mean X-34 Fluorescence Intensity | Plaque | −0.029 | −2.595 | 0.011 |
| 0 – 2 μm | −0.051 | −3.889 | <0.001 | |
| 2 – 4 μm | −0.040 | −3.349 | 0.001 | |
| 4 – 6 μm | −0.022 | −2.162 | 0.033 | |
| 6 – 8 μm | −0.012 | −1.308 | 0.194 | |
| 8 – 10 μm | −0.0002 | −0.018 | 0.985 | |
| 10 – 12 μm | 0.007 | 0.872 | 0.385 | |
| 12 – 14 μm | 0.010 | 1.147 | 0.254 | |
| 14 – 16 μm | 0.011 | 1.208 | 0.229 | |
| 16 – 18 μm | 0.008 | 0.883 | 0.379 | |
| 18 – 20 μm | 0.009 | 1.043 | 0.299 | |
| 20 – 22 μm | 0.019 | 1.993 | 0.049 | |
| 22 – 24 μm | 0.011 | 1.202 | 0.232 | |
| Aβ-Immunoreactivity (6E10 Fluorescence Intensity) | Plaque | −0.005 | −0.972 | 0.333 |
| 0 – 2 μm | −0.017 | −2.196 | 0.030 | |
| 2 – 4 μm | −0.020 | −1.945 | 0.054 | |
| 4 – 6 μm | −0.009 | −0.965 | 0.336 | |
| 6 – 8 μm | 0.001 | 0.098 | 0.922 | |
| 8 – 10 μm | 0.005 | 0.650 | 0.517 | |
| 10 – 12 μm | 0.002 | 0.197 | 0.844 | |
| 12 – 14 μm | 0.005 | 0.557 | 0.578 | |
| 14 – 16 μm | 0.008 | 0.996 | 0.321 | |
| 16 – 18 μm | 0.009 | 1.154 | 0.251 | |
| 18 – 20 μm | 0.013 | 1.627 | 0.106 | |
| 20 – 22 μm | 0.014 | 1.619 | 0.108 | |
| 22 – 24 μm | 0.016 | 2.002 | 0.047 | |
| Fibrillar Aβ Plaque Volume | Plaque | −5.546E-6 | −0.678 | 0.499 |
| 0 – 2 μm | −7.589E-6 | −0.748 | 0.456 | |
| 2 – 4 μm | −4.450E-6 | −0.469 | 0.640 | |
| 4 – 6 μm | −5.987E-6 | −0.746 | 0.457 | |
| 6 – 8 μm | −4.120E-6 | −0.570 | 0.570 | |
| 8 – 10 μm | −3.875E-6 | −0.571 | 0.569 | |
| 10 – 12 μm | −1.388E-6 | −0.202 | 0.840 | |
| 12 – 14 μm | −1.838E-6 | −0.262 | 0.794 | |
| 14 – 16 μm | 8.186E-7 | 0.119 | 0.905 | |
| 16 – 18 μm | 2.901E-6 | 0.409 | 0.683 | |
| 18 – 20 μm | 6.298E-6 | 0.921 | 0.359 | |
| 20 – 22 μm | −6.737E-6 | −0.912 | 0.364 | |
| 22 – 24 μm | 6.285E-6 | 0.981 | 0.329 |
Decreases in spine volume and surface area were significantly associated with non-fibrillar Aβ 6E10 fluorescence intensity within 6 μm of the fibrillar Aβ plaque edge (Table 3). Interestingly, the relative amount of f-actin as indexed by phalloidin fluorescence intensity measured per spine did not change as a function of Aβ-immunoreactivity (Table 3). There were no significant associations of fibrillar Aβ plaque mean X-34 fluorescence intensity with spine morphology or relative amount of f-actin.
Table 3.
Association of Spine Morphologic Measures with β-Amyloid and Plaque Features
| Dependent Measure | Predictor Variable | Distance from plaque Edge | |
|---|---|---|---|
| 0 to 6 μm | |||
| F (df) | P value | ||
| Spine Volume, μm3 | Aβ-Immunoreactivity (Normalized Total 6E10 Fluorescence Intensity) | 9.313 (1,393) | 0.002 |
| Fibrillar Aβ Plaque Volume | 0.008 (1,363) | 0.929 | |
| Fibrillar Aβ Plaque Mean X-34 Fluorescence Intensity | 1.527 (1,351) | 0.217 | |
| Spine Surface area, μm2 | Aβ-Immunoreactivity (Normalized Total 6E10 Fluorescence Intensity) | 8.643 (1,393) | 0.003 |
| Fibrillar Aβ Plaque Volume | 0.060 (1,356) | 0.807 | |
| Fibrillar Aβ Plaque Mean X-34 Fluorescence Intensity | 1.284 (1,343) | 0.258 | |
| Spine Shape Complexity, Sphericity−1 | Aβ-Immunoreactivity (Normalized Total 6E10 Fluorescence Intensity) | 8.760 (1,378) | 0.003 |
| Fibrillar Aβ Plaque Volume | 1.895 (1,297) | 0.170 | |
| Fibrillar Aβ Plaque Mean X-34 Fluorescence Intensity | 0.013 (1,273) | 0.911 | |
| Total Phalloidin/Spine, gray level | Aβ-Immunoreactivity (Normalized Total 6E10 Fluorescence Intensity) | 0.340 (1,390) | 0.560 |
| Fibrillar Aβ Plaque Volume | 0.144 (1,373) | 0.705 | |
| Fibrillar Aβ Plaque Mean X-34 Fluorescence Intensity | 0.648 (1,364) | 0.421 | |
Aβ, β-amyloid.
DISCUSSION
Spine Density and Morphology Alterations are Present Surrounding Fibrillar Aβ Plaques
We observed significant decreases in spine density within the first 6 μm beyond the perimeter of fibrillar Aβ plaque due to independent contributions of fibrillar Aβ plaque content and content of Aβ-immunoreactivity. A study by Spires et al utilizing 21- to 25-month-old Tg2576 mice similarly reported that distance from plaque perimeter correlates with deficits in spine density (10). In that study, plaque area (similar to plaque volume in the current report) was also not correlated with spine loss (10); however, the investigators found that the correlation between distance from the plaque and reduced spine density extended up to 20 μm. This discrepancy likely reflects the differences in mouse strain, in the ages and degree of plaque pathology of these animals, and/or differences in imaging methodologies between that and the current study.
In addition to reductions in spine density, we found decreases in surface area and shape complexity, and a trend towards decreased spine volume surrounding plaques. These findings suggest that spine physiology could be altered even before their disappearance. Soluble Aβ species have been shown to engage LTD and inhibit LTP pathways (18,19), processes that typically leads to spine loss via spine f-actin depolymerization (15). It was therefore somewhat surprising that when investigating the relative amount of f-actin, as indexed by total phalloidin fluorescence measured per spine, we did not observe net reductions in spines close to plaques. In fact, we saw an increase in phalloidin total intensity within smaller, more spherical spines. Thus, the mechanism of spine morphology changes, at least initially, and does not appear to be through net depletion of f-actin, but through restructuring of the cytoarchitecture. Actin filaments in the spine head are very dynamic and there are several mechanisms by which actin polymerization and depolymerization are regulated to influence the spatial arrangement of f-actin in spines. For example Arp2/3 binds to existing actin filaments to nucleate new filaments and facilitate branching (33). Another actin-regulating molecule, myosin II, binds and contracts actin filaments and is required for proper spine morphology (34). Drebrin is an actin-binding protein localized in spines that is thought to inhibit the actin-myosin interaction and subsequently alter spine morphology (35). Still other proteins, such as cofilin, are responsible for proper spine head morphology, play an active role in actin dynamics (36), and result in pathologic changes in actin in response to soluble Aβ (37). Thus, one or more of these molecular mechanisms may be acting to alter spine morphology in a manner independent of f-actin loss.
Relative Contributions of Fibrillar and Non-Fibrillar Aβ Species to Spine Alterations Surrounding Fibrillar Aβ Plaques
Previous in vitro studies with synthetic Aβ have reported that fibrillar Aβ forms, such as those found in Aβ plaques, are neurotoxic (38, 39). Other studies have implicated soluble Aβ as the primary contributor to synaptotoxicity (40, 41). Because both forms can exist in equilibrium there is some controversy regarding which is primarily responsible for pathologic effects (26). We observed a halo of Aβ immunoreactivity in the immediate surround of the X-34 positive fibrillar Aβ plaque. We interpret this Aβ-immunoreactivity as an index enriched for the content of non-fibrillar soluble Aβ species in the plaque surround. This interpretation is based on several aspects of our approach and findings. Although the 3 antibodies used in the present study target different portions of the Aβ peptide (i.e. the N-terminus, mid portion, and C-terminus), they produced comparable patterns of Aβ immunoreactivity around the X-34 positive fibrillar Aβ plaque, which suggests that we are in fact labeling Aβ forms rather than full-length APP (which is not detected by anti-Aβx-40) or another related metabolic fragment. Second, there is clear evidence that at least antibodies 6E10 and 4G8 label non-fibrillar soluble species of Aβ (26, 27). Third, soluble Aβ binds locally to synaptic structures (12) and to various components of the extracellular matrix (42), either of which would facilitate in situ fixation, although some non-fibrillar soluble Aβ would likely be lost by diffusion. Fourth, in the absence of formic acid pre-treatment, we saw little evidence of colocalization of anti-Aβ labeling with X-34 staining, the latter of which is highly selective for fibrillar, β-pleated sheet conformations (25). While some anti-Aβ binding to fibrillar Aβ in plaques may still occur, our approach would have enriched the relative contribution of non-fibrillar Aβ species to the total measured Aβ-immunoreactivity. Fifth, we observed effects likely to reflect the toxicity of Aβ at distances up to 6 μm beyond the edge of the fibrillar Aβ plaque, consistent with diffusion of soluble species.
The interpretation that Aβ-immunoreactivity indexes non-fibrillar Aβ species is also consistent with the observed dissociation of Aβ-immunoreactivity and fibrillar Aβ plaque content with measures of spine morphology, in contrast to the finding that each is associated with spine loss. This dissociation suggests that fibrillar and non-fibrillar Aβ may lead to spine loss via distinct pathways. For example, dendrites passing through or in close proximity to fibrillar Aβ plaques demonstrate a number of abnormalities, including atrophy, tortuosity, varicosities, and local loss of spines in the affected segments (13, 10). Thus, fibrillar Aβ plaques may lead to spine loss via toxic effects on dendrites, perhaps via effects on tau, which accumulates in dendrites and can interfere with microtubule functions necessary for spine growth and maintenance (43, 44). In contrast, soluble Aβ species have been shown to bind directly to synaptic structures and may induce spine loss by altering post-synaptic signal transduction pathways (12,18).
Potential Limitations of this Study
Because fibrillar and non-fibrillar Aβ exist in equilibrium, there may be no in vivo (or in vitro) approach that can conclusively determine their independent effects when both are concurrently present. However, our data are consistent with a model in which Aβ fibrils in plaques are themselves toxic to spines, and serve as a reservoir for toxic soluble forms of non-fibrillar Aβ, with a concentration gradient that falls with distance from the plaque edge. Transgenic mouse models aspire to capture some or all aspects of often uniquely human diseases, such as AD. The PSAPP mouse model demonstrates robust amyloid plaque deposition, well-characterized synaptic loss, and cognitive deficits that correlate with presence of oligomeric Aβ species (45), making it an excellent model to examine effects resulting from Aβ accumulation, a process that appears to correspond to the earliest stages of AD (46). However, the PSAPP model lacks the neurofibrillary tangle formation and neuronal loss that are seen as AD progresses (45). This discrepancy between the PSAPP model and human neuropathology enhance confidence in the interpretation that our findings are secondary to Aβ, but render uncertain whether the associations identified in the current study are ultimately present in humans. This could be addressed by extending our multiple wavelength imaging and quantification approach to human postmortem tissue but this application is not straightforward due to tissue autofluorescence and high plaque densities in AD tissue.
Another potential limitation to this study derives from our approach to spine imaging. We utilized phalloidin labeling to estimate spine volume, surface area and shape. Electron microscopy studies have shown that actin is the major cytoskeleton component in spines and plays a pivotal role in spine size and shape (47). Thus, phalloidin labeling presents a good overall estimate of spine shape and size; however, dendritic spines also contain other components, such as postsynaptic machinery and membrane bound organelles, that contribute to their shape and volume to some degree (48). We imaged our sections via spinning disk confocal microscopy. This approach has several advantages relative to other fluorescent imaging methodologies for quantification in synaptic structures (49). Nevertheless, our approach shares with other confocal techniques limitations in the z-axis resolution. While this limitation is mitigated by the Gaussian filter transformation we applied during image processing, it may still have caused us to underestimate spine density by failing to discriminate spines closely apposed in the z-axis. Because we found reduced density of spines in the same region where spines were more compact, any such potential limitation would have biased against our detected effect rather than having contributed to it. Moreover, whereas alternate techniques such as array tomography may enhance z-axis resolution, they suffer from the same disadvantages for fluorescence intensity quantification (relative to spinning disk) as we have described for other laser scanning confocal techniques (49).
Finally, our working assumption was that amyloid plaques are embedded randomly throughout all parenchymal structures, and thus sampled a large number of plaques. However, reduced spine density could be due to cell bodies around plaques if plaques preferentially form in areas of high cell body density.
Implications for AD
Accepting the caveats associated with the PSAPP model discussed above, our findings have significance for therapeutic strategies in AD. We found that dendritic spine degeneration and loss in cerebral cortex were independently associated with both fibrillar Aβ plaque content and with an index of non-fibrillar, presumptively soluble, Aβ species. These findings argue strongly that therapeutic strategies should consider targeting both forms of Aβ concurrently. Additionally, the novel findings that spine morphology was altered in relation to an index of non-fibrillar Aβ content, but not associated with reduced relative f-actin content per spine, suggests an effect of non-fibrillar Aβ on pathways that signal to actin-regulating molecules outside canonical LTD pathways. The specific pathways remain to be elucidated and may represent novel targets for therapy of AD.
Supplementary Material
Acknowledgments
This work was supported by grants AG027224, AG14449, and AG044070 from the National Institutes of Health. The content is solely the responsibility of the authors and does not necessarily represent the official views of the National Institutes of Health, the Department of Veterans Affairs or the United States Government.
The research was in compliance with IACUC protocols. We wish to thank Ms. Lauren Perwas for her assistance with data processing.
Footnotes
Disclosures: There are no actual or potential conflicts of interest.
References
- 1.Selkoe DJ. Alzheimer disease: mechanistic understanding predicts novel therapies. Ann Intern Med. 2004;140:627–38. doi: 10.7326/0003-4819-140-8-200404200-00047. [DOI] [PubMed] [Google Scholar]
- 2.Ballatore C, Lee VM, Trojanowski JQ. Tau-mediated neurodegeneration in Alzheimer’s disease and related disorders. Nat Rev Neurosci. 2007;8:663–72. doi: 10.1038/nrn2194. [DOI] [PubMed] [Google Scholar]
- 3.Ingelsson M, Fukumoto H, Newell KL, et al. Early Abeta accumulation and progressive synaptic loss, gliosis, and tangle formation in AD brain. Neurology. 2004;62:925–31. doi: 10.1212/01.wnl.0000115115.98960.37. [DOI] [PubMed] [Google Scholar]
- 4.DeKosky ST, Scheff SW. Synapse loss in frontal cortex biopsies in Alzheimer’s disease: Correlation with cognitive severity. Ann Neurol. 1990;27:457–64. doi: 10.1002/ana.410270502. [DOI] [PubMed] [Google Scholar]
- 5.Scheff SW, Price DA, Schmitt FA, et al. Synaptic alterations in CA1 in mild Alzheimer disease and mild cognitive impairment. Neurology. 2007;68:1501–8. doi: 10.1212/01.wnl.0000260698.46517.8f. [DOI] [PubMed] [Google Scholar]
- 6.Walsh DM, Selkoe DJ. A beta oligomers - a decade of discovery. J Neurochem. 2007;101:1172–84. doi: 10.1111/j.1471-4159.2006.04426.x. [DOI] [PubMed] [Google Scholar]
- 7.Walsh DM, Klyubin I, Shankar GM, et al. The role of cell-derived oligomers of Abeta in Alzheimer’s disease and avenues for therapeutic intervention 1. Biochem Soc Trans. 2005;33:1087–90. doi: 10.1042/BST20051087. [DOI] [PubMed] [Google Scholar]
- 8.Hsieh H, Boehm J, Sato C, et al. AMPAR removal underlies Abeta-induced synaptic depression and dendritic spine loss. Neuron. 2006;52:831–43. doi: 10.1016/j.neuron.2006.10.035. [DOI] [PMC free article] [PubMed] [Google Scholar]
- 9.Shankar GM, Bloodgood BL, Townsend M, et al. Natural oligomers of the Alzheimer amyloid-beta protein induce reversible synapse loss by modulating an NMDA-type glutamate receptor-dependent signaling pathway. J Neurosci. 2007;27:2866–75. doi: 10.1523/JNEUROSCI.4970-06.2007. [DOI] [PMC free article] [PubMed] [Google Scholar]
- 10.Spires TL, Meyer-Luehmann M, Stern EA, et al. Dendritic spine abnormalities in amyloid precursor protein transgenic mice demonstrated by gene transfer and intravital multiphoton microscopy. J Neurosci. 2005;25:7278–87. doi: 10.1523/JNEUROSCI.1879-05.2005. [DOI] [PMC free article] [PubMed] [Google Scholar]
- 11.Tsai J, Grutzendler J, Duff K, et al. Fibrillar amyloid deposition leads to local synaptic abnormalities and breakage of neuronal branches. Nat Neurosci. 2004;7:1181–3. doi: 10.1038/nn1335. [DOI] [PubMed] [Google Scholar]
- 12.Koffie RM, Meyer-Luehmann M, Hashimoto T, et al. Oligomeric amyloid beta associates with postsynaptic densities and correlates with excitatory synapse loss near senile plaques. Proc Natl Acad Sci U S A. 2009;106:4012–7. doi: 10.1073/pnas.0811698106. [DOI] [PMC free article] [PubMed] [Google Scholar]
- 13.Grutzendler J, Helmin K, Tsai J, et al. Various dendritic abnormalities are associated with fibrillar amyloid deposits in Alzheimer’s disease. Ann N Y Acad Sci. 2007;1097:30–9. doi: 10.1196/annals.1379.003. [DOI] [PubMed] [Google Scholar]
- 14.Matsuzaki M, Honkura N, Ellis-Davies GC, et al. Structural basis of long-term potentiation in single dendritic spines. Nature. 2004;429:761–6. doi: 10.1038/nature02617. [DOI] [PMC free article] [PubMed] [Google Scholar]
- 15.Okamoto K, Nagai T, Miyawaki A, et al. Rapid and persistent modulation of actin dynamics regulates postsynaptic reorganization underlying bidirectional plasticity. Nat Neurosci. 2004;7:1104–12. doi: 10.1038/nn1311. [DOI] [PubMed] [Google Scholar]
- 16.Zhou Q, Homma KJ, Poo MM. Shrinkage of dendritic spines associated with long-term depression of hippocampal synapses. Neuron. 2004;44:749–57. doi: 10.1016/j.neuron.2004.11.011. [DOI] [PubMed] [Google Scholar]
- 17.Nagerl UV, Eberhorn N, Cambridge SB, et al. Bidirectional activity-dependent morphological plasticity in hippocampal neurons. Neuron. 2004;44:759–67. doi: 10.1016/j.neuron.2004.11.016. [DOI] [PubMed] [Google Scholar]
- 18.Shankar GM, Li S, Mehta TH, et al. Amyloid-beta protein dimers isolated directly from Alzheimer’s brains impair synaptic plasticity and memory. Nat Med. 2008;14:837–42. doi: 10.1038/nm1782. [DOI] [PMC free article] [PubMed] [Google Scholar]
- 19.Wang HW, Pasternak JF, Kuo H, et al. Soluble oligomers of beta amyloid (1–42) inhibit long-term potentiation but not long-term depression in rat dentate gyrus. Brain Res. 2002;924:133–40. doi: 10.1016/s0006-8993(01)03058-x. [DOI] [PubMed] [Google Scholar]
- 20.Hsiao K, Chapman P, Nilsen S, et al. Correlative memory deficits, Abeta elevation, and amyloid plaques in transgenic mice. Science. 1996;274:99–102. doi: 10.1126/science.274.5284.99. [DOI] [PubMed] [Google Scholar]
- 21.Duff K, Eckman C, Zehr C, et al. Increased amyloid-beta42(43) in brains of mice expressing mutant presenilin 1. Nature. 1996;383:710–3. doi: 10.1038/383710a0. [DOI] [PubMed] [Google Scholar]
- 22.Holcomb L, Gordon MN, McGowan E, et al. Accelerated Alzheimer-type phenotype in transgenic mice carrying both mutant amyloid precursor protein and presenilin 1 transgenes. Nat Med. 1998;4:97–100. doi: 10.1038/nm0198-097. [DOI] [PubMed] [Google Scholar]
- 23.Watson RE, Jr, Wiegand SJ, Clough RW, et al. Use of cryoprotectant to maintain long-term peptide immunoreactivity and tissue morphology. Peptides. 1986;7:155–9. doi: 10.1016/0196-9781(86)90076-8. [DOI] [PubMed] [Google Scholar]
- 24.Paxinos G, Franklin K. The Mouse Brain in Stereotaxic Coordinates: Compact Second Edition. 2004. pp. 1–120. Compact Second Edition. [Google Scholar]
- 25.Ikonomovic MD, Abrahamson EE, Isanski BA, et al. X-34 labeling of abnormal protein aggregates during the progression of Alzheimer’s disease. Methods Enzymol. 2006;9:123–44. doi: 10.1016/S0076-6879(06)12009-1. [DOI] [PubMed] [Google Scholar]
- 26.Zempel H, Thies E, Mandelkow E, et al. Abeta oligomers cause localized Ca(2+) elevation, missorting of endogenous Tau into dendrites, Tau phosphorylation, and destruction of microtubules and spines. J Neurosci. 2010;30:11938–50. doi: 10.1523/JNEUROSCI.2357-10.2010. [DOI] [PMC free article] [PubMed] [Google Scholar]
- 27.Kayed R, Canto I, Breydo L, et al. Conformation dependent monoclonal antibodies distinguish different replicating strains or conformers of prefibrillar Abeta oligomers. Mol Neurodegener. 2010;5:57. doi: 10.1186/1750-1326-5-57. [DOI] [PMC free article] [PubMed] [Google Scholar]
- 28.Kamal A, Almenar-Queralt A, LeBlanc JF, et al. Kinesin-mediated axonal transport of a membrane compartment containing beta-secretase and presenilin-1 requires APP. Nature. 2001;414:643–8. doi: 10.1038/414643a. [DOI] [PubMed] [Google Scholar]
- 29.Capani F, Deerinck TJ, Ellisman MH, et al. Phalloidin-eosin followed by photo-oxidation: a novel method for localizing F-actin at the light and electron microscopic levels. J Histochem Cytochem. 2001;49:1351–61. doi: 10.1177/002215540104901103. [DOI] [PubMed] [Google Scholar]
- 30.Fish KN, Sweet RA, Deo AJ, et al. An automated segmentation methodology for quantifying immunoreactive puncta number and fluorescence intensity in tissue sections. Brain Res. 2008;1240:62–72. doi: 10.1016/j.brainres.2008.08.060. [DOI] [PMC free article] [PubMed] [Google Scholar]
- 31.Sugiyama Y, Kawabata I, Sobue K, et al. Determination of absolute protein numbers in single synapses by a GFP-based calibration technique. Nat Methods. 2005;2:677–84. doi: 10.1038/nmeth783. [DOI] [PubMed] [Google Scholar]
- 32.Luther E, Kamentsky L, Henriksen M, et al. Next-generation laser scanning cytometry. Methods Cell Biol. 2004;75:185–218. doi: 10.1016/s0091-679x(04)75008-6. [DOI] [PubMed] [Google Scholar]
- 33.Wilson LM, Mok YF, Binger KJ, et al. A structural core within apolipoprotein C-II amyloid fibrils identified using hydrogen exchange and proteolysis. J Mol Biol. 2007;366:1639–51. doi: 10.1016/j.jmb.2006.12.040. [DOI] [PubMed] [Google Scholar]
- 34.Korobova F, Svitkina T. Molecular architecture of synaptic actin cytoskeleton in hippocampal neurons reveals a mechanism of dendritic spine morphogenesis. Mol Biol Cell. 2010;21:165–76. doi: 10.1091/mbc.E09-07-0596. [DOI] [PMC free article] [PubMed] [Google Scholar]
- 35.Hayashi K, Ishikawa R, Ye LH, et al. Modulatory role of drebrin on the cytoskeleton within dendritic spines in the rat cerebral cortex. J Neurosci. 1996;16:7161–70. doi: 10.1523/JNEUROSCI.16-22-07161.1996. [DOI] [PMC free article] [PubMed] [Google Scholar]
- 36.Bamburg JR, Bloom GS. Cytoskeletal pathologies of Alzheimer disease. Cell Motil Cytoskeleton. 2009;66:635–49. doi: 10.1002/cm.20388. [DOI] [PMC free article] [PubMed] [Google Scholar]
- 37.Davis RC, Marsden IT, Maloney MT, et al. Amyloid beta dimers/trimers potently induce cofilin-actin rods that are inhibited by maintaining cofilin-phosphorylation. Mol Neurodegen. 2011;6:10. doi: 10.1186/1750-1326-6-10. [DOI] [PMC free article] [PubMed] [Google Scholar]
- 38.Lorenzo A, Yankner BA. Beta-amyloid neurotoxicity requires fibril formation and is inhibited by congo red. Proc Natl Acad Sci U S A. 1994;91:12243–7. doi: 10.1073/pnas.91.25.12243. [DOI] [PMC free article] [PubMed] [Google Scholar]
- 39.Iversen LL, Mortishire-Smith RJ, et al. The toxicity in vitro of beta-amyloid protein. Biochem J. 1995;311:1–16. doi: 10.1042/bj3110001. [DOI] [PMC free article] [PubMed] [Google Scholar]
- 40.Walsh DM, Klyubin I, Fadeeva JV, et al. Amyloid-beta oligomers: their production, toxicity and therapeutic inhibition. Biochem Soc Trans. 2002;30:552–7. doi: 10.1042/bst0300552. [DOI] [PubMed] [Google Scholar]
- 41.Lue LF, Kuo YM, Roher AE, et al. Soluble amyloid beta peptide concentration as a predictor of synaptic change in Alzheimer’s disease. Am J Pathol. 1999;155:853–62. doi: 10.1016/s0002-9440(10)65184-x. [DOI] [PMC free article] [PubMed] [Google Scholar]
- 42.Valle-Delgado JJ, Alfonso-Prieto M, de Groot NS, et al. Modulation of Abeta42 fibrillogenesis by glycosaminoglycan structure. FASEB J. 2010;24:4250–61. doi: 10.1096/fj.09-153551. [DOI] [PubMed] [Google Scholar]
- 43.Ittner LM, Gotz J. Amyloid-beta and tau--a toxic pas de deux in Alzheimer’s disease. Nat Rev Neurosci. 2011;12:65–72. doi: 10.1038/nrn2967. [DOI] [PubMed] [Google Scholar]
- 44.Gu J, Zheng JQ. Microtubules in dendritic spine development and plasticity. Open Neurosci J. 2009;3:128–33. doi: 10.2174/1874082000903020128. [DOI] [PMC free article] [PubMed] [Google Scholar]
- 45.Urbanc B, Cruz L, Le R, et al. Neurotoxic effects of thioflavin S-positive amyloid deposits in transgenic mice and Alzheimer’s disease. Proc Natl Acad Sci U S A. 2002;99:13990–5. doi: 10.1073/pnas.222433299. [DOI] [PMC free article] [PubMed] [Google Scholar]
- 46.Jack CR, Jr, Vemuri P, Wiste HJ, et al. Evidence for ordering of Alzheimer disease biomarkers. Arch Neurol. 2011;68:1526–35. doi: 10.1001/archneurol.2011.183. [DOI] [PMC free article] [PubMed] [Google Scholar]
- 47.Landis DM, Reese TS. Cytoplasmic organization in cerebellar dendritic spines. J Cell Biol. 1983;97:1169–78. doi: 10.1083/jcb.97.4.1169. [DOI] [PMC free article] [PubMed] [Google Scholar]
- 48.Sheng M, Hoogenraad CC. The postsynaptic architecture of excitatory synapses: a more quantitative view. Annu Rev Biochem. 2007;76:823–47. doi: 10.1146/annurev.biochem.76.060805.160029. [DOI] [PubMed] [Google Scholar]
- 49.Sweet RA, Fish KN, Lewis DA. Mapping synaptic pathology within cerebral cortical circuits in subjects with schizophrenia. Front Hum Neurosci. 2010;4:44–75. doi: 10.3389/fnhum.2010.00044. [DOI] [PMC free article] [PubMed] [Google Scholar]
Associated Data
This section collects any data citations, data availability statements, or supplementary materials included in this article.