Abstract
Binding free energy calculations offer a thermodynamically rigorous method to compute protein-ligand binding, and they depend on empirical force fields with hundreds of parameters. We examined the sensitivity of computed binding free energies to the ligand’s electrostatic and van der Waals parameters. Dielectric screening and cancellation of effects between ligand-protein and ligand-solvent interactions reduce the parameter sensitivity of binding affinity by 65%, compared with interaction strengths computed in the gas-phase. However, multiple changes to parameters combine additively on average, which can lead to large changes in overall affinity from many small changes to parameters. Using these results, we estimate that random, uncorrelated errors in force field nonbonded parameters must be smaller than 0.02 e per charge, 0.06 Å per radius, and 0.01 kcal/mol per well depth in order to obtain 68% (one standard deviation) confidence that a computed affinity for a moderately-sized lead compound will fall within 1 kcal/mol of the true affinity, if these are the only sources of error considered.
Keywords: free energy calculations, ligand binding, molecular dynamics, force fields, parameter sensitivity
1. Introduction
In recent years free energy calculations have been used to examine protein-ligand binding in many different proteins, from blind tests of affinity prediction in model binding sites1,2 to detailed examinations of binding in more complicated biological receptors3,4. Unlike simplified docking methods used in virtual screening, free energy calculations use simulations to compute a rigorous statistical-mechanical binding free energy within the context of a given force field5. It seems likely that these force fields must be highly accurate in order to predict accurate binding affinities, and force field inaccuracy may help explain why binding affinities have historically proven very difficult to predict6,7,8,9. Still, the actual sensitivity of simulated binding free energies to the underlying force field parameters has rarely been examined quantitatively, perhaps due to the computational expense of the calculations10,11.
The sensitivity of simulated binding free energies to force field parameters is of particular interest for several reasons. Firstly, by examining how sensitive binding affinities are to parameters, we learn how accurate force field parameters need to be for free energy calculations to produce accurate binding affinities. Secondly, this parameter sensitivity is useful for improving more simplified models of binding. Free energy calculations compute binding affinities using a fundamentally different approach from docking and scoring calculations. Phenomena such as dielectric screening and the hydrophobic effect arise naturally from the simulation, instead of being directly parameterized by surface tension or effective dielectric constant parameters12. One strategy for improving docking calculations could therefore be to ensure the overall sensitivity to force field parameters mimics the more physically grounded sensitivity from free energy calculations, because these sensitivities cannot be directly compared with experiment. Thirdly, it has been pointed out that many force fields commonly used in condensed-phase simulations have significantly different interaction strengths between fragments than the interaction strengths from high level gas-phase ab initio calculations on the same fragments, potentially introducing large errors in predicted affinities13. It is important to determine whether or not these differences necessarily limit the ability of simplified force fields to predict overall binding affinities. Lastly, several physical mechanisms, described in more detail below, may make binding free energies moderately robust to the strengths of individual interactions. Examining the parameter sensitivity of binding free energy calculations can provide quantitative insight into these mechanisms and their effects on binding.
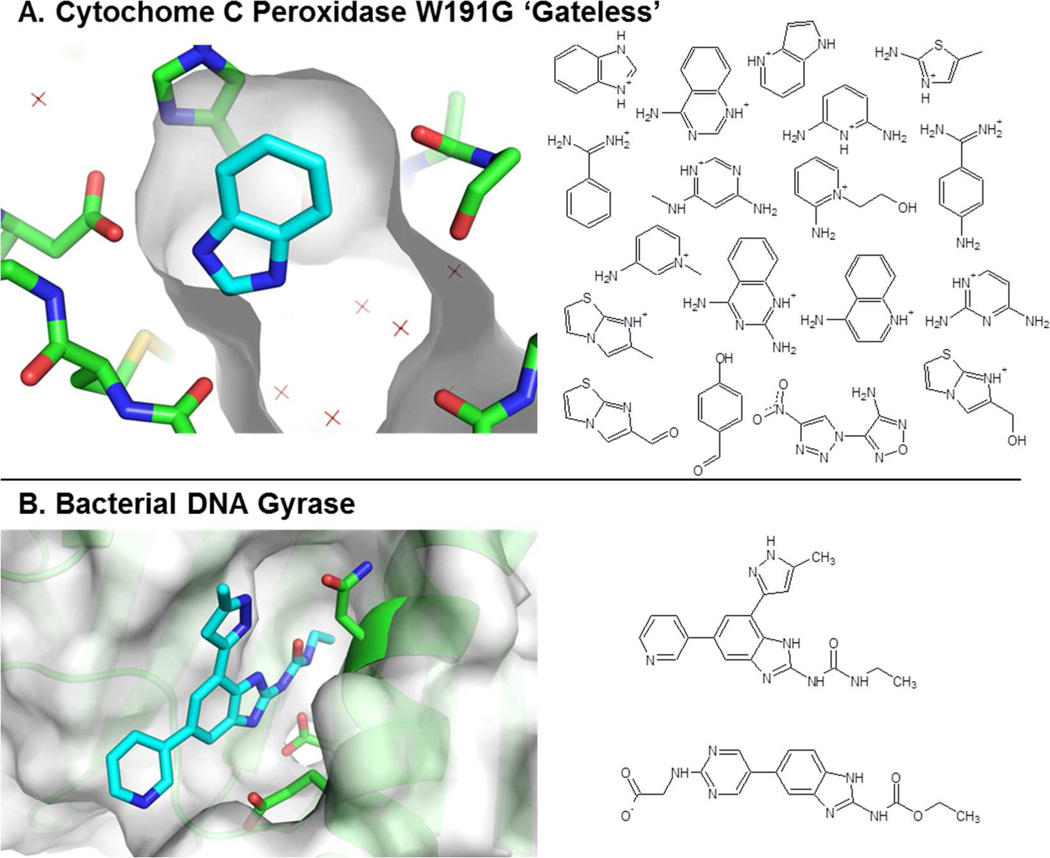
Here, we examine the sensitivity of simulated protein-ligand binding free energies to the nonbonded force field parameters of the ligands. For our main analysis, we studied a set of fragments binding to a highly enclosed, engineered binding site in yeast Cytochrome C Peroxidase (CCP)14, which we have previously studied with free energy calculations15 (Figure 1a). To test the generality of our conclusions, we also examined two ligands binding to the more realistic, pharmaceutically relevant binding site in bacterial DNA Gyrase (Figure 1b)16. For each ligand, we exhaustively made small perturbations to all ligand charge and van der Waals (vdw) parameters, and determined the change in the overall binding free energy for each perturbation.
Figure 1. Binding sites and compounds studied.
(A) Cytochrome C Peroxidase W191G ‘Gateless’ binding site bound to benzimidazole, from PDB 1KXM. Benzimidazole has an axis of symmetry: one symmetric amine hydrogen bonds with a protein Aspartate (left), while the other points at solvent (right). (B) Bacterial DNA Gyrase bound to an inhibitor shown at left. Binding site images generated using PyMOL 1.4.1, Schrödinger, LLC.
After determining the overall sensitivity of binding free energies to parameters, we then investigated three mechanisms, described below, which we hypothesized could lead to robust binding affinities: dielectric screening, cancellation of effects in solution and in the protein, and nonadditivity. We quantitatively measure these effects and describe their individual impacts on the robustness of binding free energies.
Dielectric screening
Electrostatic interactions in water are eighty fold weaker than in the gas phase, and interactions in proteins may be 2–40 fold weaker due to the effect of dielectric relaxation of the environment12 . This reduces the sensitivity of binding affinities to electrostatics.
Cancellation of effects in solution and in the protein
Binding free energy is the free energy difference between the protein-ligand complex (ΔGComplex) and the protein and ligand free in solution (ΔGWat). Most changes to ligand properties affect both of these free energies in the same direction, which buffers the overall size of the effect.
Non-additivity
If x is the effect on binding free energy of changing one interaction, y the effect of changing a second, and z the effect of changing both at once, then if z = x + y we say the effects are independent, and the total effect of n random independent changes should grow with . If | z | > | x + y |, the effects are cooperative, and if this is true on average for many perturbations, the total effect of n random changes may grow faster than . If instead | z | < | x + y |, the effects are buffering, and if this is true on average for many perturbations, the total effect of n random changes may grow more slowly than . If perturbations to interaction strengths most often buffer one another, then overall protein-ligand binding affinities will be more robust to interaction strengths17
2. Results
2.1 Exhaustive perturbation of ligand parameters
We simulated 18 fragment-sized compounds in vacuum, in TIP3P water, and in complex with yeast Cytochrome C Peroxidase (CCP) W191G ‘Gateless’14, for which they have experimental affinities between −3 and −7.1 kcal/mol (Figure 1a)15. Fifteen compounds were charged, three were neutral, and three do not actually bind to the protein at measurable concentrations, but do at least sterically fit into the binding site and were included to add compound diversity. Several compounds were considered in multiple orientations in the binding site, but each orientation was treated separately; in other words, we recorded the effects of all changes to ligand parameters on all orientations, rather that considering how changes to ligand parameters would shift the populations of different ligand orientations. We also simulated two lead-sized compounds in vacuum, in solvent, and bound to bacterial DNA Gyrase16, to which they have experimental affinities of −6.7 and −8.3 kcal/mol (Figure 1b). One Gyrase compound was neutral and one was charged.
With these simulations, we used the Zwanzig equation (1):
| (1) |
to determine the free energy change ΔG (Ref ➔ New) for a given state caused by the change in parameters, where 〈…〉Ref represents an ensemble average of snapshots from that state simulated using the reference parameters, E is the potential energy of a snapshot, kB is Boltzmann’s constant and T the absolute temperature. By calculating ΔG (Ref ➔ New) for (a) the free ligand in vacuum, (b) the free ligand in solution, and (c) the ligand in complex with the protein, we were able to determine ΔΔGWat, the change in the vacuum ➔ water transfer free energy caused by the change in parameters, and ΔΔGComplex, the change in the vacuum ➔ solvated protein transfer free energy caused by the change in parameters.
| (2) |
| (3) |
Finally, from ΔΔGWat and ΔΔGComplex, we determined ΔΔGBind, the change in the binding affinity caused by the change in parameters, using equation 4:
| (4) |
We examined the sensitivity to charge parameters by taking each bond on each ligand and redistributing 0.1e of charge from one bonded atom to the other in each direction, for a total of two perturbations per bond. Each charge perturbation only alters the local dipole of a single bond; less localized perturbations or perturbations to the overall net charge of the ligands are not considered. For van der Waals parameters, we added and subtracted 0.3 Å from the Lennard-Jones radius σ for each atom, and added and subtracted 0.04 kcal/mol from the well depth ε, for a total of four perturbations per atom. We excluded van der Waals perturbations which lowered σ or ε to zero. The perturbations are similar in size to the average root-mean-squared deviation (RMSD) in amino acid parameters between commonly used protein force fields (Table 1): the average RMSD for charge parameters is 0.09e, for sigma parameters is 0.34 Å, and for epsilon parameters is 0.036 kcal/mol. The starting (reference) ligand parameters came from the General AMBER force field (GAFF)18,19 using the AM1-BCC charge model20,21.
Table 1. Root-mean-squared deviation in amino acid force field parameters between commonly used protein force fields.
Parameters were counted considering every atom in the 20 genetically encoded amino acids separately, i.e. backbone atoms are counted 20 times each even if atom types are identical between amino acids. N- and C-terminal atoms are counted a total of once each. All four force fields use a geometric combination rule for ε. AMBER and CHARMM use an arithmetic combination rule for σ while OPLS uses a geometric rule.
| Charge (e) | AMBER9922 | AMBER0323 | CHARMM2724 | OPLSAA-200125 |
|---|---|---|---|---|
| AMBER99 | 0.000 | 0.068 | 0.109 | 0.103 |
| AMBER03 | 0.000 | 0.108 | 0.102 | |
| CHARMM27 | 0.000 | 0.059 | ||
| OPLSAA-2001 | 0.000 | |||
| Sigma (Å) | AMBER99/03 | CHARMM27 | OPLSAA-2001 | |
| AMBER99/03 | 0.000 | 0.360 | 0.389 | |
| CHARMM27 | 0.000 | 0.272 | ||
| OPLSAA-2001 | 0.000 | |||
| Epsilon (kcal/mol) | AMBER99/03 | CHARMM27 | OPLSAA-2001 | |
| AMBER99/03 | 0.000 | 0.046 | 0.025 | |
| CHARMM27 | 0.000 | 0.036 | ||
| OPLSAA-2001 | 0.000 | |||
Because we compute ΔΔGBind using simulations that only directly sampled the reference state, we may incorrectly calculate ΔΔGBind for rare cases where the important phase space in the new state significantly differs from the reference state. However, because these parameter perturbations are so miniscule and have such small effects on ΔΔGBind, ΔΔGComplex, and ΔΔGWat, this error should have only a minor effect on the main conclusions.
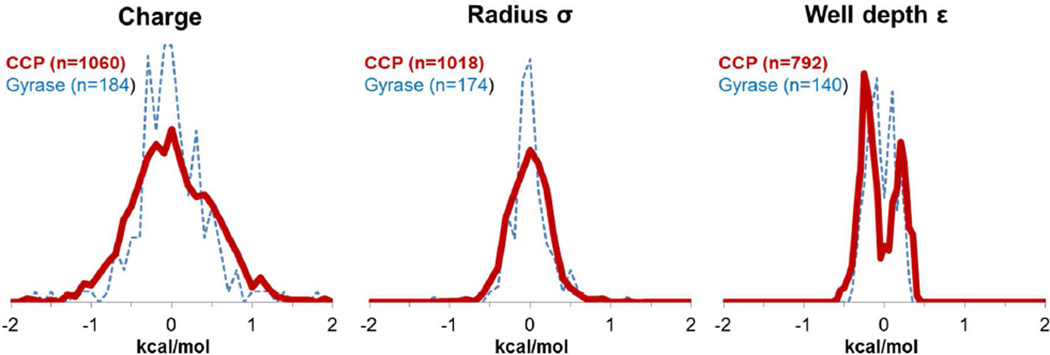
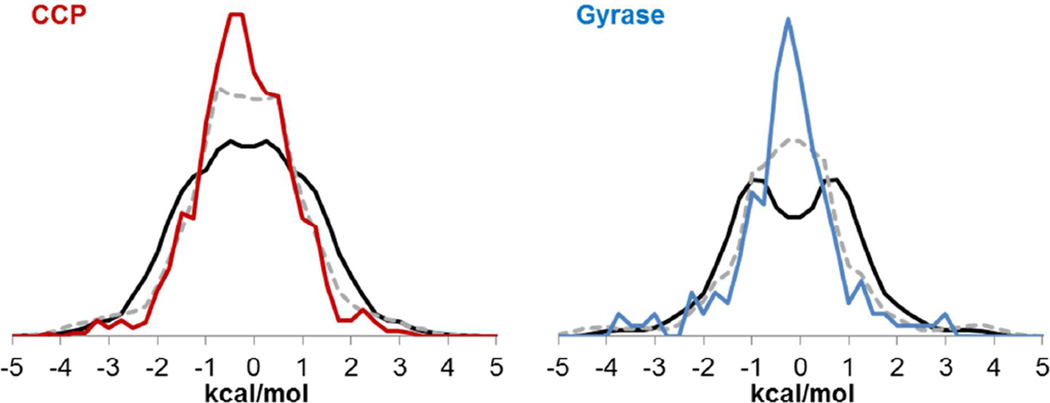
The ΔΔGBind values for all perturbations are shown in histogram form in Figure 2. In our analysis, we consider only the perturbations in CCP, although the Gyrase histograms show that the results are similar for the case of a more realistic binding site. The histograms are centered near zero because all perturbations are done in both directions (one direction likely increasing ΔΔGBind and the other likely decreasing it). For these compounds, changes to parameters weaken binding slightly on average: the 〈ΔΔGBind〉 values for charge, σ, and ε perturbations are 0.058 ± 0.016 kcal/mol, 0.040 ± 0.008 kcal/mol, and 0.030 ± 0.006 kcal/mol (uncertainties are the standard error of the mean, or SEM, and angled brackets are now used to indicate an average over all parameter perturbations). Though random charge perturbations weaken binding on average, they strengthen protein-ligand interactions (〈ΔΔGComplex〉= −0.072 ± 0.031 kcal/mol) and ligand-solvent interactions (〈ΔΔGWat〉 = −0.130 ± 0.022 kcal/mol). (ΔΔGComplex and ΔΔGWat do not include changes in internal energies of the compounds, because these effectively cancel between the vacuum and protein- or solvent-interacting states.) We interpret the difference to indicate the greater ability of the solvent to react to an arbitrary introduction of charge separation on the ligand. To simplify the analysis, we do not further consider this small average effect, and instead use the average absolute value of ΔΔGBind, indicated as〈|ΔΔGBind|〉, to measure the overall sensitivity of ΔGBind to ligand parameters. For CCP compounds, the 〈|ΔΔGBind|〉 values for charge, σ, and ε perturbations are 0.41 ± 0.01 kcal/mol, 0.20 ± 0.01, and 0.21 ± 0.01 kcal/mol for van der Waals perturbations (Figure 2).
Figure 2. Distribution of ΔΔGBind values for charge and van der Waals parameter perturbations in CCP (red) and Gyrase (blue).
Charge and σ histograms binned at 0.1 kcal/mol; ε histograms binned at 0.05 kcal/mol. For each parameter type (charge, σ, and ε), CCP and Gyrase results are normalized to each other to show relative frequencies. Charge, σ, and ε histograms are not normalized to each other.
2.2 For small perturbations, ΔΔGBind is proportional to perturbation size
The magnitude of 〈|ΔΔGBind|〉 depends on the size of the perturbations chosen. To examine how 〈|ΔΔGBind|〉 scales with the size of the individual perturbations, we also calculated ΔΔGBind values for perturbations which were 25%, 50%, and 75% as large as those used for the main analysis. Table 2 shows that 〈|ΔΔGBind|〉 grows linearly with the size of the perturbations for charge, σ, and ε perturbations. Because we compute free energies by reanalyzing trajectories simulated in the reference state, we are limited in the size of perturbations we can examine, and did not examine perturbations larger than 0.1 e, 0.3 Å, and 0.04 kcal/mol.
Table 2. The sensitivity of binding affinity to parameters is proportional to the size of the change in parameters.
We calculated the relative change in 〈|ΔΔGBind|〉 for full parameters perturbations (bottom row, ×4) compared with smaller perturbations. Values are normalized to the smallest perturbation size (0.025 e, 0.075 Å, and 0.01 kcal/mol). Uncertainties were calculated by bootstrapping (recalculating the fold-change in ΔΔGBind for 50,000 resamplings of the original data).
| Pert. Size | Charge (n=1060) | σ (n=1018) | ε (n=792) |
|---|---|---|---|
| ×1 | 1 | 1 | 1 |
| ×2 | 2.005 ± 0.068 | 1.970 ± 0.079 | 1.988 ± 0.049 |
| ×3 | 3.015 ± 0.103 | 2.940 ± 0.116 | 2.968 ± 0.073 |
| ×4 | 4.042 ± 0.137 | 3.949 ± 0.156 | 3.946 ± 0.097 |
2.3 Charge perturbations depend on bond type; van der Waals perturbations depend on parameter type
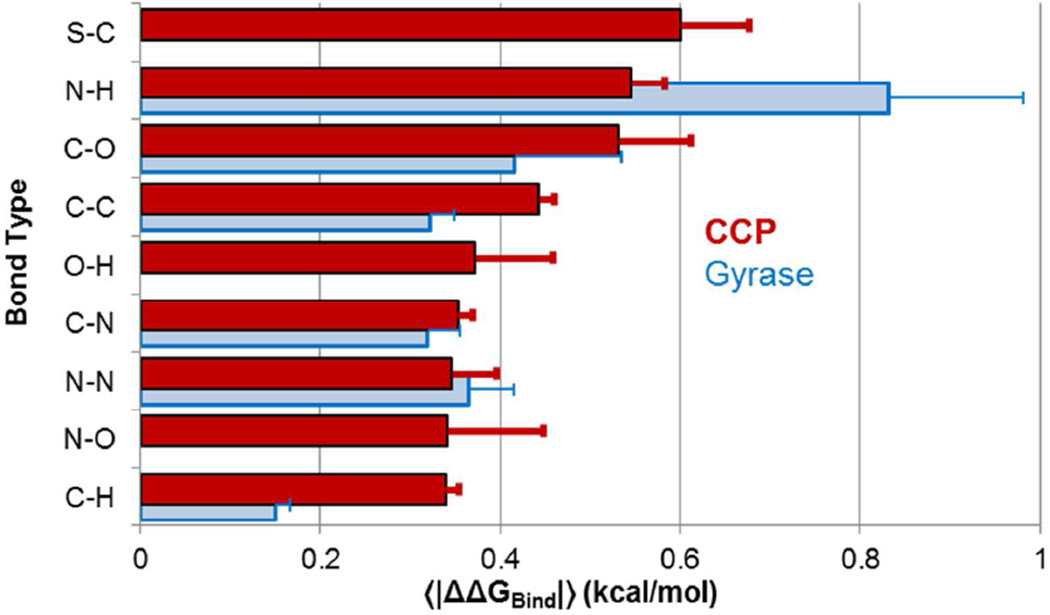
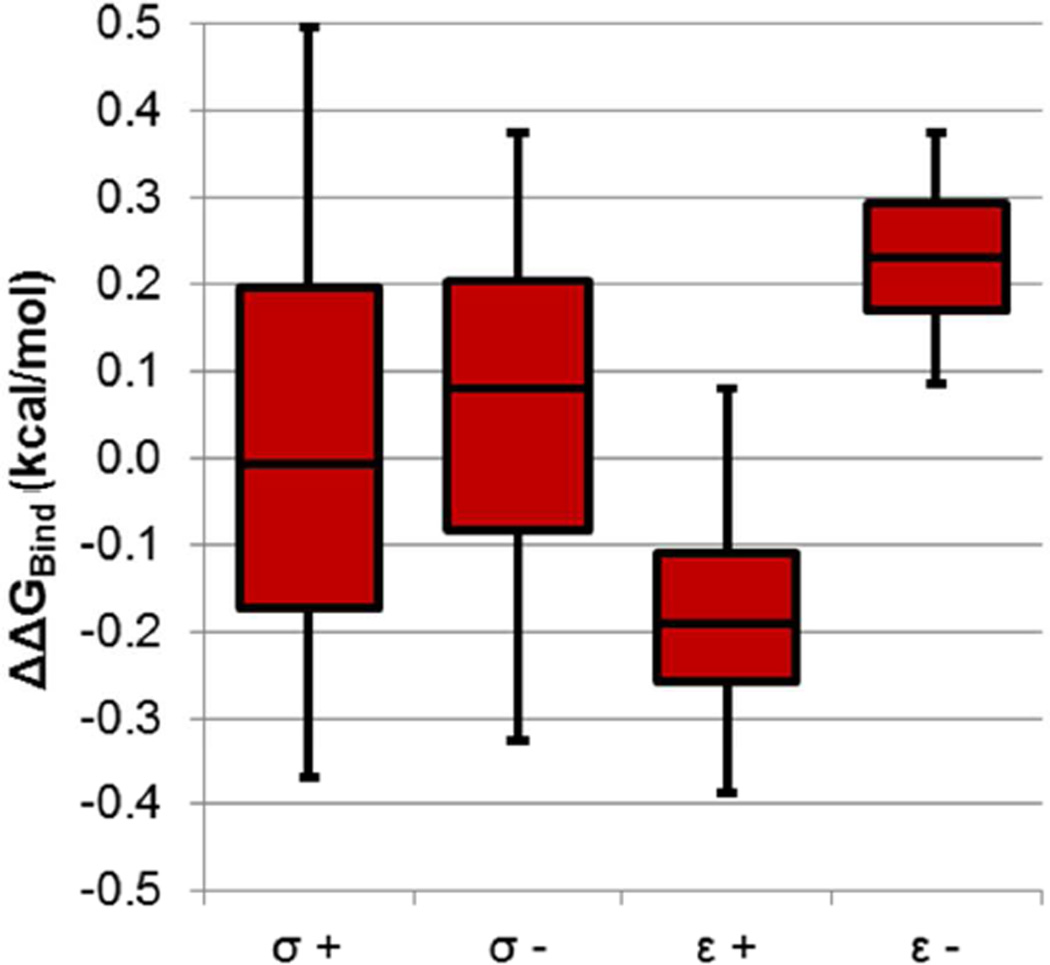
To more closely examine which charge and van der Waals parameters most affected ΔGBind, we separated our analysis based on which atoms were being perturbed and which perturbation was applied. For charge perturbations, we calculated individual 〈|ΔΔGBind|〉 values for each set of bonded elements (Figure 3). Both the CCP and Gyrase results show a similar trend, with polar S-C, N-H, and C-O bonds as most sensitive to charge parameters and C-H bonds as least sensitive. The errors bars for individual bond types do not overlap between CCP and Gyrase because of important differences between the binding sites: a greater fraction of N-H bonds in the Gyrase ligands point at ionized residues than in CCP, and a smaller fraction of C-H bonds in the Gyrase ligand are in polar binding site regions than in CCP. When changing van der Waals parameters, changing sigma may increase or decrease binding, while increasing epsilon almost always strengthens binding and decreasing epsilon almost always weakens binding (Figure 4).
Figure 3. Different bonds are differently sensitive to charge parameters.
We calculated 〈|ΔΔGBind|〉for charge perturbations along each type of bond; uncertainties show the standard error of the mean for 〈|ΔΔGBind|〉. Red: CCP results; blue: Gyrase results.
Figure 4. Different types of van der Waals perturbations have different effects on binding.
We separated the van der Waals perturbations into increasing and decreasing sigma and epsilon, and show in box plot form the 5th, 25th, 50th, 75th, and 95th %ile values of ΔΔGBind.
2.4 Different ligands are similarly sensitive to parameters
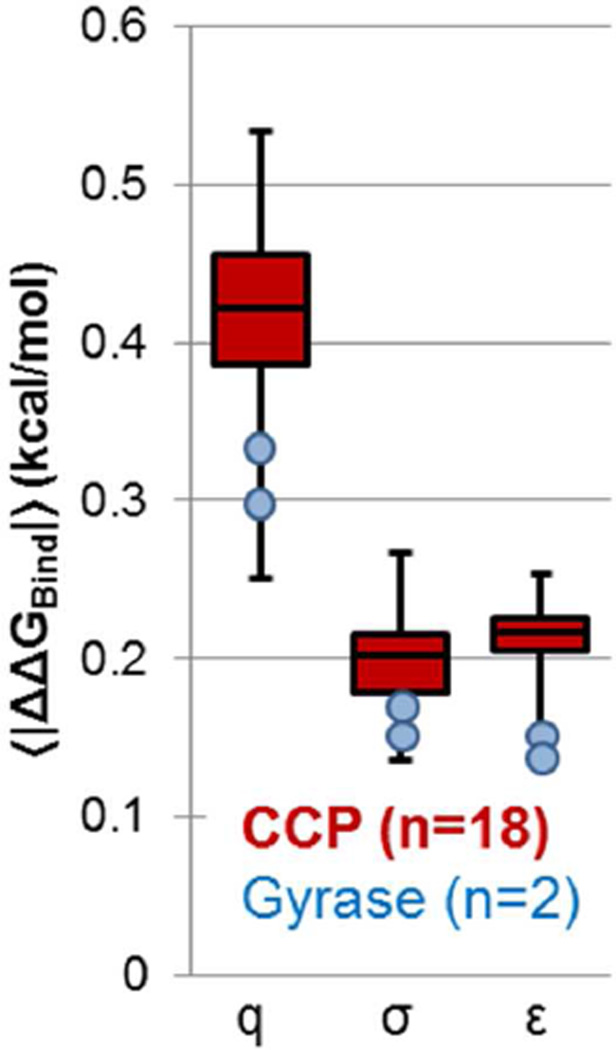
To examine whether 〈|ΔΔGBind|〉 significantly varied from ligand to ligand, we calculated individual 〈|ΔΔGBind|〉 values for each ligand, and show the results in Figure 5. The distributions are relatively narrow compared to the values of 〈|ΔΔGBind|〉, and the sensitivities of the Gyrase ligands fall within the distributions established by the CCP compounds. There is no clear difference in sensitivity to charge parameters between the three neutral CCP compounds and the remaining charged CCP compounds: the neutral compounds have 〈|ΔΔGBind|〉 values of 0.41 kcal/mol, 0.45 kcal/mol, and 0.51 kcal/mol, essentially in the middle of the distribution in Fig. 5.
Figure 5. Different ligands show similar sensitivity to charge and van der Waals parameters.
We calculated individual values of 〈|ΔΔGBind|〉for each ligand, and show here the minimum, first quartile, median, third quartile, and maximum 〈|ΔΔGBind|〉 values for the 18 CCP compounds in box plot form (red). Charge (q), radius (σ) and well depth (ε) perturbations are shown separately. 〈|ΔΔGBind|〉 values for the two Gyrase compounds are shown as blue circles.
2.5 Dielectric screening partially buffers affinities
Gas-phase interaction energies are often used as a reference state to consider the accuracy of force field parameters13,26. However, binding affinities calculated in solution should be more robust to force field parameters, because the strength of electrostatic interactions is weakened by dielectric relaxation12,27. For the ligand interacting with the protein, there are three sources of dielectric relaxation: electronic polarization, solvent reorganization, and protein reorganization, which we consider to include movement of the protein and ligand relative to each other. Our free energy calculations lack electronic polarization, but we can quantify the magnitudes of the other two effects by comparing free energy calculations to Poisson-Boltzmann (PB) calculations with defined amounts of dielectric relaxation28,29,30.
We compared ΔΔGComplex values for charge perturbations between the free energy calculations (dielectric relaxation from both protein and solvent) and two other systems: first, a single snapshot of the protein-ligand complex in vacuum (no dielectric relaxation at all), and second, a PB calculation using a single snapshot of the protein-ligand complex with εext = 97 and εint = 1 (solvent dielectric relaxation equal to the dielectric of TIP3P water31, but no protein dielectric relaxation at all) (Figure 6, Table 3). Each PB ΔΔGComplex value is calculated based on a single snapshot, though to ensure that the results are not overly dependent on the snapshot chosen, we calculated 50 separate PB ΔΔGComplex values using 50 different structural snapshots from the original 1 ns simulations of each ligand pose. By calculating each PB ΔΔGComplex value from a single snapshot, we ensure the only dielectric relaxation in the ΔΔGComplex calculation is the applied continuum solvent dielectric of εext = 97. (If all snapshots were used to calculate a single overall PB ΔΔGComplex value with the Zwanzig equation (1), the protein reorganization between the original and new parameters would introduce additional screening.) These ΔΔGComplex values, both from free energy calculations and PB calculations, exclude the change in the ligand’s internal energy due to perturbed parameters – only the change in protein-ligand interaction is considered.
Figure 6. Dielectric screening reduces the magnitude of 〈|ΔΔGComplex|〉 for charge perturbations.
Red (left, CCP) and blue (right, Gyrase): distribution of 1060 (CCP) or 184 (Gyrase) ΔΔGComplex values for charge perturbations from free energy calculations. Black: distribution of ΔΔGComplex values for charge perturbations calculated using a single snapshot of the protein-ligand complex in vacuum, and including 50 snapshots per perturbation (CCP) or 200 snapshots per perturbation (Gyrase). Grey dashes: distribution of ΔΔGComplex values for charge perturbations calculated using a Poisson-Boltzmann calculation on a single snapshot of the protein-ligand complex with εint=1, εext=97, using the number of snapshots as above. All distributions are shown as normalized histograms binned at 0.25 kcal/mol.
Table 3.
Summary of comparisons between free energy and Poisson-Boltzmann ΔΔGComplex values.
| CCP | Gyrase | |
|---|---|---|
| n Perturbations | 1060 | 184 |
| 〈|ΔΔG Complex|〉 (kcal/mol) | ||
| Vacuum (single structure) | 1.08 ± 0.01 | 1.05 ± 0.05 |
| PB εint=1, εext =97 (single structure) | 0.95 ± 0.01 | 0.95 ± 0.01 |
| Free Energy | 0.77 ± 0.02 | 0.75 ± 0.01 |
| Poisson-Boltzmann single fit εint for all perturbations | ||
| Optimal εint | 2.58 ± 0.01 | 2.92 ± 0.61 |
| RMSE vs Free Energy (kcal/mol) | 0.50 | 0.52 |
| R2 | 0.75 | 0.77 |
Figure 6 shows that the distribution of ΔΔGComplex values narrows in CCP and Gyrase when solvent dielectric relaxation is added (black to dashed grey lines), and narrows further when protein dielectric relaxation is added by computing ΔΔGComplex using free energy calculations (dashed grey to colored lines). This is reflected in the values of 〈|ΔΔGComplex|〉 shown in Table 3. In CCP and Gyrase, relaxation of the protein and solvent buffers 30% of the effect of parameter changes on ΔΔGComplex.
2.6 Dielectric screening in free energy calculations is protein- and environment-dependent
How much protein dielectric relaxation is observed in the free energy calculations? Poisson-Boltzmann calculations commonly model the protein as a uniform homogenous dielectric, which, while a significant oversimplification, provides an easily understood means to quantify relaxation. Using PB calculations on a single structure of each protein-ligand complex, we calculated ΔΔGComplex values for all charge perturbations with εext = 97 (representing TIP3P water) and εint varying between 1 and 80. We then interpolated each ΔΔGComplex value as a function of εint using a cubic spline, and determined an optimal value of εint for each protein to reproduce the ΔΔGComplex values from the free energy calculations (Table 3). The CCP and Gyrase ΔΔGComplex values were best reproduced with a homogenous εint of 2.58 ± 0.01 and 3.03 ± 0.01 respectively (Table 3, uncertainties were computed based on 1,000 bootstrapping selections from the ΔΔGComplex values). A dielectric of 2.0 is close to the minimum one would expect from electronic relaxation alone32. Our simulations, which feature (modest) structural relaxation and no electronic relaxation, hardly exceed this low level of total relaxation.
How much does the protein environment modulate the amount of dielectric screening? In our previous free energy study of ligand binding to CCP, we constructed an artificial ‘miniature binding site’ in silico, made of all CCP residues which contact the ligands, fixed in space by harmonic position restraints15. This miniature binding site is surrounded by bulk solvent rather than protein, which should raise the effective dielectric in the site. Comparing 〈|ΔΔGComplex|〉 between the full CCP protein and the miniature site allows us to directly observe how the binding site environment (low dielectric protein vs. high dielectric solvent) modulates sensitivity to charge parameters. Because not all ligand poses were simulated in the miniature site, we look here at a smaller set of charge perturbations (n = 744). This smaller set of charge perturbations has 〈|ΔΔGComplex|〉 = 0.81 ± 0.02 kcal/mol and an optimal εint of 2.12 ± 0.01, which are similar to 0.77 ± 0.02 kcal/mol and 2.58 ± 0.01 observed in the full set of 1060 perturbations, though with slightly less screening. When the 744 perturbations are made in the miniature site, 〈|ΔΔGComplex|〉 is 0.73 ± 0.02 kcal/mol and the optimal εint is 3.15 ± 0.01, both showing increased screening compared with the same perturbations made in the full protein. This εint was calculated by comparing the free-energy calculated ΔΔGComplex values in the miniature site with PB-calculated ΔΔGComplex values in the full protein. It thus represents the homogenous internal dielectric which, when used in PB calculations on the full protein, best reproduces the parameter sensitivity observed in free energy calculations in the miniature site.
How accurately can PB calculations predict the effects of charge parameter changes in free energy calculations? The RMSE (using the optimally fit εint) between PB calculations and free energy calculations was 0.50 kcal/mol in CCP and 0.52 kcal/mol in Gyrase, compared with the standard deviations of the underlying distributions of 0.99 and 1.07 kcal/mol in each protein (Table 3). In both systems, the PB calculations with a homogenous protein dielectric constant explain 75% of the variability of the free energy-computed ΔΔGComplex values. The remaining variability cannot be explained using a single homogenous protein dielectric constant, because different points on the ligands have different levels of flexibility themselves and feel different amounts of protein relaxation33,34.
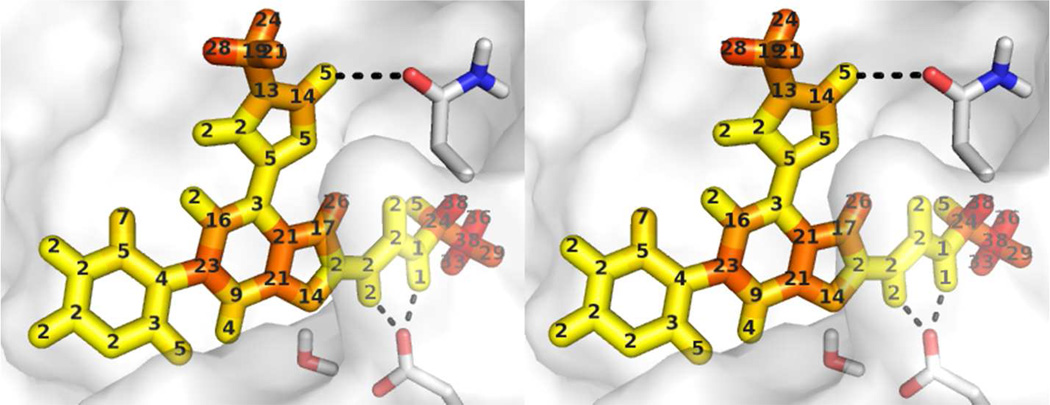
To gain a deeper insight into why different positions on the ligands feel differing amounts of protein dielectric relaxation, we examined how the optimal εint varied spatially throughout the ligand atoms. Rather than determining an overall optimal εint for the set of all charge parameter perturbations, we determined an individually optimal εint for each perturbation. The perturbations were originally applied to bonds, so we mapped these perturbations to the ligand atoms by averaging the optimal εint values for all bonds around a given atom. These optimal εint values are shown for one Gyrase ligand in Figure 7. These εint values represent the optimal homogenous protein dielectric constant for PB calculation to reproduce free energy calculations which slightly redistribute charge at a given position. They do not represent the total effective dielectric, because all PB calculations were performed with εext = 97 and only varied εint. Still, these numbers show interesting spatial variability in the amount of protein dielectric relaxation in free energy calculations. In particular, several atoms in contact with the protein surface on the central benzimidazole moiety of the ligand are best modeled in PB calculations with high (above 10) protein dielectric constants, which may relate to the presence of an adjacent buried water molecule in the free energy calculations.
Figure 7. Effective protein dielectric constant, probed from different ligand atoms in Gyrase.
For each ligand bond, an optimal protein εint for PB calculations was determined which matched the ΔΔGComplex values from free energy calculations. For each ligand atom, the optimal εint was defined as the average of the optimal εint values for each bond to that atom. Ligand atoms are colored by the optimal εint value. Residues Asn46 and Asp73 are shown explicitly, as is a water molecule from the free energy calculations which may raise the protein dielectric constant required for optimal PB calculations.
2.7 Cancellation of effects in solvent and in the protein strongly buffers affinities
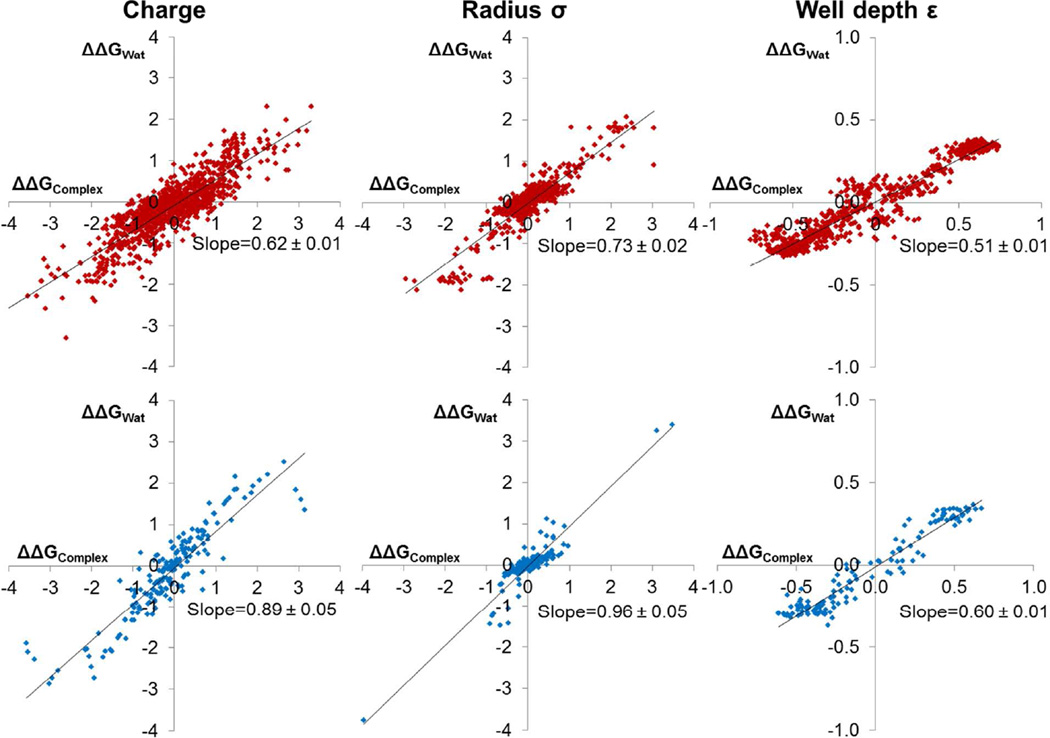
Dielectric screening appears to reduce the magnitude of 〈|ΔΔGComplex|〉 by 30% compared with gas-phase calculations. The magnitude of 〈|ΔΔGBind|〉 is then further reduced by cancellation of effects between ΔΔGComplex and ΔΔGWat, because parameter perturbations typically strengthen or weaken both protein-ligand and ligand-solvent interactions at the same time (Figure 8). For charge, σ, and ε perturbations in the CCP compounds, 〈|ΔΔGBind|〉 is 53%, 49%, and 67% as large as 〈|ΔΔGComplex|〉. The compensation is even stronger in Gyrase, because a larger fraction of each Gyrase ligand is exposed to solvent, and perturbing parameters on these atoms causes essentially equal changes in ΔGComplex and ΔGWat. The 30% reduction in 〈|ΔΔGComplex|〉 compared with gas-phase calculations, combined with a further 35–50% reduction in 〈|ΔΔGBind|〉 compared with 〈|ΔΔGComplex|〉 constitute a sizable buffering effect. This also suggests that it may be easier to predict accurate binding free energies than to predict accurate solvation free energies, because errors in parameters will cancel substantially between the protein-ligand interaction and the protein-solvent and ligand-solvent interactions.
Figure 8. Cancellation of effects in solvent and in the protein buffers the overall ΔGBind to changes in parameters.
In CCP (top, red), ΔΔGWat buffers 35–50% of the change in ΔΔGComplex (despite slopes of 0.6–0.7), while in Gyrase (bottom, blue) this buffering is even stronger. Best fit lines are shown in black. Slope uncertainties represent one standard deviation from bootstrapping calculations.
2.8 Multiple perturbations show some non-additivity, but do not buffer each other
To examine whether non-additivity buffers the overall affinity in response to multiple parameter perturbations, we exhaustively calculated ΔΔGBind values for all pairs of charge perturbations and all pairs of van der Waals perturbations. Perturbations to σ and ε were mixed together for this analysis, although we did not include perturbing both σ and ε on the same atom. We also calculated ΔΔGBind values for 100 triple perturbations per ligand, chosen by randomly selecting three single perturbations (all charge or all van der Waals) to perform together. As expected, the overall effect of multiple combined perturbations is larger than the effect of single perturbations (Figure 9). We then calculated ΔΔΔGNon-add as the difference between the actual ΔΔGBind for multiple perturbations and the expected ΔΔGBind based on additivity:
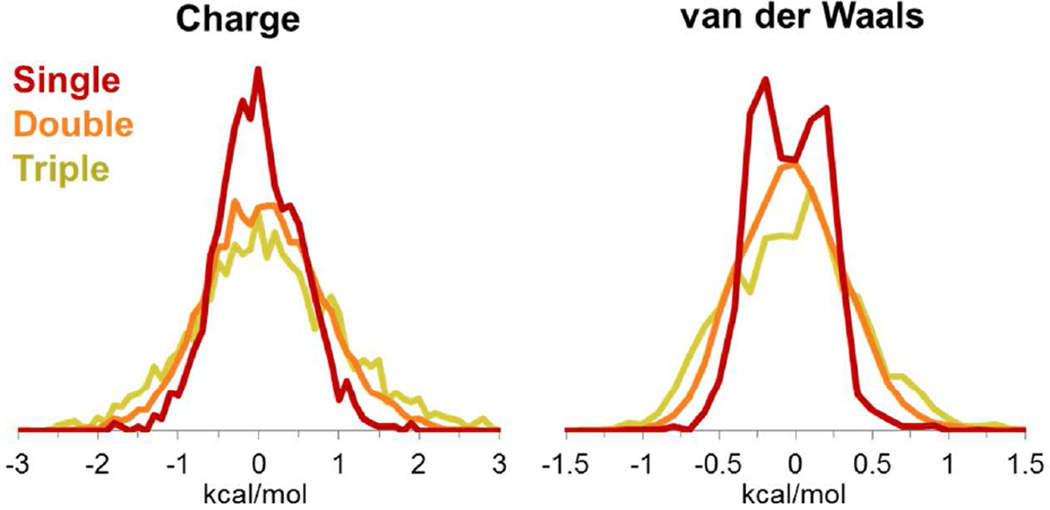
Figure 9. Multiple simultaneous perturbations lead to a broader distribution of ΔΔGBind values.
ΔΔGBind distributions in CCP for single (red), double (orange), and triple (yellow) simultaneous perturbations are shown binned at 0.1 kcal/mol. Histograms for single, double, and triple perturbations are normalized to each other; charge and van der Waals histograms are normalized separately.
For double perturbations:
| (5) |
In Eq. 5, ΔΔGBind,Simult is the free energy of perturbing parameters 1 and 2 simultaneously, and ΔΔGBind,1 and ΔΔGBind,2 are the free energies of perturbing parameters 1 and 2 individually.
For triple perturbations:
| (6) |
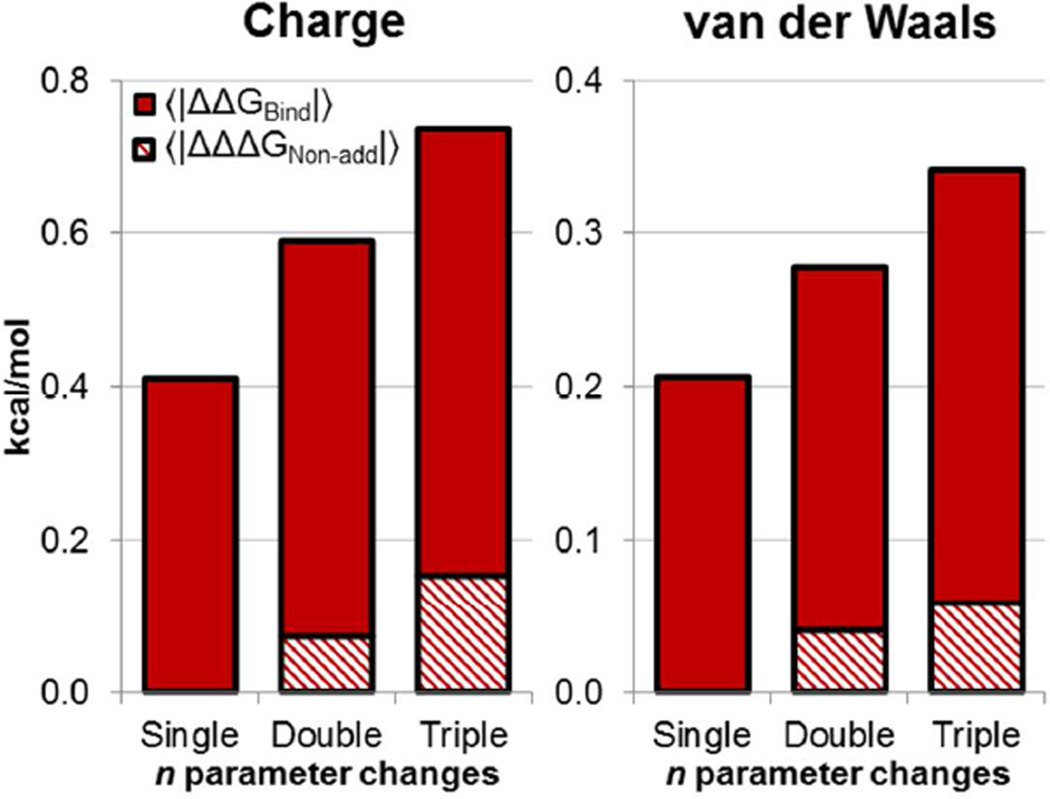
The combined effect of multiple small parameter perturbations is generally additive, though the amount of non-additivity increases with additional perturbations. We determined the relative amount of nonadditivity by comparing 〈|ΔΔGBind,Simult|〉 and 〈|ΔΔΔGNon-add|〉 (Figure 10). For double and triple charge perturbations, 〈|ΔΔΔGNon-add|〉 is 12% and 21% as large as 〈|ΔΔGBind,Simult|〉, and 15% and 17% as large for double and triple van der Waals perturbations. Free energy calculations do therefore contain an important non-additive element which may be missed by simpler scoring functions. However, this non-additivity will only buffer the overall magnitude of ΔΔGBind,Simult if ΔΔΔGNon-add and ΔΔGBind,Simult are oppositely signed. To examine this, we collected the magnitudes of all ΔΔΔGNon-add values, and assigned each one a negative sign if ΔΔGBind,Simult was smaller in magnitude than ΔΔGBind,1 + ΔΔGBind,2 (ΔΔΔGNon-add buffers ΔΔGBind,Simult), or assigned it a positive sign if ΔΔGBind,Simult was larger than ΔΔGBind,1 + ΔΔGBind,2 (ΔΔΔGNon-add adds to ΔΔGBind,Simult). With this sign convention, the average ΔΔΔGNon-add values for double and triple charge perturbations are −0.0026 ± 0.0007 and −0.0025 ± 0.0039 kcal/mol, and the average ΔΔΔGNon-add values for double and triple van der Waals perturbations are 0.0015 ± 0.0003 and 0.0011 ± 0.0019 kcal/mol. These average ΔΔΔGNon-add are very close to zero, meaning that multiple perturbations neither buffer each other nor are cooperative on average.
Figure 10. Multiple simultaneous perturbations show a small amount of non-additivity.
Solid bars show 〈|ΔΔGBind|〉 for single, double, and triple perturbations. The shaded regions shows 〈|ΔΔΔGNon-add|〉, which is the average amount of non-additivity in ΔΔGBind for multiple perturbations (see equations 5 and 6).
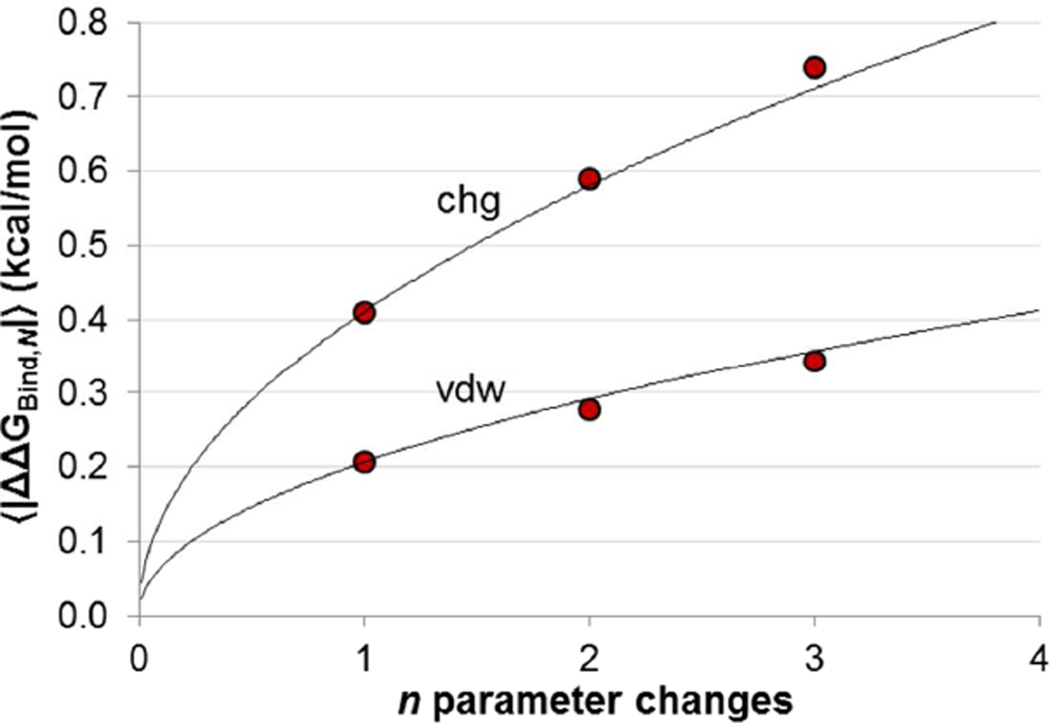
Because multiple perturbations combine additively on average (even though there is non-additivity in any individual case), the growth in 〈|ΔΔGBind|〉 with n perturbations should be predictable as if the perturbations were independent ,We show this in Figure 11, where each point is a 〈|ΔΔGBind|〉 value computed from the distributions in Figure 9. The black lines show the predicted 〈|ΔΔGBind|〉 values based on the single perturbation data, assuming that 〈|ΔΔGBind|〉 for n perturbations is n times 〈|ΔΔGBind|〉 for one perturbation. The prediction is very accurate for both n = 2 and n = 3, though the 〈|ΔΔGBind|〉 value for triple charge perturbations is slightly larger than the prediction.
Figure 11. Growth in 〈|ΔΔGBind|〉 for n parameter changes.
Red points: 〈|ΔΔGBind|〉 from CCP ΔΔGBind data for multiple simultaneous parameter changes. Bootstrapped uncertainties are shown but are smaller than the visual appearance of the data points. Black lines: expected 〈|ΔΔGBind|〉 growth for n random, independent simultaneous perturbations based on single perturbation data, growing as .
The small overall amount of non-additivity we observed results in part from our treatment of ligand symmetry. Because we treated symmetric ligand atoms as unique and considered each ligand in a fixed orientation in the binding site (though no restraints were applied), we obtained a higher resolution view of which interactions contributed to affinity, because otherwise identical atoms are distinguished from each other by the interactions they make. For example, for benzimidazole bound to CCP (shown in Figure 1 a), one symmetric imidazole amine forms a hydrogen bond with a protein aspartate residue, while the other symmetric amine hydrogen bonds with solvent. By treating the two amines differently, we can observe that the depolarizing the amine N-H (moving 0.1e of charge from the H to the N) which points at the aspartate weakens binding by 1.45 kcal/mol, while depolarizing the opposite amine has little effect on binding (0.02 kcal/mol). However, if one N-H bond were depolarized in a true binding calculation, the ligand would orient to point the more polar amine toward the aspartate and the less polar amine away, and the overall effect on binding (based on combining our data from both perturbations) for depolarizing one amine would be only 0.30 kcal/mol. By considering each amine separately, we calculated a larger average ΔΔGBind for depolarizing a benzimidazole amine (the average of 1.45 kcal/mol and 0.02 kcal/mol vs. the average of 0.30 kcal/mol and 0.30 kcal/mol). Just as our treatment of symmetry leads to a larger 〈|ΔΔGBind|〉 for depolarizing these amines, it also leads to a smaller 〈|ΔΔGBind|〉 for increasing the polarity of the amines, and the effect on 〈|ΔΔGBind|〉 for the entire dataset somewhat cancels because all perturbations were tested in both directions. However, our treatment of symmetry does decrease the amount of nonadditivity we observe. By considering each amine separately, we calculated a more additive ΔΔGBind,Simult for depolarizing both amines together: the combined ΔΔGBind,Simult is 1.46 kcal/mol, which is nearly the sum of 1.45 kcal/mol and 0.02 kcal/mol. If, alternatively, ΔΔGBind for depolarizing each amine is calculated as 0.30 kcal/mol because of ligand reorientation, then the combined ΔΔGBind,Simult appears highly non-additive (1.46 kcal/mol vs 0.60 kcal/mol), because only when both amines are depolarized together is the aspartate-ligand interaction weakened. Likewise, we observed a more additive ΔΔGBind,Simult for increasing the polarity of both amines as well. Overall, by re-analyzing simulations of ligands in fixed orientations and treating symmetry-related atoms as unique, our results underestimate the amount of nonadditivity resulting specifically from symmetric ligands, or groups which do not normally rotate in simulations but could if they were given asymmetric parameters, such as primary amines.
2.9 Differences between parameter sets may be correlated
The previous analysis considered the sensitivity of ΔGBind to random changes in ligand parameters. However, parameterization methods for force fields produce parameters which are coupled to each other: if some parameters were to change slightly, others could change in a compensatory fashion and produce a force field of similar quality, according to the objective function used for parameterization. As a result, even though ΔΔGBind becomes larger as a larger number of random parameter perturbations are applied (Figure 11), actual differences between force fields are not likely to be collections of random perturbations.
To examine how correlations between parameters lead to overall smaller ΔΔGBind values, we compared two sets of charge parameters for our CCP ligands: the original AM1-BCC parameters used as the reference parameters in this study, and new parameters derived by electrostatic potential (ESP) fitting to ab initio MP2 calculations, referred to as QM ESP parameters. These QM ESP parameters were also taken from ref. 15. The differences between AM1-BCC charges and QM ESP charges are correlated with each other, because AM1-BCC charges are also designed to reproduce the ESP around a given molecule, though fitting to the ESP itself often leads to underdetermined atomic partial charges.
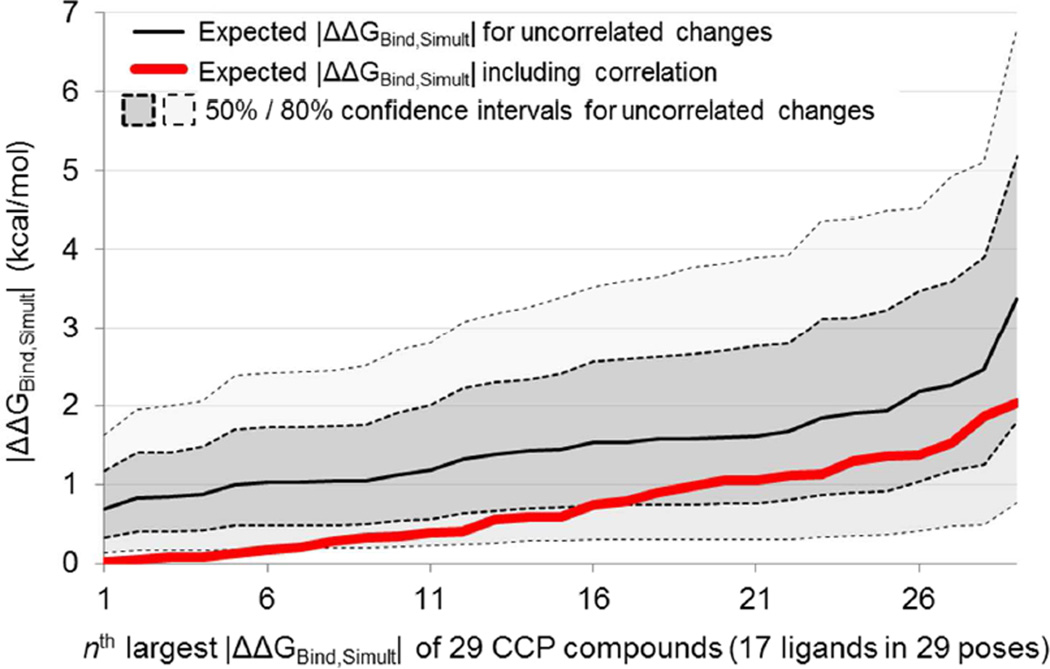
For each CCP compound, we decomposed the overall atomic charge differences between AM1-BCC parameters and QM ESP parameters into multiple individual bond perturbations, where a bond perturbation consists of transferring a specific amount of charge from one bonded atom to its bonded neighbor. When all of these bond perturbations are added to the original AM1-BCC parameters, the molecule is fully perturbed from AM1-BCC charges to QM ESP charges. Because we have already calculated ΔΔGBind for each individual bond perturbation on its own (assuming the linear relationship in Table 2 holds), we can predict an expected overall ΔΔGBind,Simult for perturbing a compound from AM1-BCC to QM ESP charges, using the assumption of exact additivity. (We use this assumption because we wish to examine the effect of correlations in parameters, and not non-additivity.) This expected ΔΔGBind,Simult includes any effect of correlation in the differences between AM1-BCC parameters and QM ESP parameters. The magnitudes of these expected ΔΔGBind,Simult values are shown in Figure 12 (red), with the values for each compound ordered from smallest (left) to largest (right).
Figure 12. Force fields with similar parameterization objective functions can lead to smaller |ΔΔGBind,Simult| values for many simultaneous parameter perturbations.
Red: expected |ΔΔGBind,Simult| values for perturbing the charges along each bond in CCP compounds until AM1-BCC charges have been transformed into QM ESP charges, based on measured sensitivities for single bond perturbations and assuming exact additivity, ordered from smallest (left) to largest (right). Black: expected |ΔΔGBind,Simult| values for perturbing the charges along each bond in CCP compounds randomly until the same overall magnitude of perturbation has been applied as the difference between AM1-BCC charges and QM ESP charges (see text), again based on measured sensitivities for single bond perturbations and assuming exact additivity. Shaded regions indicate 50% confidence and 80% confidence windows for the randomly assigned bond perturbations based on 10,000 trials. Ligands have no specific order in the 10,000 trials; different ligands end up as “least perturbed” and on the far left in each different trial, and the black line represents the average over all trials of the least perturbed ligands for a given trial (far left), the second least perturbed ligands for a given trial (second from left), and so forth
To remove any effect of correlation in the differences between parameter sets, we generated thousands of variant parameter sets of the original AM1-BCC parameters. Each variant parameter set (10,000 per compound) was generated by taking the magnitudes of the AM1-BCC-to-QM ESP bond perturbations and assigning each magnitude to a random bond in a random direction, each magnitude being used once and each bond being perturbed once. Each of these variant parameter sets is thus equally different from the original AM1-BCC parameters as the QM ESP parameter are, except that the difference is randomly distributed instead of distributed in a correlated fashion. By again using the ΔΔGBind values for single perturbations and assuming exact additivity, we predicted expected ΔΔGBind,Simult values for each variant parameter set. Using all the variant parameter sets for all the compounds, we produced a background distribution of |ΔΔGBind,Simult| for perturbations of the same magnitude as the difference between AM1-BCC and QM ESP, but without correlations in which parameters change simultaneously. These expected |ΔΔGBind,Simult| values are shown in black in Figure 12, along with the 50% and 80% confidence intervals. Figure 12 indicates that the actual differences between AM1-BCC and the QM ESP parameters (red) result in smaller changes in affinity 〈|ΔΔGBind,Simult|〉 than would be expected if the parameters were randomly perturbed by an amount equal in magnitude to the overall difference between the AM1-BCC and QM ESP parameter sets (black). Some ligands are not expected to change affinity at all (leftmost ligands, red) between AM1-BCC and QM ESP parameters 〈|ΔΔGBind,Simult| < 0.1 kcal/mol〉, even though the magnitude of the parameter changes being made would suggest that whichever ligand changes least would change by 0.7 kcal/mol (leftmost ligands, black).
3 Discussion
3.1 How accurate do force field parameters need to be?
The force fields used in binding calculations suffer from inherent inaccuracies: the force field itself uses a simplified, classical-mechanical functional form36,37, a limited number of atom types are used to represent the breadth of chemical space18, the experimental data available for selecting parameters is incomplete and leaves parameters underdetermined, and the “correct” parameters will often depend on the chemical environment in ways which are still challenging to capture , These approximations can introduce errors in simulated binding affinities, though the magnitude of these errors depends on the sensitivity of computed binding affinities to the force field parameters. Here, we find that dielectric screening reduces this sensitivity by 30% compared with the strength of molecular interactions in the gas phase (Figure 6 and Table 3), and that cancellation of effects between protein-ligand interactions and solvent-ligand interactions reduces the sensitivity by a further 35–50% (Figure 8).
Despite these buffering effects, the scaling of 〈|ΔΔGBind|〉 with n parameter perturbations may pose a serious challenge to obtaining accurate binding affinities for drug-size molecules. This scaling has previously been hypothesized by Merz, who applied it to calculate the expected error in a computational affinity prediction between Indinavir (molecular weight 613.8 g/mol, 45 heavy atoms) and HIV protease35. Here, we re-consider this problem for binding free energy calculations in light of our results. We start by assuming the overall error in a free energy calculation for Indinavir binding results from the combined effects of many small errors in force field parameters, that these parameter errors impact the binding affinity primarily through modulating interaction strengths, and not through altering the protein or ligand conformation, and that these errors consist of random independent inaccuracies in parameters compared with their “true” values which would produce the correct affinity. Actual errors in force fields are certainly not entirely independent, as Figure 12 suggests. However, some fraction of the overall error will behave in this manner, and it is useful to estimate how much random error is tolerable. Indinavir has 96 bonds which can have incorrect charge distributions, and 92 atoms which can each have two erroneous van der Waals parameters. As a first approximation, we can consider the binding site to have an identical number of relevant charge and van der Waals parameters, doubling the effective number of errors.
If we begin by assuming the same average parameter errors which we have examined in this study – 0.1e per bond, 0.3 Å per radius, 0.04 kcal/mol per well depth and – the combined effects of 192 random independent errors in bond charges, 184 errors in well depths and 184 errors in radii leads to an expected 6.9 kcal/mol error in the affinity prediction, based on the distribution of ΔΔGBind values from the CCP data in Figure 2. To obtain a free energy prediction with 68% confidence (one standard deviation) of being within 1 kcal/mol of the true affinity, the upper limit on random errors in individual parameters is nearly ten-fold smaller than the perturbation magnitudes considered here: 0.01e per bond, 0.03 Å per radius, and 0.004 kcal/mol per well depth. The exceptionally large size of Indinavir makes it an extreme case, though the results are similar for more moderately-sized lead-like ligands: a similar analysis of the 48 bonds and 41 atoms in the Gyrase ligand in Figure 1b using the Gyrase van der Waals data in Figure 2 and the Gyrase bond-type specific charge data in Figure 3 leads to an expected 4.1 kcal/mol error in affinity prediction, implying that parameter errors must be five-fold smaller than those considered here for 68% confidence in a predicted affinity. These targets for accuracy are substantially smaller than the RMS differences between the commonly used protein force fields shown in Table 1. However, the parameter differences between these force fields are likely correlated, making binding affinities more similar between these force fields than would be expected from the parameter differences alone, as in Figure 12. Assessing the extent of this correlation and its effect on ligand binding affinity is beyond the scope of this work, though it is important for guiding force field development.
Several caveats apply to this analysis. Importantly, we assume above that only random errors (like our parameter perturbations) affect the binding affinities, and not systematic errors, which could lead to greater inaccuracy13. We also neglect possible errors in conformational parameters such as torsions, which may be widespread in force fields. This is a reasonable approximation for the relatively rigid CCP ligands, but error in torsional parameters could cause even larger errors in calculations on drug-size compounds than our present analysis predicts. Finally, the sensitivity of binding affinity to parameters will depend on the force field itself. Different force fields might agree on a particular binding affinity, yet display different sensitivities to parameters, and understanding these differences should be useful in developing robust physics-based methods for predicting binding affinity.
3.2 How can force fields be improved?
Our results identify several directions for improvements in force fields. The perturbation sizes we examined − 0. 1e for charges, 0.3 Å for radii, and 0.04 kcal/mol for well depths ߝ are roughly proportional to the RMS difference between AMBER, CHARMM, and OPLSAA parameters in Table 1 (111%, 88%, and 111% respectively). With this rough normalization, 〈|ΔΔGBind|〉 for charge parameters is about twice as large as 〈|ΔΔGBind|〉 both van der Waals parameters (Figures 2 and 5). This suggests that charge parameters may be a larger source of inaccuracy. The significant sensitivity to charge parameters may result from an effective protein dielectric which is too low. We observed an effective protein dielectric near 2.5 in CCP and below 3 in Gyrase, while a dielectric of at least 2 is expected from electronic relaxation alone32. Adding explicit polarizability to force fields may help correct this, and a similar sensitivity analysis in a polarizable system would be especially informative regarding the effect of screening. Still, the true impact of the difference in charge parameters between protein force fields is likely smaller than would be expected from the RMS difference in parameters, due to the types of correlations shown in Figure 12, and correlations between σ and ε and between the van der Waals and charge parameters likely exist as well.
The variation between force fields in van der Waals parameters can also have an important impact on binding affinities. For example, CHARMM24 and OPLSAA-200125 well depths are on average 0.009 kcal/mol (12%) and 0.004 kcal/mol (5%) smaller than AMBER22 well depths. Importantly, this average difference in epsilon will cause a systematic difference in affinities between the force fields, growing linearly with the number of atoms, because differences in epsilon consistently affect binding in the same direction (Figure 4). While this difference between force fields was calculated using amino acid parameters, we can still use our data examining sensitivity to ligand parameters to estimate the importance of this systematic difference. A change in well depth of 0.04 kcal/mol on a single ligand atom generally changes binding affinity by more than 0.2 kcal/mol (Figure 4). This suggests the well-depth difference between AMBER and CHARMM can easily cause a 1 kcal/mol difference in a system with 15 ligand atoms and only 15 relevant protein atoms, if the affinity is equally sensitive to both ligand parameters and protein parameters. For a ~100 atom compound like Indinavir, the difference could be 8 kcal/mol. Correlations between van der Waals parameters and electrostatic parameters could mitigate these effects, though similarly sized ligands can have different levels of polarity, making it difficult for these effects to compensate consistently.
4. Conclusion
We quantified the sensitivity of binding free energy calculations to ligand parameters by measuring ΔΔGBind for tens of thousands of small parameter perturbations. This quantitative measure of sensitivity can be used to interpret differences between force fields at computing the same compound’s binding affinity, and can also be used to gain chemical intuition into which properties of a molecule are most important for its affinity. ΔΔGBind in solution is 65% less sensitive to parameters than would be expected from vacuum calculations, but the growth in random error in binding calculations may make affinities difficult to predict. This smaller sensitivity may contribute to the increased accuracy of free energy calculations compared with docking and scoring methods, and similar sensitivity analyses of other methods should be useful in examining this further. Based on our measured sensitivities, we calculated the tolerable random error in force field interaction parameters for large drug-sized or medium-sized lead compounds to be 0.01–0.02e per charge, 0.03–0.06 Å per radius, and 0.004–0.008 kcal/mol per well depth, which is significantly smaller than the variation in amino acid parameters in several commonly used protein force fields. We expect that theoretical and experimental studies in simplified binding sites will be critical toward achieving this level of accuracy, because the number of parameters contributing to affinity is already quite large even in these small systems.
Acknowledgements
We gratefully acknowledge support, including: National Science Foundation (NSF) and Department of Defense pre-doctoral fellowships (to G.J.R.); National Institutes of Health (NIH) grant GM096257, NSF EPSCoR Cooperative Agreement No. EPS-1003897, Louisiana Board of Regents Research Competitiveness and Research Enhancement Subprograms and additional support from the Louisiana Board of Regents (to D.L.M.); and NIH grant GM063592 and GM090205 (to K.A.D.). We thank Vivian Jaber (University of New Orleans) for the Gyrase simulation data. We are also grateful to Vertex Pharmaceuticals (and specifically Kim Branson (now at OpenEye), Richard Dixon, Paul Charifson, and Pat Waters) for providing the Gyrase dataset. We thank John Chodera and Michael Shirts for helpful discussions and suggestions on the manuscript.
Appendix: Methods
Free energy calculations
Software
All simulations of the protein-ligand complexes, the Gyrase ligands in solution, and all simulation reprocessing was performed using the FEP branch of the GROMACS 4.540 git repository, accessed after June 2011 and kindly provided by Michael Shirts. Simulations of the free CCP ligands in solution were performed using GROMACS 3.3.4.
Force fields
CCP and Gyrase were each parameterized using the AMBER99SB force field41. Ligands were parameterized using Generalized Amber Force Field (GAFF)18,19 parameters generated using Antechamber 1.27, with AM1-BCC charges20,21 generated using the OEChem toolkit version 1.5. Heme parameters and charges were taken from the Hemoglobin model in Amber 8, and an additional +1 charge was added to the iron to form Fe(III), as in Banci et al.42. The Fe-Nε bond between the Heme and His175 and the four Heme N-Fe-Nε angles were parameterized using force constants taken from Banci et al.42, with equilibrium lengths and angles generated based on averaging the existing crystal structures of CCP W191G, as in ref. 15 and ref. 43. Protonation states of titratable residues were selected using MCCE 2.244,45, with a reference pH of 4.5 for CCP (model 1KXN with the Heme removed) and pH 7.0 for Gyrase. Simulations were performed using the TIP3P water model.
Simulation parameters
All simulations (new and reprocessed existing simulations) were performed using Langevin dynamics at constant volume, a temperature of 300 K, inverse friction constant of 1.0 ps, and 2 fs step size. Lennard-Jones interactions were smoothly switched off after 8 Å and truncated at 9 Å. The neighborlist was set to 1 nm and updated every 10 steps. Electrostatic interactions were calculated using the particle-mesh Ewald (PME) method with tinfoil boundary conditions, a real space cutoff of 1 nm, a spline order of 6, a Fourier spacing of 1 Å, and a relative tolerance between long- and short-range energies of 10−6. Bonds to hydrogen were constrained using LINCS. Simulations of the free ligands in vacuum were performed using cut-off electrostatics with a 2 nm cut-off distance.
Equilibration of free ligands in solvent
Ligands were equilibrated in solvent using the protocol taken from ref. 46. Briefly, ligands were solvated in a truncated dodecahedral box with a 1.2 nm distance between the ligand and the box edge, energy minimized, and equilibrated for 10 ps at constant volume and 100 ps at constant pressure.
Equilibration of protein-ligand complexes
The CCP protein-ligand complexes were equilibrated using the protocol taken from ref. 15. Briefly, PDB structure 1KXN14 was solvated in a truncated dodecahedral box with a 1.2 nm distance between the protein and the box edge, along with 5 neutralizing Cl− ions and an additional 100 mM ionic strength of NaCl. The solvent and ions were then equilibrated for 2 ns at constant volume while the protein coordinates were held fixed. The protein was then energy minimized and equilibrated for 2 ns as in ref. 47. Each ligand was inserted into this equilibrated, solvated protein system in several conformations chosen by docking, and water molecules within 2.0 Å of the inserted ligand were removed, creating several separate systems for each ligand, each with an individual ligand pose. These systems were simulated for 1 ns each to identify metastable ligand poses using the method described in ref. 15, and additional 1 ns simulations were initiated from each metastable pose. These last simulations, in which the ligand remained in its metastable pose through the simulation, were reprocessed for this study.
The Gyrase protein-ligand complex coordinates were directly provided by Vertex Pharmaceuticals. Each complex was then solvated in a truncated dodecahedral box with 1.2 nm distance between the protein and the box edge, along with 9 neutralizing Na+ ions and no additional ionic strength. Following minimization of the protein and solvent, the system was equilibrated for 50 ps at constant volume and 200 ps at constant pressure. 1-ns production runs were then performed which were used here for re-analysis. Both ligands remained approximately in their starting orientations throughout these runs.
Reprocessing
All ΔΔGWat values were calculated using at least 1000 snapshots from a simulation of 1 ns or longer (longer simulations were used for ligands with more flexibility). All ΔΔGComplex values for single perturbations were calculated using at least 100 snapshots from a simulation of 1 ns or longer, and ΔΔGComplex values for double and triple perturbations were calculated using at least 1000 snapshots.
Poisson-Boltzmann calculations
PB calculations were performed using APBS 1.348 in a cubic box with 9.2 nm edge length, 0.575 Å grid spacing (161 grid points in each direction), and no ionic strength at 300 K. The linearized Poisson-Boltzmann equation was solved using the 4-level multigrid method, with multiple Debye-Huckel sphere boundary conditions, and a “molecular” surface definition with a 1.4 Å solvent probe and harmonic average smoothing. A total of 50 (CCP) or 200 (Gyrase) evenly spaced snapshots were taken from the MD trajectories used for reprocessing, stripped of all water residues and ions and analyzed with the ligand centered in the box. Optimal εint values were calculated based on interpolating calculations using εint values of 1, 2, 3, 4, 6, 8, 10, 12, 15, 20, 30, 40, and 80.
References
- 1.Mobley DL, Graves AP, Chodera JD, McReynolds AC, Shoichet BK, Dill KA. J. Mol. Biol. 2007;371:1118–1134. doi: 10.1016/j.jmb.2007.06.002. [DOI] [PMC free article] [PubMed] [Google Scholar]
- 2.Boyce SE, Mobley DL, Rocklin GJ, Graves AP, Dill KA, Shoichet BK. J. Mol. Biol. 2009;394:747–763. doi: 10.1016/j.jmb.2009.09.049. [DOI] [PMC free article] [PubMed] [Google Scholar]
- 3.Lau AY, Roux B. Nat. Struct. Mol. Biol. 2011;18:283–287. doi: 10.1038/nsmb.2010. [DOI] [PMC free article] [PubMed] [Google Scholar]
- 4.Lin Y-L, Meng Y, Jiang W, Roux B. Proc. Natl. Acad. Sci. 2013;110:1664–1669. doi: 10.1073/pnas.1214330110. [DOI] [PMC free article] [PubMed] [Google Scholar]
- 5.Gilson MK, Given JA, Bush BL, McCammon JA. Biophys J. 1997;72:1047–1069. doi: 10.1016/S0006-3495(97)78756-3. [DOI] [PMC free article] [PubMed] [Google Scholar]
- 6.Leach AR, Shoichet BK, Peishoff CE. J. Med. Chem. 2006;49:5851–5855. doi: 10.1021/jm060999m. [DOI] [PubMed] [Google Scholar]
- 7.Mobley DL, Dill KA. Structure. 2009;17:489–498. doi: 10.1016/j.str.2009.02.010. [DOI] [PMC free article] [PubMed] [Google Scholar]
- 8.Chodera JD, Mobley DL, Shirts MR, Dixon RW, Branson K, Pande VS. Curr. Opin. Struct. Biol. 2011;21:150–160. doi: 10.1016/j.sbi.2011.01.011. [DOI] [PMC free article] [PubMed] [Google Scholar]
- 9.Muddana HS, Gilson MK. J. Comput.-Aided Mol. Des. 2012;26:517–525. doi: 10.1007/s10822-012-9544-3. [DOI] [PMC free article] [PubMed] [Google Scholar]
- 10.Wong CF. J. Am. Chem. Soc. 1991;113:3208–3209. [Google Scholar]
- 11.Wong CF, Rabitz H. J. Phys. Chem. 1991;95:9628–9630. [Google Scholar]
- 12.Schutz CN, Warshel A. Proteins. 2001;44:400–417. doi: 10.1002/prot.1106. [DOI] [PubMed] [Google Scholar]
- 13.Faver JC, Benson ML, He X, Roberts BP, Wang B, Marshall MS, Kennedy MR, Sherrill CD, Merz KM., Jr J. Chem. Theory. Comput. 2011;7:790–797. doi: 10.1021/ct100563b. [DOI] [PMC free article] [PubMed] [Google Scholar]
- 14.Rosenfeld R, Hays A, Musah R, Goodin D. Protein Sci. 2002;11:1251–1259. doi: 10.1110/ps.4870102. [DOI] [PMC free article] [PubMed] [Google Scholar]
- 15.Rocklin GJ, Boyce SE, Fischer M, Fish I, Mobley DL, Shoichet BK, Dill KA. Submitted to J. Mol. Biol. 2013 doi: 10.1016/j.jmb.2013.07.030. [DOI] [PMC free article] [PubMed] [Google Scholar]
- 16.Charifson PS, Grillot A-L, Grossman TH, Parsons JD, Badia M, Bellon S, Deininger DD, Drumm JE, Gross CH, LeTiran A, Liao Y, Mani N, Nicolau DP, Perola E, Ronkin S, Shannon D, Swenson LL, Tang Q, Tessier PR, Tian S-K, Trudeau M, Wang T, Wei Y, Zhang H, Stamos D. J. Med. Chem. 2008;51:5243–5263. doi: 10.1021/jm800318d. [DOI] [PubMed] [Google Scholar]
- 17.Dill KA. J. Biol. Chem. 1997;272:701–704. doi: 10.1074/jbc.272.2.701. [DOI] [PubMed] [Google Scholar]
- 18.Wang J, Wolf RM, Caldwell JW, Kollman PA, Case DA. J. Comput. Chem. 2004;25:1157–1174. doi: 10.1002/jcc.20035. [DOI] [PubMed] [Google Scholar]
- 19.Wang J, Wang W, Kollman PA, Case DA. J. Mol. Graphics. Modell. 2006;25:247–260. doi: 10.1016/j.jmgm.2005.12.005. [DOI] [PubMed] [Google Scholar]
- 20.Jakalian A, Bush BL, Jack DB, Bayly CI. J. Comput. Chem. 2000;21:132–146. [Google Scholar]
- 21.Jakalian A, Jack DB, Bayly CI. J. Comput. Chem. 2002;23:1623–1641. doi: 10.1002/jcc.10128. [DOI] [PubMed] [Google Scholar]
- 22.Wang J, Cieplak P, Kollman PA. J. Comput. Chem. 2000;21:1049–1074. [Google Scholar]
- 23.Duan Y, Wu C, Chowdhury S, Lee MC, Xiong G, Zhang W, Yang R, Cieplak P, Luo R, Lee T, Caldwell J, Wang J, Kollman P. J. Comput. Chem. 2003;24:1999–2012. doi: 10.1002/jcc.10349. [DOI] [PubMed] [Google Scholar]
- 24.MacKerell, Bashford D, Bellott, Dunbrack, Evanseck JD, Field MJ, Fischer S, Gao J, Guo H, Ha S, Joseph-McCarthy D, Kuchnir L, Kuczera K, Lau FTK, Mattos C, Michnick S, Ngo T, Nguyen DT, Prodhom B, Reiher WE, Roux B, Schlenkrich M, Smith JC, Stote R, Straub J, Watanabe M, Wiórkiewicz-Kuczera J, Yin D, Karplus M. J. Phys. Chem. B. 1998;102:3586–3616. doi: 10.1021/jp973084f. [DOI] [PubMed] [Google Scholar]
- 25.Kaminski GA, Friesner RA, Tirado-Rives J, Jorgensen WL. J. Phys. Chem. B. 2001;105:6474–6487. [Google Scholar]
- 26.Flick JC, Kosenkov D, Hohenstein EG, Sherrill CD, Slipchenko LV. J. Chem. Theory Comput. 2012;8:2835–2843. doi: 10.1021/ct200673a. [DOI] [PubMed] [Google Scholar]
- 27.Simonson T. Int. J. Quantum Chem. 1999;73:45–57. [Google Scholar]
- 28.Honig B, Nicholls A. Science. 1995;268:1144–1149. doi: 10.1126/science.7761829. [DOI] [PubMed] [Google Scholar]
- 29.Sharp KA, Honig B. J. Phys. Chem. 1990;94:7684–7692. [Google Scholar]
- 30.Baker NA. In: Methods in Enzymology. Brand Ludwig, Johnson Michael L., editors. Vol. 383. Academic Press; 2004. pp. 94–118. [DOI] [PubMed] [Google Scholar]
- 31.Höchtl P, Boresch S, Bitomsky W, Steinhauser O. J. Chem. Phys. 1998;109:4927–4937. [Google Scholar]
- 32.Simonson T, Perahia D. J. Am. Chem. Soc. 1995;117:7987–8000. [Google Scholar]
- 33.Patargias GN, Harris SA, Harding JH. J Chem Phys. 2010;132:235103. doi: 10.1063/1.3430628. [DOI] [PubMed] [Google Scholar]
- 34.Guest WC, Cashman NR, Plotkin SS. Phys Chem Chem Phys. 2011;13:6286–6295. doi: 10.1039/c0cp02061c. [DOI] [PubMed] [Google Scholar]
- 35.Merz KM. J. Chem. Theory Comput. 2010;6:1769–1776. doi: 10.1021/ct100102q. [DOI] [PMC free article] [PubMed] [Google Scholar]
- 36.Mackerell AD. J. Comput. Chem. 2004;25:1584–1604. doi: 10.1002/jcc.20082. [DOI] [PubMed] [Google Scholar]
- 37.Paton RS, Goodman JM. J. Chem. Inf. Model. 2009;49:944–955. doi: 10.1021/ci900009f. [DOI] [PubMed] [Google Scholar]
- 38.Marshall GR. J Comput Aided Mol. Des. 2013;27:107–114. doi: 10.1007/s10822-013-9634-x. [DOI] [PMC free article] [PubMed] [Google Scholar]
- 39.Cohen BE, McAnaney TB, Park ES, Jan YN, Boxer SG, Jan LY. Science. 2002;296:1700–1703. doi: 10.1126/science.1069346. [DOI] [PubMed] [Google Scholar]
- 40.Pronk S, Páll S, Schulz R, Larsson P, Bjelkmar P, Apostolov R, Shirts MR, Smith JC, Kasson PM, Spoel D, van der, Hess B, Lindahl E. Bioinformatics. 2013 doi: 10.1093/bioinformatics/btt055. [DOI] [PMC free article] [PubMed] [Google Scholar]
- 41.Hornak V, Abel R, Okur A, Strockbine B, Roitberg A, Simmerling C. Proteins. 2006;65:712–725. doi: 10.1002/prot.21123. [DOI] [PMC free article] [PubMed] [Google Scholar]
- 42.Banci L, Carloni P, Savellini GG. Biochemistry. 1994;33:12356–12366. doi: 10.1021/bi00207a002. [DOI] [PubMed] [Google Scholar]
- 43.Rocklin GJ, Mobley DL, Dill KA. JCP: BioChemical Physics. 2013;7:02B614–02B614. [Google Scholar]
- 44.Alexov EG, Gunner MR. Biophys. J. 1997;72:2075–2093. doi: 10.1016/S0006-3495(97)78851-9. [DOI] [PMC free article] [PubMed] [Google Scholar]
- 45.Georgescu RE, Alexov EG, Gunner MR. Biophys. J. 2002;83:1731–1748. doi: 10.1016/S0006-3495(02)73940-4. [DOI] [PMC free article] [PubMed] [Google Scholar]
- 46.Mobley DL, Dumont É, Chodera JD, Dill KA. J. Phys. Chem. B. 2007;111:2242–2254. doi: 10.1021/jp0667442. [DOI] [PubMed] [Google Scholar]
- 47.Mobley DL, Chodera JD, Dill KA. J. Chem. Phys. 2006:125. doi: 10.1063/1.2221683. [DOI] [PMC free article] [PubMed] [Google Scholar]
- 48.Baker NA, Sept D, Joseph S, Holst MJ, McCammon JA. Proc. Natl. Acad. Sci. U.S.A. 2001;98:10037–10041. doi: 10.1073/pnas.181342398. [DOI] [PMC free article] [PubMed] [Google Scholar]


