

Abstract
Purpose
Ocular lymphatics have been recently shown to contribute to aqueous humor outflow. It is not yet known whether lymphatic outflow can be stimulated by pharmacological agents. Here we determine whether latanoprost, a prostaglandin F2 alpha analog commonly used to lower IOP to treat glaucoma, increases lymphatic drainage from the eye.
Methods
Lymphatic drainage in mice was assessed in vivo, in 11 latanoprost-treated and 11 control animals using hyperspectral imaging at multiple times following quantum dot (QD) injection into the eye. QD signal intensity was also measured in tissue sections using hyperspectral imaging.
Results
In the latanoprost-treated group, lymphatic drainage rate into the submandibular lymph node was increased compared with controls (1.23 ± 1.06 hours−1 vs. 0.30 ± 0.17 hours−1, mean ± SD, P < 0.02). Total QD signal intensity in the submandibular lymph node was greater in the latanoprost-treated group compared with controls (10.55 ± 1.12 vs. 9.48 ± 1.24, log scale, P < 0.05).
Conclusions
This is the first evidence that latanoprost increases lymphatic drainage from the eye. The pharmacological manipulation of this newly identified lymphatic outflow pathway may be relevant to treatments aimed at lowering intraocular pressure in glaucoma.
Translational Relevance
This is the first evidence that a prostaglandin drug widely prescribed for glaucoma, enhances lymphatic drainage from the eye. The pharmacological stimulation of this newly identified outflow pathway may be highly relevant to treatments aimed at lowering IOP to prevent blindness from glaucoma.
Keywords: prostaglandins, lymphatic, eye, in vivo imaging, nanotechnology
Introduction
We have recently identified a lymphatic drainage pathway in the human and sheep eye.1 This recently described pathway contributes to aqueous humor outflow from the eye and regulation of the IOP along conventional trabecular meshwork and uveoscleral outflow pathways.2 Elevated IOP is a major risk factor for glaucoma, a leading cause of irreversible blindness worldwide,3 affecting 70 million people.4 Lowering IOP with medicated eye drops to improve fluid drainage from the eye helps to preserve vision in glaucoma patients.5 Current eye medications that increase fluid drainage target the trabecular meshwork and uveoscleral pathways.6,7 Surgical treatments with additional risk of vision loss may be needed if these do not control IOP,8 so there is a compelling need for new drug choices to care for patients with glaucoma. It is not yet known whether any drug can stimulate ocular lymphatic drainage.
Prostaglandin analogs are well established to stimulate lymphatic drainage in nonocular tissues.9–11 However, it is not clear whether prostaglandins act on the lymphatic outflow pathway of the eye.1 Among the antiglaucoma drugs, prostaglandin F2 alpha analogs such as latanoprost are the most potent, and most commonly prescribed worldwide to treat glaucoma. Latanoprost increases fluid drainage from the eye in glaucoma patients12 and this is ascribed to its action on the uveoscleral pathway.13,14 We have combined in vivo hyperspectral imaging and a nanotracer to map ocular lymphatic drainage in the mouse,15 having aqueous dynamics and pharmacology similar to humans.16 Here, we use this assay combining in vivo hyperspectral imaging and a nanotracer, to determine whether latanoprost, a glaucoma drug, stimulates lymphatic drainage from the eye.
Methods
Subjects
Experiments were designed and performed in accordance with the guidelines of the ARVO Statement for the Use of Animals in Ophthalmic and Vision Research. Following approval by the Institutional Animal Care Committees at St. Michael's Hospital and at University Health Network, 38 randomly bred male pigmented mice (129SVE; Taconic, Hudson, NY) weighing 22 to 30 g were studied. Housed under constant 12-hour light/dark cycles, they were provided with standard food and water ad libitum the day before experiments.
Topical Application of Latanoprost and Intracameral Injection of Quantum Dot (QD) as a Tracer
Mice were placed under general anesthesia using 1.5% or 3% inhalation isoflurane (Abbott Labs Inc., Saint-Laurent, QC, Canada) in 70% N2O and balance of O2. In one group, 3 drops of latanoprost 0.005% (Xalatan; Pfizer, QC, Canada) (n = 14) were instilled to the eyes at 5 PM and the following day at 9 AM (1 hour prior to the tracer injection). The same was done in a control group with artificial tears (Refresh; Allergan Inc., ON, Canada) (n = 14).15 Under an operating microscope (Leica M655, Wetzlar, Germany), 3 μL of QD655 (8 μM solution in a 50 nM borate buffer; Invitrogen, Eugene, OR) was injected into the anterior chamber of the left eye using a 33-gauge needle (Hamilton Company, Reno, NV) and a Hamilton syringe (Hamilton Company). QD655 has a core/shell of CdSe/ZnS with maximal emission at 655 nm, and were coated with carboxylic acids and negatively charged (QD-COOH, pH 9.0).
Intraocular Pressure (IOP)
Effects of Latanoprost on IOP
IOP (Fig. 1) was measured with a handheld rebound tonometer (TonoLab, Type TV02; Icare Finland Oy, Helsinki, Finland)17–22 under general anesthesia as described above. IOP measurements were performed to confirm the IOP reduction following topical application of latanoprost. Mean IOP of six consecutive measurements excluding the highest and lowest values were calculated. Three mean IOPs were obtained and averaged at each time point. One drop of 0.005% latanoprost (Cayman Chemical Co., Ann Arbor, MI) or 0.02% benzalknonium chloride in 1× PBS (Sigma-Aldrich, St. Louis, MO) was topically applied to the left eye at 5 PM and 16 hours later. Right and left eye IOPs were measured prior to each instillation, and 1, 1.5, 2, 3, and 5 hours following last instillation. All IOPs were measured 1 minute after induction of general anesthesia to minimize the effects of anesthesia on IOP.23 The effect of isoflurane on IOP during in vivo imaging was not studied in the present experiments. The IOP decrease in the latanoprost-treated group (n = 5) was compared with that in the control group (n = 5). Mean IOP in latanoprost-treated mice was compared with controls at each time point using two-sample t-tests assuming equal variances.
Figure 1. .

Timeline for inhalation anesthesia (IN), IOP measurement, and topical application (TA).
Effects of Intracameral Injection on IOP
Under general anesthesia as described above, IOP was measured before tracer injection and at the end of experiments to monitor any IOP changes due to QD injection. No statistically significant difference in IOP was observed between measurements performed before tracer injection and 6 hours after tracer injection for latanoprost-treated and control mice. (Latanoprost-treated group: before tracer injection: 17.9 ± 6.6 mm Hg and 6 hours after tracer injection: 15.1 ± 5.2 mm Hg, t-test, P > 0.2; control group: before: 17.6 ± 4.2 mm Hg, and 6 hours after tracer injection 15.5 ± 4.5 mm Hg, t-test, P > 0.2).
In Vivo Hyperspectral Fluorescence Imaging24–26
Twenty-eight mice (129SVE) were used for in vivo hyperspectral fluorescence imaging (Fig. 2). Prior to imaging, a hair trimmer (Chromini Type 1591; Wahl, Sterling, IL) was used to shave the head, neck, abdominal, and forelimb areas.27 Mice were anesthetized through induction of isoflurane for 60 seconds in a chamber and maintenance through an air tube for 3 to 4 minutes during hyperspectral system imaging (Maestro; Cambridge Research & Instrumentation Inc., Woburn, MA). Anesthesia was discontinued after the imaging and mice were placed back in their cage between imaging sessions. The anesthesia was repeated only during the imaging sessions at various time points such as prior to tracer injection, and at 5, 20, 40, 70, 120, and 360 minutes after injection. Mice were monitored throughout the experiment. No abnormal behavior was observed due to anesthesia. The excitation and emission filters were 503 to 555 nm, 580 nm long pass, respectively. The tunable filter was automatically stepped in 10-nm increments from 500 to 800 nm, with exposure time of 900 ms. Image analysis with Maestro 2.4 Imaging Software (Cambridge Research & Instrumentation Inc.), used unmixing algorithms to separate autofluorescence from QD signal.28,29 Green color was set to represent spectra of autofluorescence mainly from melanin27 while red color was set to represent the QD spectrum. Two subjects were excluded from analysis due to hyperspectral imaging equipment (Maestro), computer interface problems (animal ID #16, 17), with four others excluded due to QD leakage from the eye following injection (#24, 25, 28, 29). Time to QD detection was defined as the earliest in vivo detection of QD signal to the neck region after eye injection. QD signal detection rate (60/time to in vivo detection) (hours−1) was calculated to assess lymphatic drainage from the eye.
Figure 2. .

Timeline for IN, TA, IOP measurement, intracameral injection (IC), in vivo hyperspectral imaging (HI), and euthanasia (E).
Tissue Collection and Processing
Mice were killed with CO2 inhalation 6 hours after eye injection. Upper body specimens including head and neck, thorax, and front limbs were dissected and immersion-fixed in 4% paraformaldehyde (Electron Microscopy Sciences, Hatfield, PA) for 48 hours at 4°C. This was followed by cryoprotection by immersion in 10% glycerol (Bioshop, Burlington, ON, Canada) and 2% dimethyl sulfoxide (Fisher Scientific Company, Ottawa, ON, Canada) in 0.1 M phosphate buffer for 4 days, and 20% glycerol and 2% dimethyl sulfoxide in 0.1 M phosphate buffer for 6 days. The skin was removed to eliminate autofluorescence background generated mainly by melanin pigment in hair and skin,27 and upper body specimens were scanned with Maestro for QDs before and after harvesting neck tissue with QD signal to confirm that QD signal was located only in the neck specimen. To orient the neck tissue block, its apex and right side were marked by red and blue surgical pathology ink, respectively (Triangle Biomedical Sciences, Inc., Durham, NC).
Frozen Sections
Neck tissue blocks with QD signals were frozen in isopentane, cooled by dry ice,1 and embedded into cryomatrix resin (Shandon Cryomatrix; Thermo Scientific, Kalamazoo, MI). Blocks were serially sectioned (140-μm thick) using a sliding microtome (Leica DM2400; Leica). Sections were mounted onto double-frosted glass slides (Fisher Scientific Company) with a polyvinyl alcohol antifading mounting medium with DABCO® (1,4-Diazabicyclo[2.2.2]octane; PVA-DABCO, Sigma-Aldrich). Following hyperspectral imaging, sections with QD signal were selected for histological analysis,30 and for QD signal quantification.
QD Signal Quantification in Lymph Node
Serial neck region sections were scanned by hyperspectral imaging equipment (450 ms exposure time; Maestro). Images (696 × 520 pixels) were analyzed in a masked manner to measure QD signal intensity using a morphometry software (Image J 1.43 u; National Institutes of Health, Bethesda, MD). The area and mean gray value of the region with QD signal was measured using lower and upper thresholds of 60 and 255, respectively. QD signal intensity for each mouse was calculated by adding the product of the area and mean gray values in serial sections of left submandibular lymph node with QD signal.
Immunofluorescence and Confocal Microscopy for Lymph Node Architecture
Immunofluorescence staining was performed as previously described at room temperature15 with selected sections washed in PBS (pH 7.4) and incubated for 10 minutes in 0.2% TritonX-100 (Fisher Biotech, Bridgewater, NJ) in PBS, 3% hydrogen peroxide (EMD, Darmstadt, Germany) in PBS for 15 minutes, and in 1% blocking reagent (Tyramide signal amplification (TSA) kit; Invitrogen, Oakville, ON, Canada) in PBS for 1 hour. Sections were incubated in collagen IV antibody (1:100, rabbit polyclonal, Abcam, Inc., Cambridge, MA) with 1% blocking reagent overnight at 4°C, and treated in the dark with a 1:100 dilution of goat antirabbit Alexa Fluor 555 (Invitrogen, Oakville, ON, Canada) for 1 hour in PBS, and incubated for 20 minutes with a 1:1000 dilution of a nuclear staining (Sytox Green; Invitrogen, Eugene, OR). Sections were washed extensively between steps except between incubation of blocking reagent and primary antibody. Sections were cover-slipped with a PVA-DABCO antifade mounting medium. Negative controls were obtained by omitting primary antibody.
Immunofluorescence-labeled sections were viewed with a confocal laser scanning microscope (TCS SL; Leica) and images of 1024 × 1024 pixel resolution were captured. Excitation wavelengths used were 543 and 488 nm for collagen IV and Sytox green nuclear stain, respectively. QD655 was excited with 488 nm, with emission window set at 620 to 680 nm to capture maximum emission spectrum.
Statistical Analysis
Mean QD signal detection rate in latanoprost-treated mice was compared with controls using two-sample t-tests assuming unequal variances. Mean total QD intensity (log scale) in the latanoprost group was compared with the control group using two-sample t-tests assuming equal variances. P values less than 0.05 was considered statistically significant. Statistical analysis was carried out with Microsoft Excel (Version: 14.0.6112.5000; Microsoft Office Professional Plus 2010, Microsoft Corporation, Seattle, WA). Results were graphed with GraphPad Prism (GraphPad Software, Inc., La Jolla, CA).
Results
IOP Decrease in Latanoprost-Treated Mice
Latanoprost-treated left eyes (n = 5) showed a significant difference in mean IOP compared with control left eyes (n = 5) at 2 hours following last instillation (9.1 ± 1.1 mm Hg vs. 14.9 ± 2.4 mm Hg; [Mean ± SD], P < 0.001, two-sample t-test) (Fig. 3). No statistically significant difference was observed at other time points in the left eye and at all time points in the right eyes.
Figure 3. .

Latanoprost-treated left eyes (n = 5, black squares) showed a significant difference in mean IOP compared with control left eyes (n = 5, open circles) at 2 hours following last instillation. *P < 0.001.
In Vivo Hyperspectral Imaging Following Intracameral QD Injection
In the latanoprost-treated group, QD signal in the left neck region was detected in two mice within 20 minutes of QD eye injection (Fig. 4A), and in seven additional mice by 70 minutes (Figs. 4C, 5). Control mice showed no neck signal at 20 minutes (Fig. 4B), 40 minutes, or 70 minutes (Fig. 4D) after QD injection (Fig. 5). By 6 hours, all latanoprost-treated (Fig. 4E) and control mice (Fig. 4F), except #36, showed neck signal (Fig. 5). No QD signal was detected, except at the injection site, using in vivo hyperspectral imaging prior to observation of QD signal in the left submandibular lymph node. QD signal detection rate was increased in the latanoprost-treated group compared with controls (1.23 ± 1.06 hours−1 vs. 0.30 ± 0.17 hours−1, mean ± SD, P < 0.02) (Fig. 6).
Figure 4. .

Following QD injection into the left eye, latanoprost-treated mice showed QD signal (red) in the left neck region (arrow on ventral view) at 20 minutes (A, #20), 70 minutes (C, #43), and 6 hours (E, #39) by in vivo hyperspectral fluorescent images. In controls, QD signal was not detected at 20 minutes (B, #38) or 70 minutes (D, #42) post injection imaging times, but was present at 6 hours (F, #34). Green signal corresponds to background and red to QD signal. Scale, 10 mm.
Figure 5. .

In most latanoprost-treated mice (black squares), QD signal was detected in the neck at earlier post injection times compared with controls (open circles).
Figure 6. .
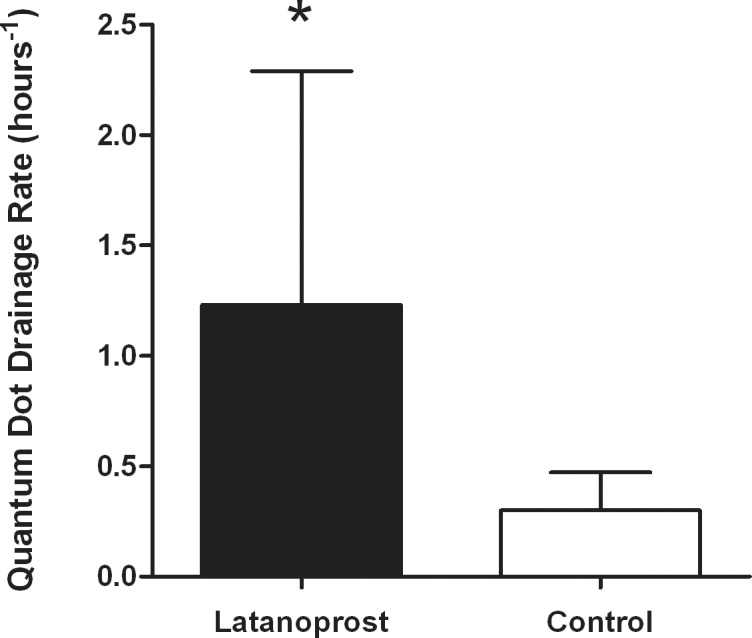
Histogram shows mean and SD of QD drainage rate (hours−1) for latanoprost-treated (black) and control (white) groups. *P < 0.05.
Confocal Microscopy of QD Signal in Immunofluorescence Labeled Submandibular Lymph Node Sections
QDs were detected inside, and beneath the capsule of the left submandibular lymph node in both latanoprost-treated (Fig. 7A) and control (Fig. 7B) mice. Collagen IV immunofluorescence staining outlined the capsule with characteristic bean-shaped morphology of a lymph node (Figs. 7A, 7B) while counterstaining with Sytox green demonstrated lymph node cellular architecture (Figs. 7A, 7B).
Figure 7. .

QDs in red are located in the left submandibular lymph node in both latanoprost-treated mouse (A, #37) and control mouse (B, #23). Both lymph nodes are surrounded by capsule in blue (anticollagen IV) against a green background of cell nuclei (Sytox green). Scale, 250 μm.
QD Signal Intensity in the Left Submandibular Lymph Node
In the left submandibular node, mean total QD intensity was significantly greater in latanoprost-treated mice compared with controls (10.55 ± 1.12 vs. 9.48 ± 1.24, mean ± SD, log scale, two-sample t-test, P < 0.05) (Fig. 8). QD signal was not detected in the right submandibular node in both groups.
Figure 8. .

QD intensities in the left submandibular node in latanoprost-treated and control groups are displayed. Box-plots show the mean (dotted line), median (solid line), 25th, and 75th percentiles (solid line box), and the minimum and maximum intensity (whiskers) for the natural log-transformed total QD intensity gray value measured. *P < 0.05.
Discussion
Here we provide the first evidence that a topical prostaglandin, latanoprost, a widely prescribed glaucoma drug, stimulates lymphatic drainage from the eye. These findings build upon earlier identification of lymphatics in the human and sheep ciliary body,1 and our previous characterization studies of lymphatic outflow to regional lymph nodes.1,2 The results from the current study confirm that intracamerally injected QD655 is drained to the ipsilateral submandibular lymph node15 and are in keeping with optimal retention of QD655 in draining lymph nodes.31 The retention of QDs was further confirmed by postmortem hyperspectral imaging and confocal imaging of lymph node sections that were processed from animals killed 6 hours following tracer injection. Quantification of the total QD intensity from all serial lymph node sections demonstrated significant increase of QD signal in left submandibular lymph node in latanoprost-treated group compared with controls. In addition, the fact that QD signal was not detected elsewhere in both latanoprost-treated and control mice suggests that topical application of latanoprost increases the drainage rate without altering the location of QD drainage.
The increased lymphatic drainage rate from the eye to the lymph node in the latanoprost-treated group provides evidence that latanoprost stimulates lymphatic drainage from the eye. Cellular changes induced by latanoprost may be implicated in this process. Ciliary muscle relaxation,32 by prostaglandin action on Prostaglandin F (FP) receptors32–35 may contribute indirectly to increased ocular lymphatic drainage. Prostaglandins act on lymphatic endothelial and contractile cells surrounding lymphatic channels responsible for the peristaltic movement of lymph.36 Latanoprost remodels extracellular matrix, increasing matrix metalloproteases (MMP), proMMP-1, and proMMP-3,37 while decreasing collagens, fibronectin, laminin, and hyaluronan.38,39 It is unknown whether these cellular changes observed following long term latanoprost treatment, are relevant to increased lymphatic drainage observed in this study.
The increased detection rate of intracamerally injected QDs in the left submandibular lymph node in the latanoprost-treated group compared with controls, suggests that latanoprost may act directly on the lymphatic vessels within the eye.1 In addition to this uveolymphatic “pathway,” fluorescence and light microscopy of coronal serial sections of the left injected eyes showed QDs in the ciliary body, choroid, sclera, and posterior orbit (see Supplemental Fig. S1 (150.4KB, pdf) ) tissue compartments involved in the uveoscleral outflow pathway.40,41 These results confirm that a portion of tracers were drained by the uveoscleral pathway to sclera40 and then to the orbit. It is possible that some of these tracers in the orbit are drained via the orbital lymphatics42–44 to the regional lymph node. Since prostaglandin F2 alpha analogs affect both lymphatic vessels9–11 and uveoscleral drainage,13,14 it may be difficult to separate the component of increased uveoscleral pathway from the direct effect on lymphatics. Future studies using other drugs such atropine,41 that have been shown to increase the uveoscleral pathway via a different mechanism from prostaglandin F2 alpha analogs, or the use of selective drugs that do not affect uveoscleral outflow, but have direct effect on lymphatics may be helpful to pharmacologically dissect out ocular lymphatic drainage from uveoscleral outflow. Better characterization of lymphatics in the eye and in the orbit in mouse and the localization of prostaglandin F2 alpha receptors and other receptors in the lymphatics in the eye and orbit may help to identify new therapeutic targets to modulate lymphatic drainage from the eye.
The hydrodynamic size and intrinsic brightness of QDs provide optimal retention in lymphatic vessels and lymph nodes31 in addition to emit signal that can penetrate up to 2 cm of tissue,26 making this in vivo imaging method very sensitive to changes in lymphatic drainage. The optical resolution of this hyperspectral imaging system, however, restricted in vivo visualization of QDs in trabecular meshwork, uveoscleral pathway, and iris. While localization of QDs in the uveoscleral pathway was demonstrated in coronal orbital sections (see Supplemental Fig. S1), QDs in anterior chamber angle structures such trabecular meshwork and Schlemm's canal that are involved in the conventional pathway could not be assessed, and the use of transverse frozen sections may help to locate QDs in these structures. Without visualizing QDs in the trabecular meshwork, we cannot exclude the possibility that some QDs were drained through the conventional pathway into the venous circulation and be taken up by the liver and spleen.45 However, no QD signal was observed in the liver or spleen from any mice in the latanoprost-treated (n = 11) or control group (n = 11) during in vivo and postmortem imaging performed 6 hours following intracameral injection. It is possible that concentrations of QDs in the spleen and liver were below the detectable threshold by the imaging system used. Further experiments with more sensitive techniques45,46 may be needed to investigate the QDs localization in the liver and spleen following intracameral injection.
Aqueous humor dynamics have been studied in several species,47,48 including the mouse.49 Our observation that an increase in lymphatic drainage rate following latanoprost application matches temporally with a decrease in IOP suggests that enhanced ocular lymphatics may be implicated in the IOP-lowering effect of latanoprost in normal mice.23,49 As mouse aqueous dynamics are similar to humans,16 further investigations in glaucoma mouse models50 will help to determine whether stimulating lymphatic drainage from the eye using latanoprost, is implicated in its IOP lowering effect in glaucoma.
Conclusions
This study demonstrates a previously unknown action of a widely prescribed glaucoma drug, latanoprost on lymphatic drainage from the eye. The finding that latanoprost increases lymphatic outflow, may stimulate the study of compounds that specifically target ocular lymphatic drainage, in an effort to lower pressure and reduce blindness from glaucoma.
Further preclinical studies of in vivo hyperspectral fluorescence imaging following intraocular injection of near-infrared nanotracers, will help our understanding of lymphatic drainage from the eye following pharmacological challenge. This is an ideal platform for future screening studies of drugs that target the ocular lymphatic circulation. Future development of biocompatible tracers and more sensitive hyperspectral imaging methods will enable translation of preclinical findings to clinical trials devoted to the treatment of blinding eye disease.
Acknowledgments
The authors thank Barbara Thomson, MSc for her help with statistical analysis.
Supported by grants from the Canadian Institutes of Health Research (MOP119432), Glaucoma Research Society of Canada, the Dorothy Pitts Fund, the Thor and Nicky Eaton Fund, the Henry Farrugia Research Fund, the Ontario Graduate Scholarship, and the Vision Science Research Program Award.
Disclosure: A.L.C. Tam, None; N. Gupta, None; Z. Zhang, None; Y.H. Yücel, None
References
- 1.Yücel YH, Johnston MG, Ly T, et al. Identification of lymphatics in the ciliary body of the human eye: a novel “uveolymphatic” outflow pathway. Exp Eye Res. 2009;89:810–819. doi: 10.1016/j.exer.2009.08.010. [DOI] [PubMed] [Google Scholar]
- 2.Kim M, Johnston MG, Gupta N, Moore S, Yücel YH. A model to measure lymphatic drainage from the eye. Exp Eye Res. 2011;93:586–591. doi: 10.1016/j.exer.2011.07.006. [DOI] [PubMed] [Google Scholar]
- 3.Resnikoff S, Pascolini D, Etya'ale D, et al. Global data on visual impairment in the year 2002. Bull World Health Organ. 2004;82:844–851. [PMC free article] [PubMed] [Google Scholar]
- 4.Quigley HA, Broman AT. The number of people with glaucoma worldwide in 2010 and 2020. Br J Ophthalmol. 2006;90:262–267. doi: 10.1136/bjo.2005.081224. [DOI] [PMC free article] [PubMed] [Google Scholar]
- 5.van der Valk R, Webers CA, Schouten JS, Zeegers MP, Hendrikse F, Prins MH. Intraocular pressure-lowering effects of all commonly used glaucoma drugs: a meta-analysis of randomized clinical trials. Ophthalmology. 2005;112:1177–1185. doi: 10.1016/j.ophtha.2005.01.042. [DOI] [PubMed] [Google Scholar]
- 6.Alm A, Nilsson SF. Uveoscleral outflow–a review. Exp Eye Res. 2009;88:760–768. doi: 10.1016/j.exer.2008.12.012. [DOI] [PubMed] [Google Scholar]
- 7.Gabelt BT, Kaufman PL. Changes in aqueous humor dynamics with age and glaucoma. Prog Retin Eye Res. 2005;24:612–637. doi: 10.1016/j.preteyeres.2004.10.003. [DOI] [PubMed] [Google Scholar]
- 8.Morgan WH, Yu DY. Surgical management of glaucoma: a review. Clin Experiment Ophthalmol. 2012;40:388–399. doi: 10.1111/j.1442-9071.2012.02769.x. [DOI] [PubMed] [Google Scholar]
- 9.Franzeck UK, Spiegel I, Fischer M, Bortzler C, Stahel HU, Bollinger A. Combined physical therapy for lymphedema evaluated by fluorescence microlymphography and lymph capillary pressure measurements. J Vasc Res. 1997;34:306–311. doi: 10.1159/000159238. [DOI] [PubMed] [Google Scholar]
- 10.Sinzinger H, Oguogho A, Kaliman J. Isoprostane 8-epi-prostaglandin F2 alpha is a potent contractor of human peripheral lymphatics. Lymphology. 1997;30:155–159. [PubMed] [Google Scholar]
- 11.Amann-Vesti BR, Gitzelmann G, Koppensteiner R, Franzeck UK. Isoprostane 8-epi-prostaglandin F2 alpha decreases lymph capillary pressure in patients with primary lymphedema. J Vasc Res. 2003;40:77–82. doi: 10.1159/000068942. [DOI] [PubMed] [Google Scholar]
- 12.Dinslage S, Hueber A, Diestelhorst M, Krieglstein G. The influence of Latanoprost 0.005% on aqueous humor flow and outflow facility in glaucoma patients: a double-masked placebo-controlled clinical study. Graefes Arch Clin Exp Ophthalmol. 2004;242:654–660. doi: 10.1007/s00417-003-0835-1. [DOI] [PubMed] [Google Scholar]
- 13.Wang RF, Gagliuso DJ, Mittag TW, Podos SM. Effect of 15-keto latanoprost on intraocular pressure and aqueous humor dynamics in monkey eyes. Invest Ophthalmol Vis Sci. 2007;48:4143–4147. doi: 10.1167/iovs.07-0035. [DOI] [PubMed] [Google Scholar]
- 14.Kaufman PL, Crawford K. Aqueous humor dynamics: how PGF2 alpha lowers intraocular pressure. Prog Clin Biol Res. 1989;312:387–416. [PubMed] [Google Scholar]
- 15.Tam AL, Gupta N, Zhang Z, Yücel YH. Quantum dots trace lymphatic drainage from the mouse eye. Nanotechnology. 2011;22:425101. doi: 10.1088/0957-4484/22/42/425101. [DOI] [PubMed] [Google Scholar]
- 16.Aihara M, Lindsey JD, Weinreb RN. Aqueous humor dynamics in mice. Invest Ophthalmol Vis Sci. 2003;44:5168–5173. doi: 10.1167/iovs.03-0504. [DOI] [PubMed] [Google Scholar]
- 17.Johnson TV, Fan S, Toris CB. Rebound tonometry in conscious, conditioned mice avoids the acute and profound effects of anesthesia on intraocular pressure. J Ocul Pharmacol Ther. 2008;24:175–185. doi: 10.1089/jop.2007.0114. [DOI] [PubMed] [Google Scholar]
- 18.Morris CA, Crowston JG, Lindsey JD, Danias J, Weinreb RN. Comparison of invasive and non-invasive tonometry in the mouse. Exp Eye Res. 2006;82:1094–1099. doi: 10.1016/j.exer.2005.12.001. [DOI] [PubMed] [Google Scholar]
- 19.Nissirios N, Goldblum D, Rohrer K, Mittag T, Danias J. Noninvasive determination of intraocular pressure (IOP) in nonsedated mice of 5 different inbred strains. J Glaucoma. 2007;16:57–61. doi: 10.1097/IJG.0b013e31802b3547. [DOI] [PubMed] [Google Scholar]
- 20.Pease ME, Hammond JC, Quigley HA. Manometric calibration and comparison of TonoLab and TonoPen tonometers in rats with experimental glaucoma and in normal mice. J Glaucoma. 2006;15:512–519. doi: 10.1097/01.ijg.0000212276.57853.19. [DOI] [PubMed] [Google Scholar]
- 21.Saeki T, Aihara M, Ohashi M, Araie M. The efficacy of TonoLab in detecting physiological and pharmacological changes of mouse intraocular pressure–comparison with TonoPen and microneedle manometery. Curr Eye Res. 2008;33:247–252. doi: 10.1080/02713680801919716. [DOI] [PubMed] [Google Scholar]
- 22.Wang WH, Millar JC, Pang IH, Wax MB, Clark AF. Noninvasive measurement of rodent intraocular pressure with a rebound tonometer. Invest Ophthalmol Vis Sci. 2005;46:4617–4621. doi: 10.1167/iovs.05-0781. [DOI] [PubMed] [Google Scholar]
- 23.Aihara M, Lindsey JD, Weinreb RN. Reduction of intraocular pressure in mouse eyes treated with latanoprost. Invest Ophthalmol Vis Sci. 2002;43:146–150. [PubMed] [Google Scholar]
- 24.Bentolila LA, Ebenstein Y, Weiss S. Quantum dots for in vivo small-animal imaging. J Nucl Med. 2009;50:493–496. doi: 10.2967/jnumed.108.053561. [DOI] [PMC free article] [PubMed] [Google Scholar]
- 25.Zhang J, Su J, Liu L, Huang Y, Mason RP. Evaluation of red CdTe and near infrared CdHgTe quantum dots by fluorescent imaging. J Nanosci Nanotechnol. 2008;8:1155–1159. [PubMed] [Google Scholar]
- 26.Kosaka N, Ogawa M, Sato N, Choyke PL, Kobayashi H. In vivo real-time, multicolor, quantum dot lymphatic imaging. J Invest Dermatol. 2009;129:2818–2822. doi: 10.1038/jid.2009.161. [DOI] [PMC free article] [PubMed] [Google Scholar]
- 27.Mansfield JR, Gossage KW, Hoyt CC, Levenson RM. Autofluorescence removal, multiplexing, and automated analysis methods for in-vivo fluorescence imaging. J Biomed Opt. 2005;10:41207. doi: 10.1117/1.2032458. [DOI] [PubMed] [Google Scholar]
- 28.Mansfield JR, Hoyt CC, Miller PJ, Levenson RM. Distinguished photons: increased contrast with multispectral in vivo fluorescence imaging. Biotechniques. 2005;39:S33–S37. doi: 10.2144/000112093. [DOI] [PubMed] [Google Scholar]
- 29.Mansfield JR. Distinguished photons: a review of in vivo spectral fluorescence imaging in small animals. Curr Pharm Biotechnol. 2010;11:628–638. doi: 10.2174/138920110792246474. [DOI] [PubMed] [Google Scholar]
- 30.Takamasa I, Hiroshi Y, Toshiyuki HA. Color Atlas of Sectional Anatomy of the Mouse. 1 ed. Tokyo, Japan: Adthree Publishing Company Limited;; 2001. [Google Scholar]
- 31.Kobayashi H, Hama Y, Koyama Y, et al. Simultaneous multicolor imaging of five different lymphatic basins using quantum dots. Nano Lett. 2007;7:1711–1716. doi: 10.1021/nl0707003. [DOI] [PubMed] [Google Scholar]
- 32.Poyer JF, Millar C, Kaufman PL. Prostaglandin F2 alpha effects on isolated rhesus monkey ciliary muscle. Invest Ophthalmol Vis Sci. 1995;36:2461–2465. [PubMed] [Google Scholar]
- 33.Chen W, Andom T, Bhattacherjee P, Paterson C. Intracellular calcium mobilization following prostaglandin receptor activation in human ciliary muscle cells. Curr Eye Res. 1997;16:847–853. doi: 10.1076/ceyr.16.8.847.8986. [DOI] [PubMed] [Google Scholar]
- 34.Hutchinson AJ, Coons SC, Chou CL, et al. Induction of angiogenic immediate early genes by activation of FP prostanoid receptors in cultured human ciliary smooth muscle cells. Curr Eye Res. 2010;35:408–418. doi: 10.3109/02713680903581021. [DOI] [PubMed] [Google Scholar]
- 35.Thieme H, Schimmat C, Munzer G, et al. Endothelin antagonism: effects of FP receptor agonists prostaglandin F2alpha and fluprostenol on trabecular meshwork contractility. Invest Ophthalmol Vis Sci. 2006;47:938–945. doi: 10.1167/iovs.05-0527. [DOI] [PubMed] [Google Scholar]
- 36.Zawieja DC, Davis KL, Schuster R, Hinds WM, Granger HJ. Distribution, propagation, and coordination of contractile activity in lymphatics. Am J Physiol. 1993;264:H1283–H1291. doi: 10.1152/ajpheart.1993.264.4.H1283. [DOI] [PubMed] [Google Scholar]
- 37.Lindsey JD, Kashiwagi K, Boyle D, Kashiwagi F, Firestein GS, Weinreb RN. Prostaglandins increase proMMP-1 and proMMP-3 secretion by human ciliary smooth muscle cells. Curr Eye Res. 1996;15:869–875. doi: 10.3109/02713689609017628. [DOI] [PubMed] [Google Scholar]
- 38.Lindsey JD, Kashiwagi K, Kashiwagi F, Weinreb RN. Prostaglandins alter extracellular matrix adjacent to human ciliary muscle cells in vitro. Invest Ophthalmol Vis Sci. 1997;38:2214–2223. [PubMed] [Google Scholar]
- 39.Ocklind A. Effect of latanoprost on the extracellular matrix of the ciliary muscle. A study on cultured cells and tissue sections. Exp Eye Res. 1998;67:179–191. doi: 10.1006/exer.1998.0508. [DOI] [PubMed] [Google Scholar]
- 40.Lindsey JD, Weinreb RN. Identification of the mouse uveoscleral outflow pathway using fluorescent dextran. Invest Ophthalmol Vis Sci. 2002;43:2201–2205. [PubMed] [Google Scholar]
- 41.Bill A, Phillips CI. Uveoscleral drainage of aqueous humour in human eyes. Exp Eye Res. 1971;12:275–281. doi: 10.1016/0014-4835(71)90149-7. [DOI] [PubMed] [Google Scholar]
- 42.Dunne AA, Steinke L, Teymoortash A, Kuropkat C, Folz BJ, Werner JA. The lymphatic system of the major head and neck glands in rats. Otolaryngol Pol. 2004;58:121–130. [PubMed] [Google Scholar]
- 43.Gausas RE, Gonnering RS, Lemke BN, Dortzbach RK, Sherman DD. Identification of human orbital lymphatics. Ophthal Plast Reconstr Surg. 1999;15:252–259. doi: 10.1097/00002341-199907000-00006. [DOI] [PubMed] [Google Scholar]
- 44.Xu H, Chen M, Reid DM, Forrester JV. LYVE-1-positive macrophages are present in normal murine eyes. Invest Ophthalmol Vis Sci. 2007;48:2162–2171. doi: 10.1167/iovs.06-0783. [DOI] [PubMed] [Google Scholar]
- 45.Schipper ML, Cheng Z, Lee SW, et al. microPET-based biodistribution of quantum dots in living mice. J Nucl Med. 2007;48:1511–1518. doi: 10.2967/jnumed.107.040071. [DOI] [PMC free article] [PubMed] [Google Scholar]
- 46.Wang T, Hsieh H, Hsieh Y, Chiang C, Sun Y, Wang C. The in vivo biodistribution and fate of CdSe quantum dots in the murine model: a laser ablation inductively coupled plasma mass spectrometry study. Anal Bioanal Chem. 2012;404:3025–3036. doi: 10.1007/s00216-012-6417-5. [DOI] [PubMed] [Google Scholar]
- 47.Husain S, Whitlock NA, Rice DS, Crosson CE. Effects of latanoprost on rodent intraocular pressure. Exp Eye Res. 2006;83:1453–1458. doi: 10.1016/j.exer.2006.08.004. [DOI] [PubMed] [Google Scholar]
- 48.Toris CB, Risma JM, Gonzales-Martinez J, McLaughlin MA, Dawson WW. Aqueous humor dynamics in inbred rhesus monkeys with naturally occurring ocular hypertension. Exp Eye Res. 2010;91:860–865. doi: 10.1016/j.exer.2010.09.011. [DOI] [PubMed] [Google Scholar]
- 49.Crowston JG, Aihara M, Lindsey JD, Weinreb RN. Effect of latanoprost on outflow facility in the mouse. Invest Ophthalmol Vis Sci. 2004;45:2240–2245. doi: 10.1167/iovs.03-0990. [DOI] [PubMed] [Google Scholar]
- 50.Aihara M, Lindsey JD, Weinreb RN. Experimental mouse ocular hypertension: establishment of the model. Invest Ophthalmol Vis Sci. 2003;44:4314–4320. doi: 10.1167/iovs.03-0137. [DOI] [PubMed] [Google Scholar]