

Abstract
Quantitative measurement of the major regulatory proteins in signaling networks poses several technical challenges, including low abundance, the presence of post-translational modifications (PTMs), and the lack of suitable affinity detection reagents. Using the innate immune response (IIR) as a model signaling pathway, we illustrate the approach of stable isotopic dilution (SID)-selected reaction monitoring (SRM)-mass spectrometry (MS) assays for quantification of low abundance signaling proteins. A work flow for SID-SRM-MS assay development is established for proteins with experimentally observed MS spectra and for those without. Using the interferon response factor (IRF)-3 transcription factor as an example, we illustrate the steps in high responding signature peptide identification, SID-SRM-MS assay optimization, and evaluation. SRM assays for normalization of IIR abundance to invariant housekeeping proteins are presented. We provide an example of SID-SRM assay development for post-translational modification (PTM) detection using an activating phospho-Ser modified NF-κB/RelA transcription factor, and describe challenges inherent in PTM-SID-SRM-MS assay development. Application of highly qualified quantitative, SID-SRM-MS assays will enable a systems-level approach to understanding the dynamics and kinetics of signaling in host cells, such as the IIR.
Keywords: Selected Reaction Monitoring, Innate Immune Response, Stable Isotopic Dilution, Interferon Response Factor (IRF), Nuclear Factor-κB (NF-κB), Post Translational Modification
1. Introduction
The innate immune response (IIR) is the major host cellular response pathway rapidly triggered when invading microorganisms are identified, cell damage is incurred and/or intracellular stress alarms are triggered. The IIR is composed of inducible intracellular protein-protein interaction networks whose association is mediated by specific post-translational modifications (PTMs). The IIR is triggered by pathogen recognition receptors (PRRs), including the plasma membrane Toll-like receptors and the cytoplasmic RIG-I-like RNA helicases, that are activated upon binding pathogen-associated molecular patterns. This event triggers a downstream intracellular signaling cascade leading to serine kinase and and ubiquitin ligase activity that produces protein complex formation, proteolysis of inhibitory proteins and nuclear translocation of transcriptional effectors [1]. The endpoint of this signaling cascade is the post-translational modification the nuclear factor-κB (NF-κB), IFN regulatory factor (IRF), and signal transducer and activator of transcription (STAT) transcription factors, that, in turn, activate the expression of inflammatory cytokine genes, such as TNF-β, IL-6, IL-1β, and IL-12, and type I interferons [2]. Presently, we understand that the IIR is dynamic and may vary in response to different cues and fluctuate over time following stimulation.
Understanding the IIR at the systems level will result in novel insight into the mechanisms underlying host defense, pathogen-host interaction, and the cell stress-response. However, this understanding is an extremely challenging task [3;4]. First, the major regulatory components of the IIR, consisting of PRRs, kinases and transcription factors, are all low-abundance proteins. Second, the pathogen-inducible PTMs are labile, and usually present at sub-stoichiometric amounts, and few high affinity detection reagents are available that can detect them in complex cellular samples. Finally, identifying the dynamic nature of the IIR requires precise quantification of each component and its PTMs over time. Traditional immunoassays such as Western blotting are not suitable for precise quantification. To overcome these challenges, high-accuracy, high-sensitivity multiplex assays are required.
Advances in mass spectrometry (MS) technologies are an enabling tool that has enhanced our understanding of signaling networks at the systems level. Although classical ‘shot-gun’ proteomics combined with stable isotope labeling and/or spectral counting has been used for proteomic analysis [5–9], this approach is limited by the fact that it only samples a fraction of the proteome and is usually biased towards the higher end of the abundance scale. The confidence of quantification of low-abundance proteins in case and control states is decreased because low-abundance proteins in a complex proteome are usually quantified by fewer peptides [10;11]. Recently, selected reaction monitoring (SRM; plural, MRM, multiple reaction monitoring) has been developed as a new ‘targeted’ MS approach for the detection and accurate quantification of a predetermined set of proteins in a complex background [12–14]. Specifically, SRM-MS has been used for studying the dynamics of signaling pathways [15;16]. In a SRM-MS assay, one or two signature proteotypic peptides which are unique to the protein of interest are selected to stoichiometrically represent the protein. SRM-MS analysis of these signature peptides are performed on a triple quadrupole mass spectrometer (QQQ-MS), an instrument with the capability to selectively isolate precursor ions corresponding to the m/z of the signature peptides and to selectively monitor peptide-specific fragment ions (the combination of m/z of precursor ion and its product ions are called precursor-product ion transitions). SRM-MS assay can be thought of as the MS equivalent of the traditional Western blot, in that specific proteins are targeted and quantified. However, SRM assays do not require the generation of high affinity antibodies, and yet have lower limit of detection to pg/ml protein concentrations. In addition, SRM assays offer several attractive features. First, because only preselected precursor-product ion transitions are monitored in SRM mode, the noise level is significantly reduced and thereby SRM assays decrease the lower detection limit for peptides by up to 100-fold in comparison to a conventional full scan MS/MS analysis. Second, if the precursor-product ion transition of one proteotypic peptide is unique to the protein of origin, it is not only distinguishable from other MS signals in one LC run, but it is a characteristic signature for the protein of interest. Therefore, two filtering stages in SRM mode result in near-absolute structural specificity for the target protein. Third, SRM-MS in combination with stable-isotope dilution (SID) is so far the most accurate approach for direct quantification of target proteins in a complex mixture [12].
An example SID-SRM-MS experiment is shown in Figure 1. Here, a signature peptide is selected that uniquely represents the target protein. A stable isotope standard (SIS) is synthesized; this SIS is a 13C- and/or 15N- labeled peptide with the exact amino acid sequence that would be produced by the native protein during proteolysis. The SIS and native peptides have identical physicochemical properties including chromatographic co-elution, ionization efficiency, and relative patterns of fragment ions, but are differentially detected by a mass spectrometer due to their 10-Da mass difference. Next, a known amount of the SIS peptide is spiked into the sample and analyzed in a LC-SRM-MS experiment. By comparing the MS response of both native and SIS peptide, the amount of target protein in the sample can be quantified. SID-SRM-MS assays have multiplexing capability. Hundreds to thousands of precursor-product ion transitions can be monitored in SRM mode over one LC run, allowing for the simultaneous quantification of all of the components in a signaling network in parallel.
Figure 1.

General scheme for stable isotope dilution-selected reaction monitoring-mass spectrometry (SID-SRM-MS) assay.
This manuscript describes methods for developing SRM assays for quantification of the components of the innate immune pathways. A work flow of selection of high-responding signature peptides, optimization and validation of SRM assay has been developed. This workflow enables the rapid and parallel assessment of the optimal configuration of SRM assays and can be used for any given target protein. We also describe some considerations in developing SRM assays for target PTMs.
2. Description of methods
The method for SRM assay development is diagrammed in Figure 2. (i) For each target protein, 3–5 high-responding signature peptide candidates are selected. This selection can be based on LC-MS/MS data from prior discovery experiments, empirical data in public proteomics repository databases, and/or computational prediction. (ii) Stable isotope-labeled peptide candidates are synthesized in a crude and unpurified form. (iii) A mixture consisting of the synthetic peptides is directly infused into a triple quadrupole mass spectrometer (QQQ-MS) to test the optimal fragmentation condition for each transition and extract the most favorable precursor-product ion transitions. (iv) Three to five most favorable precursor-product ion transitions are selected for each signature peptide. (v) The mixture of synthesized peptides is spiked in a tryptic digest of a cell extract to validate the detectability and specificity of native peptides. The peptide with best sensitivity and specificity will be selected as the high-responding signature peptide of the target protein. (vi) The light and heavy forms of the selected high-responding signature peptides are then chemically synthesized. Peptide purity, accuracy of concentration and isotopic purity are stringent requirements for assay performance. (vii) The sensitivity and linear dynamic range of the assay is then evaluated using the standard addition approach. (viii) The optimized and validated SID-SRM assays can then be used to detect and quantify the target proteins in a cell extract. We will use the development of an SID-SRM assay for Interferon Regulatory Factor 3 (IRF3) as a practical example to demonstrate the workflow for assay development. But it should be kept in mind that this workflow can be used for simultaneously developing SRM assays for multiple proteins.
Figure 2. Work flow of development of SID-SRM-MS assay for target proteins.

This approach has four major components: selection and validation of high-responding signature peptides for target proteins; selection and optimization of precursor-product ion transitions; generation of stable isotope labeled internal standard; and evaluation of assay performance.
2.1 Selection of high-responding signature peptide
The major challenge (and time-consuming part) of SRM assay development is deciding which of the multiple potential proteotypic peptides should be chosen as signature peptides to stoichiometrically represent the protein of interest. High-responding signature peptides are a subset of proteotypic peptides that produce the highest MS response and therefore will result in SRM assays with the best detection sensitivity. In some cases, if a lab-based discovery experiment has been conducted on the target protein, the LC-MS/MS data is very useful for developing the SRM assay. The MS response of sequence-identified proteotypic peptides of the target proteins can be calculated from the extracted ion chromatogram of the monoisotopic peak of each peptide. The peptides with the highest MS response are selected as the high-responding signature peptides [17–20]. This empirical method is effective for high-abundance proteins or purified proteins, but not so for low-abundance proteins. Acquisition of reliable MS/MS spectra of proteotypic peptides of low-abundance proteins in biological samples is compromised by complex backgrounds. For the majority of the components of the IIR such as IRF3, lab-based LC-MS/MS data are usually not available. The alternative approaches are utilizing the information collected empirically in public proteomics repository databases and/or computational prediction tools (Figure 2).
The MS/MS spectra of proteotypic peptides generated by laboratories world-wide have been collected empirically in public proteomics repository databases, such as PeptideAtlas (http://www.peptideatlas.org), Global Proteome Machine Database (GPMDB) (http://gpmdb.thegpm.org), the Public Repository of Protein and Peptide Identifications (PRIDE) (http://www.ebi.ac.uk/pride), and Genome Annotating Proteome Pipeline (GAPP) (http://www.gapp.info/) [21–24]. The information in these databases has been successfully used for selecting high-responding signature peptides [25–27]. In this approach, the MS response of each peptide is determined by the number of peptide observations instead of the precursor ion intensity because the precursor ion intensities are often not stored in these databases. The most frequently observed peptides are considered to be the high-responding signature peptides. A computer program, X! Tandem PPP Hunter [25], is available on the GPMDB website to mine the repository databases for the selection of high-responding peptides. This approach is cost-efficient and does not require any additional experimentation. However, only a fraction of peptides present in a complex sample are detected in global proteomic experiments. Therefore, the best signature peptides may not have been collected in the public proteome repository databases. This is especially true for low-abundance proteins which are usually less well-represented in repositories.
Several computational approaches have emerged to predict the LC-MS detectability of proteotypic peptides. One program that we have used is the enhanced signature peptide (ESP) predictor (http://genepattern.broadinstitute.org/gp/pages/index.jsf) [28]. This web-based computational tool predicts high-responding peptides for a given protein in an electrospray mass spectrometry experiment with reasonable accuracy. Other web-based prediction programs such as SRMAtlas (http://www.srmatlas.org/) [29] and MRMaid (http://www.mrmaid.info/) [30] can also be used for predicting high responding signature peptides. We recommend running these programs together and creating a rank-ordered, weighted list of the combined predictions. The top-ranked peptides from two or more programs have the highest probability of being high-responding signature peptides. However, it should be noted that the LC-MS response of precursor ions does not correlate perfectly with the signal intensity in SRM experiments. Even with similar MS response of precursor ions, short peptides with a few predominant fragments will generate more intense SRM signals in comparison to a larger peptide with many fragments of similar intensities [13]. Therefore, despite this advance, computational prediction is rarely perfect. Successfully predicting high-responding signature peptides does not eliminate the need for subsequent validation and optimization, as some peptides may fail due to poor chromatographic properties, solubility problems, or matrix interference.
In the case of IRF3, a low-abundance transcription factor, no LC-MS/MS data have been observed in our laboratory’s experiments. To develop an accurate and robust SRM assay for IRF3, we combined data-mining in public proteomics repository databases and computational prediction to select the high-responding signature peptide candidates (Figure 2). This was then followed by assay optimization and validation.
IRF3 was digested in silico with trypsin using the web-based program PeptideMass (http://web.expasy.org/peptide_mass). Other commercial software such as Thermo Scientific Pinpoint™ can also be used.
-
The tryptic peptides were filtered by applying the criteria below:
The proteotypic peptides should be unique to the target protein.
The proteotypic peptides should generally be between 6 and 25 residues long;
There should be no missed cleavages. Peptides containing Lys (K)-Pro (P) and Arg (R)-P should also be excluded because it was recently found that “Keil rules” [31] (trypsin cleaves next to R or K, but not before P) is only partially correct [32].
Peptides with chemically active amino acid residues (such as Cys or Met) should be excluded.
Peptides with two neighboring basic amino acid (K,R) at either cleavage site of the peptide sequence should be excluded [13].
Peptides with known PTMs should be excluded (if the SRM is to detect total protein abundance).
In the IRF3 example, out of 39 in silico-digested tryptic peptides, eight passed these initial filters (Table 1) and were further selected.
The number of peptide observations in LC MS-MS experiments collected in public proteomics repository was then identified using the GPMDB website (http://gpmdb.thegpm.org/seq.html). The IRF3 peptides filtered in step 2 were used to search the database. To do this, query peptides were submitted into the “Search by the sequence” form, and the “view match” button was selected. All entries in GPMDB that have the exact IRF3 peptide sequence were found and the number of the observations of that sequence in the database was displayed.
The highest sensitivity peptides were identified using computational prediction by the the EPS predictor (http://genepattern.broadinstitute.org/gp/pages/index.jsf) (Note that the EPS predictor is for registered users only). The text file containing the eight IRF3 sequences was uploaded. After the calculation is finished, a file containing the prediction score for each peptide can be downloaded.
To identify peptide chromatographic behavior on the reverse phase column, we used Thermo Scientific Pinpoint™ software to calculate the Krokhin hydrophobicity factor.
The combined results of these analyses is shown in Table 1. Using this analysis, we eliminated the peptides that had a: (i) low ESP score, (ii) low number of GPMDB observations, and/or (iii) extremely low (<10) or high (<40) Krokhin hydrophobicity factor. As a result, peptides #1 to #5 were excluded from further consideration.
We next excluded peptides that have known post-translational modifications. Based on the GPMDB search, Ser (S) 173 on the peptide 173SPSLDNPTPFPNLGPSENPLK193 is phosphorylated. Hence SPSLDNPTPFPNLGPSENPLK was eliminated from the candidate list. The remaining peptides, LVGSEVGDR and AGQWLWAQR, were considered IRF3 candidate signature peptides.
Table 1.
The proteotypic peptides of IRF3.
| Sequence | No. of Amino Acid | ESP Prediction Probability | No. of GPMDB Observation | Krokhin Hydrophobicity Factor | |
|---|---|---|---|---|---|
| 1 | ILPWLVSQLDLGQLEGVAWVNK | 22 | 0.03162 | 38 | 65.095 |
| 2 | EGGVFDLGPFIVDLITFTEGSGR | 23 | 0.04864 | 31 | 63.581 |
| 3 | LLVPGEEWEFEVTAFYR | 17 | 0.0504 | 50 | 54.279 |
| 4 | DPHDPHK | 7 | 0.17734 | 1 | 2.402 |
| 5 | QDAQQEDFGIFQAWAEATGAYVPGR | 25 | 0.2145 | 3 | 49.382 |
| 6 | AGQWLWAQR | 9 | 0.37042 | 20 | 33.098 |
| 7 | SPSLDNPTPFPNLGPSENPLK | 21 | 0.49316 | 206 | 40.346 |
| 8 | LVGSEVGDR | 9 | 0.75866 | 59 | 14.704 |
2.2 Development and Optimization of SRM assays of IRF3
The intensities of individual fragments derived from one precursor ion differ substantially. Selection of the most intense fragments for each signature peptide is essential for developing a high-sensitivity SRM assay. The selection of fragment ions can be on the basis of MS/MS spectra of the peptide, where the highest intensity fragment ions in MS/MS are often selected to maximize the detection sensitivity. Major QQQ-MS instrument manufacturers have created software such as Pinpoint™ (Thermo Scientific), MRMpilot™ (Applied Biosystems), QuanOptimise™ (Waters), and MassHunter Optimiser™ (Agilent), to facilitate the selection of potential SRM transitions.
We synthesized LVGSEVGD[Arg(13C6;15N4)] and AGQWLWAQ[Arg(13C6;15N4)] in crude and unpurified form. This was commercially done by companies such as Thermo Scientific or Sigma-Aldrich (about $50 per peptide).
We mixed equal volume of the two peptide solutions. The sample is then 100-fold diluted with 50% ACN and directly infused into a TSQ Vantage mass spectrometer through a nanospray source. The MS/MS spectra of LVGSEVGD[Arg(13C6;15N4)] (precursor m/z 471.246) was acquired (Figure 3A) and that for AGQWLWAQ[Arg(13C6;15N4)] (precursor m/z 563.291) (data not shown). The most intense y or b ions were selected. We typically exclude low m/z fragment ions, such as y1–y3 ions or immonium ions, because they usually have low SRM specificity.
We next optimized the collision energy (CE) for each SRM transition. In this example, the peptide LVGSEVGD[Arg(13C6;15N4)] was analyzed. The CE breakdown curves of SRM transitions of m/z 471.246→456.235, 471.246→585.278, 471.246→729.331 were examined to select the optimal CE for each transition (Figure 2B).
We optimized the CE for the remaining peptides. The CE breakdown curves for the AGQWLWAQ[Arg(13C6;15N4)] was next performed.
Figure 3. Selection and optimization of SRM transitions.
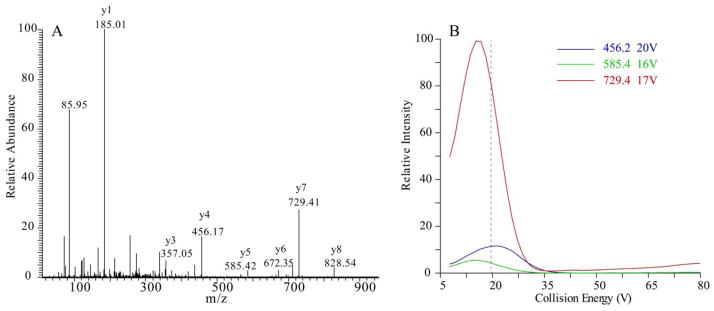
(A) MS/MS spectrum of IRF3 peptide LVGSEVGD[Arg(13C6; 15N4)]. (B) Breakdown curve of three y ions versus collision energy of the peptides LVGSEVGD[Arg(13C6; 15N4)]. The vertical dashed line represents the calculated collision energy voltage using a generic formula (CE = 0.034 x (precursor ion m/z) + 3.314). Note that the experimentally derived collision energies give increased sensitivity over those determined by the generic formula.
2.3 Validation of SRM assays of IRF3
2.3.1 Validation of SRM assay specificity
High specificity is an important feature of SRM assays. A transition that is shared by other analytes can potentially lead to a false positive peak assignment and thereby quantification inaccuracy. Once the SRM assays have been developed and optimized, the specificity of the assays should be evaluated on a real sample such as a cell extract. With the use of crude heavy peptides as internal standards, the specificity and accuracy of SRM assays in highly complex samples can be validated by manual examination of the raw data [33]. Native peptides and their heavy analogs have identical chromatographic retention time because of their physiochemical similarities. Under the same CE and collision-activated dissociation (CID) pressure, the native and the heavy peptide dissociate to generate the same pattern of product ions, which differ only by m/z (reflecting addition of the stable isotope-labeled amino acids) and absolute intensity. Importantly, the relative intensities of the complement of product ions formed by each native peptide and its heavy analog are nearly identical. To test specificity in complex mixtures, we performed the following steps:
A cytoplasmic extract of A549 cells was digested with trypsin as described previously [34].
About 10 μg of the tryptic digest was aliquoted. This sample was then spiked with the crude LVGSEVGD[Arg(13C6;15N4)] and AGQWLWAQ[Arg(13C6;15N4)] peptides.
An LC-SRM-MS analysis of native and stable isotope-labeled LVGSEVGDR and AGQWLWAQ was performed with a TSQ Vantage QQQ-MS equipped with a nanospray source (ThermoFinnigan, San Jose, CA). The online desalting and chromatography was first performed using an Eksigent NanoLC-2D HPLC system (AB SCIEX, Dublin, CA). To perform this, a 5 μg (10 μL) aliquot of the tryptic digests was injected on a C18 peptide trap (Agilent, Santa Clara, CA) and desalted with 0.1 % formic acid at a flow rate of 2 μL/min for 45 min. Peptides were eluted from the trap and separated on a reverse-phase nano-HPLC column (PicoFrit™, 75 μm × 10 cm; tip ID 15 μm) packed in house using Zorbax SB-C18 (5-μm diameter particles, Agilent, Santa Clara, CA). Separations were performed using a flow rate of 500 nL/min with a 20-min linear gradient from 2–40% mobile phase B (0.1 % formic acid-90 % acetonitrile) in mobile phase A (0.1 % formic acid), followed by 0.1-min gradient from 40–90% mobile phase B and 5-min 90% mobile phase B. The TSQ Vantage mass spectrometer was operated in high-resolution SRM mode (h-SRM) with Q1 and Q3 set to 0.2 and 0.7-Da Full Width Half Maximum. All acquisition methods used the following parameters: 1800 V ion spray voltage, a 275 °C ion transferring tube temperature, a CID pressure at 1.5 mTorr, the CE of each transition used the optimal voltage and the S-lens voltage used the values in the S-lens table generated during MS calibration.
The extract ion chromatograms and SRM spectra of native- and stable isotope-labeled LVGSEVGDR and AGQWLWAQR peptides were then manually examined (Figure 4A–H). Four analyte-specific criteria — precursor ion m/z, product ion m/z, chromatographic retention time and the relative product ion intensities, were used for evaluating the specificity of SRM assay and the certainty of peak assignment [34]. The native peptides and their heavy analogs should have the same chromatographic retention time (variance below 0.05 min) and relative product ion intensities (± 20% variance in the relative ratios for each fragment). As shown in Figure 4A, baseline separation of the native and heavy peptide LVGSEVGDR from the matrix interference was achieved. The native LVGSEVGDR peptide has nearly identical chromatographic retention time as its heavy analog (Figure 4A, C). Note that the relative intensities of the product ions of the native peptide at 446.23, 575.28, and 719.33 maintain a constant relationship with one another (Figure 4B). Furthermore, the relative product ion intensities of the native peptide LVGSEVGDR agree precisely with the intensities of the product ions from the heavy peptide (Figure 4B, D). By contrast, the native peptide AGQWLWAQR cannot achieve the baseline separation from other coeluting analytes. The inference of other coeluting analytes is also reflected by the altered SRM profile of the native AGQWLWAQR peptide in comparison with its heavy peptide. This validation exercise indicates that LVGSEVGDR has better specificity than AGQWLWAQR and can be used as the signature peptide for quantification of IRF3 in complex cell extracts.
The specific, high-responding signature peptide, LVGSEVGDR, is then commercially synthesized as a stable isotope labeled peptide (LVGSEVGD[Arg(13C6;15N4)]) and separately as a non-labeled control peptide with its native flanking sequences (GLR-LVGSEVGDR-TLP). The concentration precision of each peptide should be equal or better than ±25%, the peptide purity should be higher than 97% and the isotopic enrichment should be higher than 99%. The high-quality stable isotope labeled peptide (LVGSEVGD[Arg(13C6;15N4)]) will be used as the stable-isotope labeled standard (SIS) for SRM assay of IRF3.
Figure 4. Validation of SRM assays of IRF3.

IRF3 was measured in crude cytoplasmic extract prepared from A549 cells. (A) Extract ion chromatogram of IRF3 native peptide LVGSEVGDR; (B) SRM spectrum of LVGSEVGDR; (C) Extract ion chromatogram of IRF3 heavy peptide LVGSEVGD[Arg(13C6; 15N4)]; (D) SRM spectrum of LVGSEVGD[Arg(13C6; 15N4)]; (E) Extract ion chromatogram of IRF3 native peptide AGQWLWAQR; (F) SRM spectrum of AGQWLWAQR; (G) Extract ion chromatogram of IRF3 heavy peptide AGQWLWAQ[Arg(13C6; 15N4)]; (H) SRM spectrum of AGQWLWAQ[Arg(13C6; 15N4)]. Abbreviations: RT, retention time; AA, peak area; SN, signal-to-noise ratio.
2.3.2 Linear Response and limit of SRM Quantification of IRF3
The assay dynamic range, representing the concentration range between the lower to upper limits of quantification (LLOQ to ULOQ), is the range where protein concentration is measurable with acceptable levels of accuracy and precision. The assay dynamic range can be assessed by the method of standard addition [34–37]. In this method, serial dilutions of target proteins with a fixed amount of SIS peptide are spiked into the similar matrix to the neat specimen and trypsinized. A calibration curve of the SRM response of non-labeled native peptide verse the concentration of target protein is generated. This calibration curve is central to the design, validation, and application of SRM assays. Calibration curves prepared from heterogeneous, impure, and/or poorly characterized calibrators are more likely to yield inaccuracy and higher variability. In the case that a purified, well-characterized, and quantified protein of interest is not available, we developed an alternative approach by using a non-labeled signature peptide with its native sequences flanking its tryptic cleavage sites as the calibrator to prepare the calibration curve [34].
The non-labeled control peptide with its native flanking sequences (GLR-LVGSEVGDR-TLP) was digested with trypsin.
The tryptic digest was diluted to generate a range of analyte concentrations spanning a 100,000-fold concentration range (0.05, 0.25, 0.5, 1.25, 2.5, 12.5, 25, 50, 125, 250, 500, 1250, 2500 and 5000 fmol loaded onto the column).
A constant amount of SIS peptide LVGSEVGD[Arg(13C6;15N4)] (50 fmol loaded onto the column) was spiked into each solution.
Four replicates LC-SRM-MS analysis for each dilution were performed in the order from the most diluted to the most concentrated. The LC-SRM-MS protocol is the same as described in section 2.3.1.
The linear regression analysis on the observed peak area ratios (native:heavy) versus concentration ratios was performed to generate calibration curves. As shown in the Figure 5, the SRM assay yields linear responses over a >100,000-fold concentration range with a strong linear correlation (r > 0.9998).
The coefficient of variation (CV) of four replicates LC-SRM-MS analysis for each dilution was calculated to establish the reproducibility level of each analyte concentration.
The LLOQ of SRM assay, the lowest analyte quantity that can be accurately measured, is the measurement of the sensitivity of the assay. The LLOQ of the SRM assay can be defined as the lowest analyte concentration that could be measured with < 20% CV [38;39]. In our study, the lowest native IRF3 peptide concentration that can be quantified was 200 attomole (signal-to-noise ratio of 85, 10.2% CV), a value representing the LLOQ of the IRF3 SRM assay.
Figure 5. Calibration curve for IRF3 SID-SRM assay.

The linear regression analysis (1/x weighted) for IRF3 illustrates the linear dynamic range of the assay. The error bars indicate standard deviation of the measurements.
2.4 Quantitative measurement of IRF3
To illustrate the ability to measure perturbations that affect IRF3 abundance, we examined the effect of siRNA knockdown of deubiquitinating enzyme A (DUBA). DUBA is a negative regulator of IRF3 signaling. DUBA-specific siRNA was reverse- transfected into A549 cells using TransIT-siQUEST transfection reagent (Mirus Bio Corp) as described. Transfection was performed 64 h before dsRNA stimulation [40].
After siRNA knockdown, cells were transfected with double stranded-RNA (ds-RNA) for 0 min, 30 min, 1 h, 2 h, and 4 h as described [40;41].
The nuclear proteins were extracted and digested with trypsin as described previously [34].
About 10 μg of the tryptic digest was aliquoted. This sample was then spiked with the 100 fmol of IRF3 SIS peptide LVGSEVGD[Arg(13C6;15N4)] and beta-actin SIS peptide AVFPSIVG Arg(13C6;15N4)].
An LC-SRM-MS analysis of native and stable isotope-labeled LVGSEVGDR and AVFPSIVGR was performed as described in Section 2.3.1.
The data analysis of SRM spectra of native- and stable isotope-labeled LVGSEVGDR and AGQWLWAQR peptides were performed as described in Section 2.3.1. The ratios of native to SIS-peptide for both IRF3 and beta-actin were calculated for each sample. Then the ratio of native verse SIS-peptide of IRF3 of each sample was normalized with beta-actin. As shown in Figure 6, the SID-SRM-MS analysis reveals that after stimulation of ds-RNA for 1h, IRF3 rapidly translocated into nucleus and reached a peak value (5.3-fold change compared with basal level) within 2 h. The amount of nuclear IRF3 started to decline thereafter.
Figure 6. Quantitative analysis of IRF3 nuclear translocation by SID-SRM-MS.

The A549 cells that were transfected with DUBA siRNA were stimulated with ds RNA for varying times (0, 0.5, 1, 2 and 4 h). The amount of IRF3 in the nucleus were quantified with SID-SRM-MS.
2.5 Considerations of application of SRM assays
2.5.1 Accuracy of SRM quantification
Precise SIS peptide concentration. Accurate SRM quantification critically depends on knowing the precise concentration of the SIS peptide. Typically commercial peptide synthesis facilities provide high-quality SIS peptides as either lyophilized, trifluoracetic salts or as fully solubilized solutions. Although the lyophilized peptide is in a form that is more stable for long-term storage, the fully solubilized peptide in solution is preferred for SRM quantification because its precise concentration is determined by amino acid analysis (AAA) in the same solution by the provider. A major drawback of lyophilized SIS peptides is that the precision of the concentration of SIS could vary during the re-solubilization process. Although the lyophilized SIS peptides are quantified by the provider using AAA, complete re-solubilization of the peptide cannot be assumed [42]. Subsequent re-quantification of the re-solubilized peptide would require significant consumption for the AAA analysis, and for this reason, we do not recommend this process.
We prepare the SIS peptide solution as single-use aliquots with medium to high concentration (>1pmol/μL, the lower the concentration, the less stable) and store them immediately at −80 °C. Peptide solutions, once thawed, should be used immediately or kept on ice until usage. Repeated thawing and freezing must be avoided in order to ensure the precise SIS peptide concentration.
Inaccurate and imprecise transitions in SRM quantification. In SRM-MS assays, interference and ion suppression effects can be compensated for by the use of SID “spike-in”. But the SID spike-in method itself does not guarantee either specificity or quantitative accuracy. Therefore, the specificity and accuracy of SRM assay of peptides in highly complex samples is usually required to be validated by manual examination of the raw data [33]. Multiplex SRM quantification of all of the components in a signaling network requires the ability to analyze tens to over one hundred target proteins. Manual inspection of raw data is a tedious and time consuming process, and is prone to subjective errors. Recently, computer algorithms such as automated detection of inaccurate and imprecise transition (AuDIT) [43] and the probabilistic scoring algorithm, mProphet [44], have been developed for automatically evaluating SRM data and computing accurate error rates for the identification of targeted peptides in SRM data sets. These algorithms can not only reduce the time required for manual and subjective inspection of data, but improve the overall accuracy of data analysis.
2.5.2 Sample normalization
SRM quantification yields precise quantitative values for the protein abundances in a protein extract. To be able to draw conclusions about dynamics of IIR pathways from a set of protein extracts, methods to control for sample to sample variations in protein recovery should be considered. The SRM quantification workflow for different samples typically are often normalized based on the total protein amount using qualitative protein determinations based on Lowry, Bradford or bicinchoninic acid protein assays. This approach creates the paradoxical situation that highly accurate SRM assays have to be normalized by less accurate total protein measurements. An alternative, more accurate, approach is to normalize the samples on the basis of SRM measured invariant “housekeeping” proteins, proteins expected to be in constant concentrations throughout the experiment. These proteins are included in the multiplex SRM assays and are quantified together with the target protein set. Normalization on the invariant protein concentration is performed after acquisition during the data analysis and usually yields more reliable data [13;34]. Good candidates for normalization are abundant “housekeeping” proteins such as beta-actin, beta-tubulin, lamin B, and histone proteins. These proteins have long been established as the loading control in traditional biochemical assays such as Western blotting. SRM-MS assays of these proteins have been developed and tabulated in Table 2.
Table 2.
SRM parameters of SRM assays of proteins for sample amount normalization. Masses listed are for the native forms of the peptides.
| Protein Name | Accession No. | Normalization for | Sequence | Q1 m/z | Q3 m/z | CE (V) | Ion type |
|---|---|---|---|---|---|---|---|
|
| |||||||
| ACTB | P60709 | Total cell lysate Cytoplasmic extract Nuclear extract |
AVFPSIVGR | 473.279 | 531.324 | 19 | y5 |
| 473.279 | 628.377 | 19 | y6 | ||||
| 473.279 | 775.446 | 19 | y7 | ||||
| 473.279 | 874.514 | 19 | y8 | ||||
| TBB1 | Q9H4B7 | Total cell lysate Cytoplasmic extract |
FPGQLNADLR | 565.8013 | 701.3935 | 23 | y6 |
| 565.8013 | 829.4521 | 23 | y7 | ||||
| 565.8013 | 886.4736 | 23 | y8 | ||||
| 565.8013 | 983.5263 | 23 | y9 | ||||
| LMNB1 | P20700 | Nuclear extract | ALYETELADAR | 626.314 | 674.346 | 25 | y6 |
| 626.314 | 775.394 | 25 | y7 | ||||
| 626.314 | 904.437 | 25 | y8 | ||||
| 626.314 | 1067.5 | 25 | y9 | ||||
| Histone H4 | P62805 | Nuclear extract | VFLENVIR | 495.293 | 501.314 | 20 | y4 |
| 495.293 | 630.356 | 20 | y5 | ||||
| 495.293 | 743.441 | 20 | y6 | ||||
| 495.293 | 890.509 | 20 | y7 | ||||
| 495.293 | 989.577 | 20 | y8 | ||||
Abbreviations: CE, collision energy; Q, quadropole.
2.6 Considerations of developing SRM assays for post-translational modifications
In the analysis of signal transduction pathways, the direct measurement of activated states of kinases or transcription factors can be accomplished by measurement of key activating post-translational modifications (PTMs). The work flow for PTM profiling with SID-SRM-MS is similar to the work flow for SID-SRM-MS quantification of total protein abundance except that the choice of signature peptides is limited to the specific site of the modification on the protein. Due to the limited choice of signature peptide, in addition to the challenges discussed above, several technical obstacles may be encountered in the course of PTM-SID-SRM assay development. These include: (i) Unmanageable peptide length. Depending on the distance between the modified site and its adjacent K or R residues, the tryptic peptide with the specific PTM site sometimes is either too long or too short to be considered as an ideal signature peptide. One solution for this challenge is to use alternative enzymes such as GluC or chymotrypsin to proteolyze the target protein. (ii) Some peptides may contain chemically reactive residues (e.g., M), which make the SRM analysis problematic. (iii) Some peptides may contain more than one basic amino acid residue (e.g., R, K, and H). In this situation, it is often necessary to choose between selecting the doubly- or triply-charged precursor ions. Both charge states should be evaluated and optimized with the goal of achieving the maximum sensitivity and specificity. (iv) Poor sensitivity. Depending on the properties of the amino acid sequence and the nature of PTMs, some PTM-modified signature peptides may have low ionization efficiency (e.g., phosphorylated peptides) or poor chromatographic behavior, which makes it necessary to enrich the target protein or the modified peptide with affinity chromatography prior to SRM analysis. The complications can be illustrated by an example of developing SRM assay of phosphorylation of S536 of the NF-κB/RelA transcription factor.
NF-κB/RelA is a transcription factor mediating a major arm of the IIR, containing 551 amino acid residues. The carboxy-terminal transactivation domain of RelA is a principle target for phosphorylation by upstream activating kinases, producing phospho-S536. This post-translational modification regulates nuclear localization, transcriptional activity and stability of NF-κB/RelA [45;46]. To develop an SRM assay for this post-translational modification site, RelA was first in silico digested with trypsin. Because the carboxy-terminal of RelA is devoid of K or R residues, the tryptic peptide containing phospho- S536 has 49 amino acid residues (LVTGAQRPPDPAPAPLGAPGLPNGLLSGDEDFSpS536IADMDFSALLSQISS). The m/z of doubly-and triply-charged precursor ions are 2486.702 and 1658.137, respectively, which are beyond the mass range of most QQQ-MS equipment. Developing a MS-compatible chromatographic method for this peptide is also problematic due to the length of the peptide and its high hydrophobicity (the Krokhin hydrophobicity factor is 62). Therefore, this tryptic peptide cannot be used as the signature peptide of phospho-S536 RelA. In this case, selecting another protease with different substrate specificity (e.g., GluC or chymotrypsin) may overcome the challenge. In silico digestion of RelA with GluC results in a 19-aa peptide (DFSpS536IADMDFSALLSQISS), a pepide suitable for developing an SRM assay. However, the SRM assay of phospho-S536 RelA is still a challenge for two reasons: (i) The MS response of this peptide is expected to be low because of lack of any basic amino acid residues in this peptide. The ESP prediction score for peptide DFSSIADMDFSALLSQISS is only 0.07 and the addition of one phosphate group on one serine residue will further reduce its ionization efficiency. (ii) The existence of one M residue in this peptide complicates the analysis. To overcome these technical obstacles, it was necessary to develop a strategy for quantifying the methionine containing peptides and to optimize the LC-SRM conditions to maximize the sensitivity of the assay.
Methionine is an endogenous antioxidant in proteins that is readily oxidized by reactive oxygen species such as superoxide, hydrogen peroxide, hydroxyl radical, and hypochlorite in vivo [47–49] and/or during the sample preparation. The major oxidation products of methionine are either singly oxidized methionine sulfoxide (+16) or doubly oxidized methionine sulfone (+ 32). As shown in Figure 7, the SRM analysis of chemically synthesized DFSpS536IADMDFSAL[Leu(13C6, 15N)]SQISS reveals that this peptide was heavily oxidized during chemical synthesis and/or storage. The major proportion of the peptide is in a singly oxidized methionine sulfoxide form. This artificial chemical modification can also occur to the methionine of target proteins and the extent of oxidation may vary from sample to sample, which will cause the inaccurate quantification in an SRM-MS analysis. A common approach for quantifying methionine-containing peptides is to convert the unmodified methionine into methionine sulfoxide using oxidants such as sodium periodate [50;51] or hydrogen peroxide [52]. The shortcoming of this approach is that the observed oxidation of methionine on the native peptide may also be the outcome of biological processes, and artificially converting the unmodified methionine into methionine sulfoxide with oxidants could obscure its detection as a target of in vivo methionine oxidation or discovery of a potential crosstalk between methionine oxidation and other PTMs (e.g., phosphorylation) on adjacent amino acid residues. An alternative approach is using oxygen-free solvent to carefully avoid artificial oxidation during sample processing and to quantify the unmodified and oxidized peptides with SRM simultaneously.
Figure 7. The effect of oxidation of methionine on the SRM assay of RelA phosphorylated S536.

Extract ion chromatograms of unmodified (red line), singly oxidized (methionine sulfoxide) (blue line) and doubly oxidized (methionine sulfoxide) (green line) peptide DFSpS536IADMDFSALL[(13C6;15N)]SQISS.
Unlike unmodified peptides for which optimal CE is approximately linearly correlated with the precursor mass for a given charge state [53], the optimal CEs for SRM transitions of PTM peptides may deviate considerably from the predicted values. For example, the detection of a neutral loss of phosphate from pSer, the energy needs to be lower, as the aim is to remove the phosphate yet leave the peptide backbone intact. As shown in Figure 8, we found that individually optimizing the CE for each SRM transition of PTM peptides can increase the signal response dramatically. The predicted CEs (CE = 0.034 (precursor ion m/z) + 3.314) for doubly charged precursors of DFSpS536IADMDFSAL[Leu(13C6, 15N)]SQISS and its oxidized isoform is 35V. Plotting the intensity versus collision energy for the eight best transitions of these two peptides shows that the optimal CE for each transition deviated from predicted CE by about 11~24 V. Importantly, CE optimization increases the signal response about over fivefold for each transition, dramatically increasing the sensitivity of the assay.
Figure 8. Optimization of SRM transitions of the peptide of RelA phosphorylated S536.
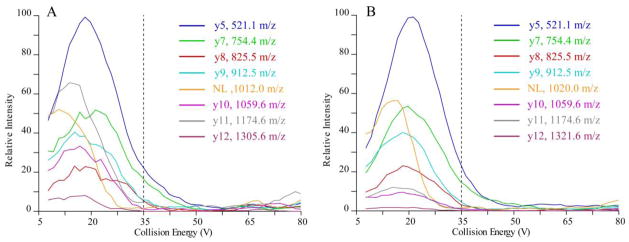
(A) Breakdown curve of the major fragments versus collision energy of the unmodified peptides DFS pS536IADMDFSALL[(13C6;15N)]SQISS. (B) Breakdown curve of the major fragments versus collision energy of the singly oxidized peptides DFS pS536IADMDFSALL[(13C6;15N)]SQISS. The vertical dashed lines represent the calculated collision energy voltage using a generic formula (CE = 0.034 x (precursor ion m/z) + 3.314). Note that the experimentally derived collision energies give significantly increased sensitivity over those determined by the generic formula. Abbreviations: NL, neutral loss of phosphate group.
3. Conclusions
Quantitative targeted proteomics is an enabling technology for the systems-level study of the dynamics of intracellular signaling networks. In this manuscript, we describe the work flow and example of application of stable isotopic dilution as a quantitative technique to determine concentrations of low abundant transcription factors in the innate immune response. Careful attention to the selection of high responding signature peptides and optimization of their transitions can lead to a robust and highly quantitative assay for measurement of total protein abundance in whole cell and subcellular fractions. The SID-SRM-MS assay, in certain cases, can be also applied to quantification of activated states of signaling molecules. An illustration of PTM-SID-SRM-MS assay development for detection of activating phospho-S modifications is presented and some of the challenges likely to be encountered are described. Further development of PTM-SID-SRM-MS assay technique will reveal important insights into how PTMs are coupled, and their role in controlling protein-protein interactions.
Acknowledgments
Supported by Institute for Human Infections and Immunity Pilot Program, NIAID AI062885, NCATS UL1TR000071, HHSN272200800048C NIAID Clinical Proteomics Center and NIH-NHLBI-HHSN268201000037C NHLBI Proteomics Center for Airway Inflammation.
Abbreviations
- CID
collision-induced dissociation
- CV
coefficient of variation
- IIR
innate immune response
- IRF3
Interferon Regulatory Factor 3
- MS
mass spectrometry
- NF-κB
nuclear factor-κB
- PTM
post translational modification
- PRR
pattern recognition receptor
- PTM
post-translational modification
- Q
quadropole
- SID
stable isotopic dilution
- SIS
stable isotope-labeled standard
- SRM
selected reaction monitoring
Reference List
- 1.Takeda K, Akira S. Curr Protoc Immunol Chapter. 2007;14(Unit14.12) doi: 10.1002/0471142735.im1412s77. [DOI] [PubMed] [Google Scholar]
- 2.Buonaguro L, et al. BMC Syst Biol. 2011;5:146. doi: 10.1186/1752-0509-5-146. [DOI] [PMC free article] [PubMed] [Google Scholar]
- 3.Shapira SD, Hacohen N. Curr Opin Immunol. 2011;23(1):71–77. doi: 10.1016/j.coi.2010.10.022. [DOI] [PMC free article] [PubMed] [Google Scholar]
- 4.Zak DE, Aderem A. Immunol Rev. 2009;227(1):264–282. doi: 10.1111/j.1600-065X.2008.00721.x. [DOI] [PMC free article] [PubMed] [Google Scholar]
- 5.Breitkreutz A, et al. Science. 2010;328(5981):1043–1046. doi: 10.1126/science.1176495. [DOI] [PMC free article] [PubMed] [Google Scholar]
- 6.Gingras AC, et al. Nat Rev Mol Cell Biol. 2007;8(8):645–654. doi: 10.1038/nrm2208. [DOI] [PubMed] [Google Scholar]
- 7.Kaake RM, Wang X, Huang L. Mol Cell Proteomics. 2010;9(8):1650–1665. doi: 10.1074/mcp.R110.000265. [DOI] [PMC free article] [PubMed] [Google Scholar]
- 8.Choudhary C, Mann M. Nat Rev Mol Cell Biol. 2010;11(6):427–439. doi: 10.1038/nrm2900. [DOI] [PubMed] [Google Scholar]
- 9.Rinner O, et al. Nat Biotechnol. 2007;25(3):345–352. doi: 10.1038/nbt1289. [DOI] [PubMed] [Google Scholar]
- 10.Picotti P, Aebersold R, Domon B. Mol Cell Proteomics. 2007;6(9):1589–1598. doi: 10.1074/mcp.M700029-MCP200. [DOI] [PubMed] [Google Scholar]
- 11.Cox J, Mann M. Nat Biotechnol. 2008;26(12):1367–1372. doi: 10.1038/nbt.1511. [DOI] [PubMed] [Google Scholar]
- 12.Gerber SA, et al. Proc Natl Acad Sci U S A. 2003;100(12):6940–6945. doi: 10.1073/pnas.0832254100. [DOI] [PMC free article] [PubMed] [Google Scholar]
- 13.Lange V, et al. Mol Syst Biol. 2008;4:222. doi: 10.1038/msb.2008.61. [DOI] [PMC free article] [PubMed] [Google Scholar]
- 14.Picotti P, et al. Cell. 2009;138(4):795–806. doi: 10.1016/j.cell.2009.05.051. [DOI] [PMC free article] [PubMed] [Google Scholar]
- 15.Bisson N, et al. Nat Biotechnol. 2011;29(7):653–658. doi: 10.1038/nbt.1905. [DOI] [PubMed] [Google Scholar]
- 16.Dong MQ, et al. Science. 2007;317(5838):660–663. doi: 10.1126/science.1139952. [DOI] [PubMed] [Google Scholar]
- 17.Keshishian H, et al. Mol Cell Proteomics. 2007;6(12):2212–2229. doi: 10.1074/mcp.M700354-MCP200. [DOI] [PMC free article] [PubMed] [Google Scholar]
- 18.Anderson L, Hunter CL. Mol Cell Proteomics. 2006;5(4):573–588. doi: 10.1074/mcp.M500331-MCP200. [DOI] [PubMed] [Google Scholar]
- 19.Wolf-Yadlin A, et al. Proc Natl Acad Sci U S A. 2007;104(14):5860–5865. doi: 10.1073/pnas.0608638104. [DOI] [PMC free article] [PubMed] [Google Scholar]
- 20.Barnidge DR, et al. Anal Chem. 2003;75(3):445–451. doi: 10.1021/ac026154+. [DOI] [PubMed] [Google Scholar]
- 21.Shadforth I, et al. J Proteome Res. 2006;5(10):2849–2852. doi: 10.1021/pr060205s. [DOI] [PubMed] [Google Scholar]
- 22.Desiere F, et al. Genome Biol. 2005;6(1):R9. doi: 10.1186/gb-2004-6-1-r9. [DOI] [PMC free article] [PubMed] [Google Scholar]
- 23.Craig R, Cortens JP, Beavis RC. J Proteome Res. 2004;3(6):1234–1242. doi: 10.1021/pr049882h. [DOI] [PubMed] [Google Scholar]
- 24.Jones P, et al. Nucleic Acids Res. 2006;34(Database issue):D659–D663. doi: 10.1093/nar/gkj138. [DOI] [PMC free article] [PubMed] [Google Scholar]
- 25.Walsh GM, et al. J Proteomics. 2009;72(5):838–852. doi: 10.1016/j.jprot.2008.11.015. [DOI] [PMC free article] [PubMed] [Google Scholar]
- 26.Lange V, et al. Mol Cell Proteomics. 2008;7(8):1489–1500. doi: 10.1074/mcp.M800032-MCP200. [DOI] [PMC free article] [PubMed] [Google Scholar]
- 27.Deutsch EW, Lam H, Aebersold R. EMBO Rep. 2008;9(5):429–434. doi: 10.1038/embor.2008.56. [DOI] [PMC free article] [PubMed] [Google Scholar]
- 28.Fusaro VA, et al. Nat Biotechnol. 2009;27(2):190–198. doi: 10.1038/nbt.1524. [DOI] [PMC free article] [PubMed] [Google Scholar]
- 29.Picotti P, et al. Nature. 2013 [Google Scholar]
- 30.Mead JA, et al. Mol Cell Proteomics. 2009;8(4):696–705. doi: 10.1074/mcp.M800192-MCP200. [DOI] [PMC free article] [PubMed] [Google Scholar]
- 31.Keil B. Specificity of Proteolysis. Springer-Verlaq; Berlin, Germany: 1992. [Google Scholar]
- 32.Rodriguez J, et al. J Proteome Res. 2008;7(1):300–305. doi: 10.1021/pr0705035. [DOI] [PubMed] [Google Scholar]
- 33.Yan Z, et al. Rapid Commun Mass Spectrom. 2008;22(13):2021–2028. doi: 10.1002/rcm.3577. [DOI] [PubMed] [Google Scholar]
- 34.Zhao Y, et al. Mol Cell Proteomics. 2011;10(6):M111. doi: 10.1074/mcp.M111.008771. [DOI] [PMC free article] [PubMed] [Google Scholar]
- 35.Addona TA, et al. Nat Biotechnol. 2009;27(7):633–641. doi: 10.1038/nbt.1546. [DOI] [PMC free article] [PubMed] [Google Scholar]
- 36.Keshishian H, et al. Mol Cell Proteomics. 2009;8(10):2339–2349. doi: 10.1074/mcp.M900140-MCP200. [DOI] [PMC free article] [PubMed] [Google Scholar]
- 37.Kuhn E, et al. Clin Chem. 2009;55(6):1108–1117. doi: 10.1373/clinchem.2009.123935. [DOI] [PMC free article] [PubMed] [Google Scholar]
- 38.Kuzyk MA, et al. Mol Cell Proteomics. 2009;8(8):1860–1877. doi: 10.1074/mcp.M800540-MCP200. [DOI] [PMC free article] [PubMed] [Google Scholar]
- 39.Green JM. Anal Chem. 1996;68:A305–A309. [Google Scholar]
- 40.Brasier AR, et al. J Virol. 2011;85(22):11752–11769. doi: 10.1128/JVI.05360-11. [DOI] [PMC free article] [PubMed] [Google Scholar]
- 41.Liu P, et al. PLoS One. 2009;4(11):e8079. doi: 10.1371/journal.pone.0008079. [DOI] [PMC free article] [PubMed] [Google Scholar]
- 42.Brun V, et al. Mol Cell Proteomics. 2007;6(12):2139–2149. doi: 10.1074/mcp.M700163-MCP200. [DOI] [PubMed] [Google Scholar]
- 43.Abbatiello SE, et al. Clin Chem. 2010;56(2):291–305. doi: 10.1373/clinchem.2009.138420. [DOI] [PMC free article] [PubMed] [Google Scholar]
- 44.Reiter L, et al. Nat Methods. 2011;8(5):430–435. doi: 10.1038/nmeth.1584. [DOI] [PubMed] [Google Scholar]
- 45.Chen LF, Greene WC. Nat Rev Mol Cell Biol. 2004;5(5):392–401. doi: 10.1038/nrm1368. [DOI] [PubMed] [Google Scholar]
- 46.Huang B, et al. Cell Signal. 2010;22(9):1282–1290. doi: 10.1016/j.cellsig.2010.03.017. [DOI] [PMC free article] [PubMed] [Google Scholar]
- 47.Stadtman ER, et al. Biochim Biophys Acta. 2005;1703(2):135–140. doi: 10.1016/j.bbapap.2004.08.010. [DOI] [PubMed] [Google Scholar]
- 48.Schoneich C. Biochim Biophys Acta. 2005;1703(2):111–119. doi: 10.1016/j.bbapap.2004.09.009. [DOI] [PubMed] [Google Scholar]
- 49.Hoshi T, Heinemann S. J Physiol. 2001;531(Pt 1):1–11. doi: 10.1111/j.1469-7793.2001.0001j.x. [DOI] [PMC free article] [PubMed] [Google Scholar]
- 50.Kirkpatrick DS, Gerber SA, Gygi SP. Methods. 2005;35(3):265–273. doi: 10.1016/j.ymeth.2004.08.018. [DOI] [PubMed] [Google Scholar]
- 51.Yamasaki RB, Osuga DT, Feeney RE. Anal Biochem. 1982;126(1):183–189. doi: 10.1016/0003-2697(82)90127-0. [DOI] [PubMed] [Google Scholar]
- 52.Corless S, Cramer R. Rapid Commun Mass Spectrom. 2003;17(11):1212–1215. doi: 10.1002/rcm.1028. [DOI] [PubMed] [Google Scholar]
- 53.Maclean B, et al. Anal Chem. 2010;82(24):10116–10124. doi: 10.1021/ac102179j. [DOI] [PMC free article] [PubMed] [Google Scholar]