Abstract
Accumulation of sub-rupture fatigue damage has been implicated in the development of tendinopathy. We previously developed an in vivo model of damage accumulation using the rat patellar tendon. Our model allows us to control the input loading parameters to induce fatigue damage in the tendon. Despite this precise control, the resulting induced damage could vary among animals because of differences in size or strength among their patellar tendons. In this study, we used number of applied cycles and initial (day-0) parameters that are indicative of induced damage to assess the molecular response 7 days after fatigue loading. We hypothesized that day-0 hysteresis, elongation, and stiffness of the loading and unloading load-displacement curves would be predictive of the 7-day molecular response. Results showed correlations between the 7-day molecular response and both day-0 elongation and unloading stiffness. Additionally, loading resulted in upregulation of several extracellular matrix genes that suggest adaptation; however, several of these genes (Col-I, -XII, MMP 2, and TIMP 3) shut down after a high level of damage was induced. We showed that evaluating the 7-day molecular profile in light of day-0 elongation provides important insight that is lost from comparing number of fatigue loading cycles only. Our data showed that loading generally results in an adaptive response. However, the tendon's ability to effectively respond deteriorates as greater damage is induced.
Keywords: tendinopathy, elongation, stiffness, molecular profile, damage accumulation
Introduction
Sub-rupture damage accumulation has been implicated in the progression of tendinopathy as evidenced from observed degenerative changes in ruptured tendons and matrix disorganization in macroscopically “healthy” tendons.1, 2 Since clinical data on tendinopathy primarily stem from biopsied tendons, representative of late stage disease, the development of animal models including treadmill running or repetitive motion have been insightful in the investigation of the development of tendinopathy.3-5 Our in vivo model of fatigue damage accumulation in the rat patellar tendon provides the advantage of precisely controlling the loads applied to the tendon, minimizing the variation that is introduced from experimental protocols.
Loading applied to the tendon can be beneficial, such as the result of healthy exercise,6 or detrimental, as observed in overuse injuries.1, 7, 8 In contrast to stress deprivation, cyclic loading results in changes in gene expression that support that exercise can be beneficial in the management of tendinopathy.9 Previously we showed a different molecular response associated with 100 versus 7200 cycles of loading; two loading regimens that were expected to model physiological loading and early tendinopathy, respectively.10 We expect therefore that the molecular response, which is indicative of whether there is an attempt to adapt, repair, or further degenerate, is impacted by the number of cycles and the extent of matrix damage. While it is generally expected that greater cycles will be correlated with greater matrix damage, variability in tendon strength and resistance to damage confounds this seemingly direct relationship.
Consequently, we identified initial (day-0) non-recoverable mechanical parameters that can serve as indices of the induced damage.11 We found that hysteresis, stiffness of the loading and unloading load-displacement curves, and elongation exhibited a day-0 change due to fatigue loading that was not recovered after 45 minutes and could therefore function as indices of the induced damage (damage parameters). Interestingly, day-0 hysteresis and loading and unloading stiffness exhibited a relationship with the number of loading cycles, but day-0 elongation, while altered by fatigue loading, did not exhibit a relationship to the number of cycles.11 We also found that day-0 hysteresis loss was predictive of the stiffness 7 days post fatigue loading.11 However, the relationship between these previously identified day-0 damage parameters and the molecular response of the tendon 7 days after fatigue loading remains unknown. Therefore, our objectives were to interpret the molecular response of damaged tendons 7 days after fatigue loading in the context of previously identified day-0 damage parameters and number of cycles to isolate the effect of number of cycles from the induced damage. We hypothesized that day-0 damage parameters, such as hysteresis, tendon elongation, and stiffness of the loading and unloading load-displacement curves will be predictive of the molecular response 7 days after loading.
Methods
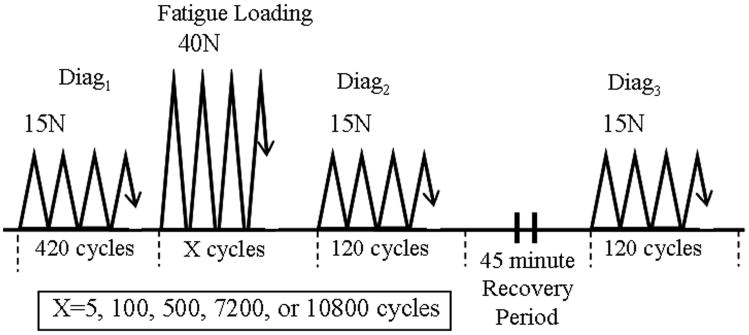
Following IACUC approval, left patellar tendons (PT) of anesthetized (isoflurane, 2-3% by volume, 0.4L/minute) adult female retired breeder Sprague-Dawley rats (n=68) (Charles River Laboratories, Ltd., Wilmington, MA) were surgically exposed12. Under aseptic conditions, the tibia was clamped, securing the knee at ∼30° flexion. Another clamp gripped the patella and was connected in series to a 50-lb load cell and actuator of a servo-hydraulic loading system, allowing loading of the PT without direct instrumentation with the tendon. The PT was fatigue loaded (Fig. 1) while continuously moistened with sterile phosphate buffered saline. The clamps were removed, and the skin incisions were sutured with 6-0 prolene. Analgesia (Buprenex) was administered, and the rats resumed cage activity.
Figure 1.
Day-0 fatigue loading protocol. Fatigue loading is applied to x cycles that range from 1 to 40N at 1 Hz (x=5, 100, 500, 7,200, or 10,800). Diagnostic tests are applied before (Diag1), immediately after (Diag2), and 45 mins (Diag3) after fatigue loading. Hysteresis and stiffness of the loading and unloading load-displacement curves were calculated and averaged for the last 10 cycles and then compared between Diag2 and Diag3 to determine the day-0 recoverable effect of fatigue loading, and between Diag1 and Diag3 to determine the day-0 non-recoverable effect of fatigue loading. Day-0 recoverable and non-recoverable elongation was determined by comparing the actuator position at the start of the last 10 cycles between Diag2 and Diag3, and between Diag1 and Diag3, respectively.
Our previously published fatigue loading protocol was adapted for this study (Fig. 1).12, 13 Rats were randomly assigned into a fatigue loading group. The loading portion of protocol consisted of x cycles that ranged from 1 to 40N, where x was either 5 (n=15), 100 (n=15), 500 (n=16), 7200 (n=16), or 10800 (n=6), applied at 1 Hz. Diagnostic tests that ranged from 1 to 15N at 1 Hz, were applied before (Diag1), immediately after (Diag2), and 45 mins (Diag3) after loading to assess the effect of loading.11 Hysteresis and stiffness of the loading and unloading load-displacement curves were calculated and averaged for the last 10 cycles of each diagnostic test.11 These averaged parameters were compared between Diag2 and Diag3 to determine the recoverable effect of fatigue loading, and between Diag1 and Diag3 to determined the non-recoverable effect.11 Day-0 recoverable and non-recoverable elongation was determined by comparing the actuator position at the start of the last 10 cycles between Diag2 and Diag3, and between Diag1 and Diag3, respectively.11
The 5, 100, and 500 cycle groups were expected to represent different snapshots within the primary phase of the fatigue life of the tendon. The 10800 cycle group was initially included because tendons from this group were expected to be in their tertiary phase of fatigue loading and were expected to exhibit a different response mechanism. However, after collection of the first 6 samples, we found that 7200 and 10800 cycle groups are both in the secondary phase of the fatigue life. The number of cycles could not be further increased due the ethical time limits for keeping the animals anesthetized. Day-0 mechanical parameters and the molecular profile of the 10800 cycle group were evaluated and compared to that of the 7200 cycle group. Since no significant differences were found between the two groups, they were pooled and no additional animals were added to 10800 cycle group. The primary and secondary phases are defined from previous work that showed that the tendon's fatigue life is characterized by 3 distinct phases that have clear transitions indicated by significant changes in slope of the peak actuator position that coincides with distinct changes in stiffness.14 Briefly, the primary phase is characterized by a rapid increase in stiffness that becomes constant in the secondary phase and increasingly declines in the tertiary phase14. Peak cyclic strain increases in the primary phase, more slowly increases in the secondary phase, and rapidly increases in the tertiary phase14.
Hysteresis, tendon elongation, and stiffness of the loading and unloading curves exhibited a non-recoverable effect of loading (determined from comparing Diag1 and Diag3), suggesting that they can serve as indices of damage, and subsequently discussed as ‘damage parameters’.11 The relationship between the non-recoverable day-0 changes in these previously identified damage parameters and the biologic response of the tendon 7 days post fatigue loading was evaluated. From this point forward, any day-0 changes discussed refer to the non-recoverable day-0 changes in damage parameters.
Rats were sacrificed 7 days after loading (n=5-6/ group). The 7-day time point was chosen based on prior work that showed a transient molecular response that peaked 7 days after fatigue loading. Tendons were isolated immediately following euthanasia and frozen in liquid nitrogen. Frozen samples were pulverized, and RNA was isolated using an RNeasy kit (Qiagen, Valencia, CA). From each sample, 2-5μg of RNA was reverse transcribed with MMLV reverse transcriptase and an Oligo(dT)12-18 primer (Invitrogen, Carlsbad, CA). cDNA was amplified using primers designed for 15 targeted genes (supplementary Table 1) and quantified using the ABI Prism 7900HT Real-Time PCR system (Applied Biosystems, Framingham, MA). Each sample was run in triplicate. CT values of each gene were expressed relative to glyceraldehyde-3-phosphate dehydrogenase (GAPDH) (delta CT) and then relative to baseline. To determine the baseline, RNA was isolated from contralaterals and 6 naive tendons, and analyzed similarly.
Analysis and statistics
To determine the appropriate control for gene expression, a Kruskal-Wallis with post-hoc Dunn's multiple comparison was conducted for each gene evaluated to compare delta CT values between naive tendons, and contralateral tendons from the 5 cycle and the combined 7200 and 10800 cycle (the lowest and highest number of cycles) loading groups. Based on this analysis, the appropriate control was determined and used for all subsequent molecular analysis. The co-variation between genes was assessed with Spearman correlations without taking into account the number of day-0 fatigue loading cycles or damage induced.
The relationships between the 7-day gene expression, number of loading cycles, and damage induced was then assessed. The 7-day molecular profile was first compared with a Mann-Whitney test among samples that were loaded within the primary (5, 100, 500 cycles) and secondary phase (7200, 10800 cycles) of loading, without accounting for the damage induced. Next, the relationship between the 7-day molecular response and each day-0 damage parameter was evaluated with a Pearson correlation disregarding the number of cycles. Finally, we evaluated the relationship between the 7-day molecular profile and the day-0 induced damage, taking into account the number of loading cycles with k-means cluster analysis15. Since 3 outcomes were expected (either low number of cycles resulting in a low amount of damage or a high number of cycles resulting in a low or high amount of damage), 3 clusters were constrained. If the analysis yielded <3 datum points per cluster, the day-0 damage parameter being evaluated for clustering the 7-day molecular profile was dismissed. The clusters for each day-0 damage parameter and its corresponding 7-day gene expression was assessed with a Kruskal-Wallis with post-hoc Dunn's multiple comparison test. Also, contingency tables demonstrating the percentage of samples in each cluster that were fatigue loaded within the primary or secondary phase was tabulated, and Chi2 tests were performed. Significance, denoted by ‘*’, was set at p≤0.05. A statistical trend, denoted by ‘#’, was set at p≤0.1.
Results
Determining the appropriate control for gene expression
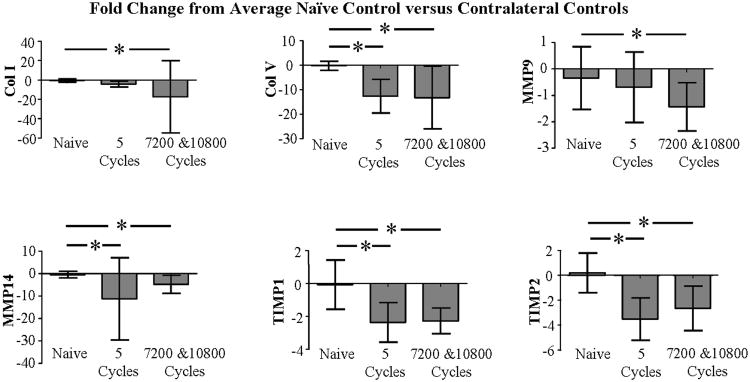
Col I, Col V, MMP9, MMP14, TIMP1, and TIMP2 were downregulated for non-loaded contralateral tendons of the 5 cycle and 7200 and 10800 cycles loaded groups (Fig. 2). Since differences in gene expression were found between naive and contralateral tendons, molecular expression data was subsequently expressed relative to naive controls.
Figure 2.
Expression of Col I, Col V, MMP9, MMP14, TIMP1, and TIMP2 was significantly downregulated for contralaterals of 5 and 10,800 fatigue loaded tendons than naive tendons. Avgs and std devs are shown.
Correlations between expressed genes
The 7-day expression of several genes were correlated (Table I). Positive correlations were found between all collagens evaluated (Col I, III, V, and XII). The observed correlations between the evaluated collagens and several of the evaluated MMPs and TIMPs support that adaptation in response to loading is concurrent with remodeling in response to induced fatigue damage. More specifically, Col I and XII positively correlated with all MMPs and TIMPs with the exception of MMP8. Expression of Col III and V correlated with all MMPs, except MMP2 and 8. Expression of Col I, III, and XII correlated with all TIMPs. Col V correlated with TIMP-1 and -2, but not -3, and -4. Interestingly, expression of MMP8 did not correlate with any other MMPs. Expression of MMP3 and 14 correlated with all MMPs except MMP8. The observed correlations between several of the evaluated MMPs and TIMPs demonstrates the attempt of the tendon to maintain homeostasis in response to fatigue loading. In contrast, the lack of correlations support that remodeling and degeneration is part of the response to fatigue loading. More specifically, expression of MMP14 correlated with all TIMPs. Expression of MMP3 and 13 correlated with expression of TIMP1, 2, and 3. Expression of MMP2 correlated with expression of TIMP3. Expression of MMP8 correlated with expression of TIMP4. Expression of TIMP 2 and 3 were correlated to each other and also correlated with expression of TIMP1 and 4. Expression of TIMP1 and TIMP4 did not correlate.
Table I.
Spearman correlations between expression of collagens, MMP's, and TIMPs. A positive ‘r’ value reflects a positive correlation.
| Col III | Col V | Col XII | MMP 2 | MMP 3 | MMP 8 | MMP 13 | MMP 14 | TIMP 1 | TIMP 2 | TIMP 3 | TIMP 4 | ||
|---|---|---|---|---|---|---|---|---|---|---|---|---|---|
| Col I | p r | <0.001 0.68 | <0.001 0.78 | p<0.001 0.80 | <0.001 0.57 | <0.001 0.80 | NS | <0.001 0.73 | <0.001 0.84 | <0.001 0.77 | <0.001 0.85 | <0.001 0.72 | 0.003 0.53 |
| Col III | p r | <0.001 0.84 | 0.003 0.51 | NS | <0.001 0.76 | NS | <0.001 0.76 | <0.001 0.71 | <0.001 0.88 | <0.001 0.76 | NS | NS | |
| Col V | p r | <0.001 0.57 | NS | <0.001 0.77 | NS | <0.001 0.67 | <0.001 0.82 | <0.001 0.82 | <0.001 0.87 | 0.001 0.55 | 0.024 0.42 | ||
| Col XII | p r | <0.001 0.59 | <0.001 0.62 | NS | <0.001 0.63 | <0.001 0.77 | 0.001 0.55 | <0.001 0.72 | <0.001 0.75 | 0.006 0.5 | |||
| MMP 2 | p r | 0.027 0.39 | NS | NS | <0.001 0.63 | NS | NS | <0.001 0.77 | NS | ||||
| MMP 3 | p r | NS | <0.001 0.84 | <0.001 0.71 | <0.001 0.92 | <0.001 0.75 | <0.001 0.52 | NS | |||||
| MMP 8 | p r | NS | NS | NS | NS | NS | 0.006 0.5 | ||||||
| MMP 13 | p r | <0.001 0.64 | <0.001 0.86 | <0.0010.63 | 0.024 0.4 | NS | |||||||
| MMP 14 | p r | <0.001 0.77 | <0.001 0.77 | <0.001 0.8 | 0.01 0.46 | ||||||||
| TIMP 1 | p r | <0.001 0.71 | 0.01 0.43 | NS | |||||||||
| TIMP 2 | p r | <0.001 0.6 | 0.009 0.48 | ||||||||||
| TIMP 3 | p r | 0.006 0.49 |
7-day Gene expression compared between primary and secondary phase of fatigue loading
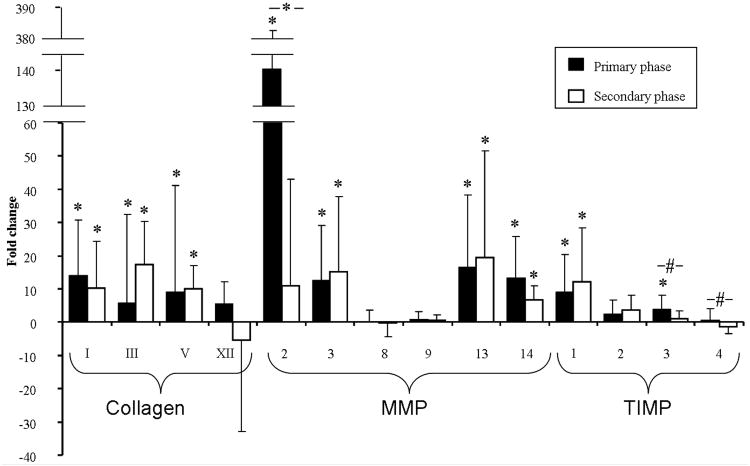
Tendons that were fatigue loaded within the primary or secondary phases exhibited significant upregulation of Col I, Col III, Col V, MMP3, MMP13, MMP14, and TIMP1 (Fig. 3). Expression of MMP2 and TIMP3 was significantly upregulated for tendons that were fatigue loaded within the primary, but not the secondary phase.
Figure 3.
Gene expression of Collagens, MMPs, and TIMPs for tendons loaded within the primary and secondary phase. Avgs and std devs are shown.
Correlations between 7-day gene expression and day-0 damage parameters
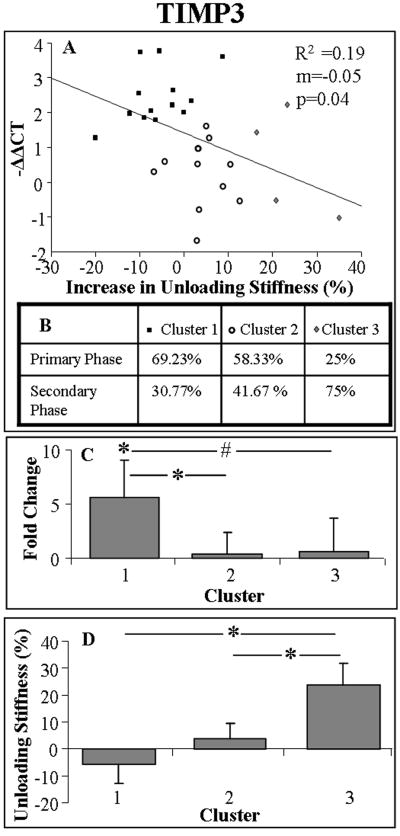
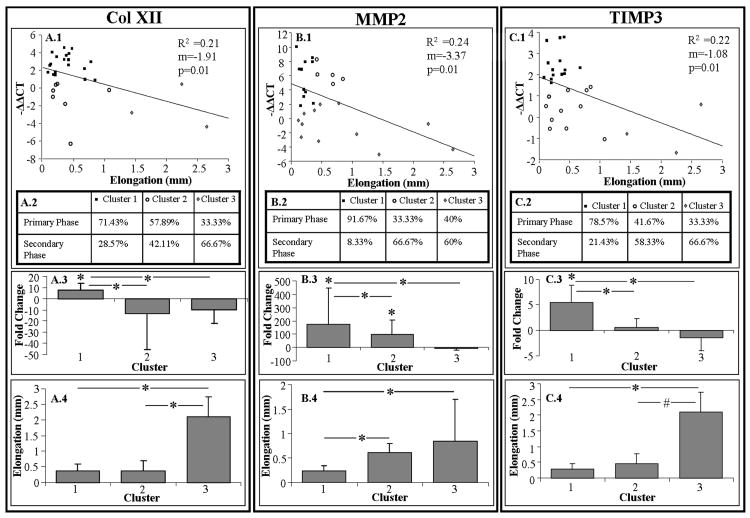
Significant and negative correlations were found between day-0 unloading stiffness (%) and expression of TIMP3 (Fig. 4). Similarly, significant and negative correlations were found between day-0 elongation and expression of Col XII, MMP2, and TIMP3 (Figs. 5A-C). For clarity, data are shown as a correlation with −ΔΔCT to reflect the direction of molecular change (i.e., negative correlation indicates downregulation). No other correlations between day-0 damage parameters and expression of any other genes were found.
Figure 4.
Day-0 unloading stiffness negatively correlated with 7-day expression of TIMP3 (A). Shown is the percentage of tendons that were fatigue loaded within the primary and secondary phase of each cluster (B), 7-day expression of TIMP3 (avgs and std devs) (C), and coinciding day-0 unloading stiffness (avgs and std devs) (D).
Figure 5.
Day-0 elongation negatively correlated with 7-day expression of Col XII (A.1), MMP2 (B.1), and TIMP3 (C.1). Shown is percentage of tendons that were fatigue loaded within the primary and secondary phase of each cluster (A.2, B.2, and C.2), 7-day gene expression (avgs and std devs) (A.3, B.3, and C.3), and coinciding day-0 elongation (avgs and std devs) (A.4, B.4, and C.4).
7-day gene expression relative to day-0 damage parameters and number of fatigue cycles
Clustering the expression of Col I, Col XII, MMP2, and TIMP3 by elongation (also by unloading stiffness in the case of TIMP3) resulted in 3 distinctly different clusters (Figs. 4 and 5). Comparing cluster 1 and 3 suggested that a tendon that exhibits an increase in day-0 elongation (and unloading stiffness for TIMP3), exhibits a decrease in 7-day gene expression. Interestingly, cluster 2 did not differ from cluster 1 in elongation or unloading stiffness, but exhibited a significantly lower gene expression that also did not differ from that observed in cluster 3. Contingency tables generally showed a decreasing percentage of tendons that were fatigue loaded within the primary phase, from cluster 1 to 3. Cluster analysis of MMP2 expression by elongation, demonstrated a dose response, indicating that as elongation increased, MMP2 expression decreased.
Discussion
While interpreting the response of the tendon in the context of the number of applied cycles provides insight, variability among animals motivates assessing the molecular response in the context of damage induced as well as the number of cycles. In this study, the relationship between the 7-day gene expression and day-0 damage parameters that are indicative of induced damage (hysteresis, elongation, loading and unloading stiffnesses) was evaluated. Interestingly, only day-0 tendon elongation and increase in unloading stiffness related to the 7-day gene expression. It is interesting that elongation, which is reflective of an increased state of strain in the tendon, is predictive of the molecular response. While increase in strain reflects an increased risk of failure,16 our data suggest a relationship between this tissue-level strain increase and the local strain around the cell. Similarly, the day-0 increase in unloading stiffness that results from fatigue loading reflects a compromised ability of the tendon to recover after removal of loading, suggesting that the local mechanical environment associated with this reduced ability of the tendon to recoil is integral to the cellular response.
Patellar tendons were fatigue loaded to several levels within the primary and secondary phase to induce a range of damage severities. The gene expression profile among tendons that were fatigue loaded within the primary and secondary phase was similar. However, this lack of difference is likely due to the large variability among animals that results in a large range of induced damage. Subsequently, evaluating the relationship between day-0 damage parameters and the 7-day gene expression suggested that some genes (Col I, XII, MMP2, and TIMP3) were not responsive to high damage accumulation. Unloading stiffness and elongation were predictive of the 7-day gene expression.
Fatigue loading to a number of cycles within the primary and secondary phase resulted in upregulation of Col I, Col III, Col V, MMP3, MMP13, and TIMP1. Fatigue loading to a number of cycles within the primary but not the secondary phase resulted in upregulation of MMP2 and TIMP3. These results indicate that loading generally results in a hypertrophic response.17 The upregulation of Col III and V indicates synthesis of new collagen as seen in tendon healing18 and developing embryonic tendons.19 Also, the observed increase in Col I is typical of an anabolic, hypertrophic response.17 Upregulation of MMP-2, -3, and -13 are indicative of degradation and/or remodeling.20 MMP2, which was significantly upregulated for the primary phase only, is associated with exercise, MMP3 is associated with tendon remodeling, and MMP13 has been implicated in degradation of damaged matrix.20, 21 In contrast to tendons that were fatigue loaded within the secondary phase, tendons that were fatigue loaded within the primary phase exhibited significantly greater upregulation of MMP2 than any other gene, supporting that adaptation and remodeling is a significant component of 7-day molecular response of generally less damaged tendons. Upregulation of TIMP1 is expected to be associated with the observed upregulation of MMP2.22 Finally TIMP3 upregulation has been associated with inhibition of inflammation,23 potentially accounting for the lack of inflammation in fatigue damage. Significant correlations between expression of several genes further clarify that the response to fatigue damage and to loading occur simultaneously. For instance, it is interesting that Col I, and XII (but not III and V) correlated with upregulation of MMP2, suggesting adaptation that would be expected in response to loading. However, upregulation of all collagens correlated with upregulation of MMP3, 13, and 14, suggesting a remodeling response that would be expected in response to damage. Considering these data in conjunction with findings from k-means cluster analysis suggests that upregulation of genes indicative of adaptation and remodeling occurs in response to fatigue loading. However, regardless of cycle number, a high amount of induced damage results in dampening of the ability of the tendon to repair.
Significant correlations were observed between day-0 elongation and 7-day gene expression of Col XII, MMP2, and TIMP3. Similarly, a significant correlation was observed between day-0 unloading stiffness and 7-day gene expression of TIMP3. These correlations allow us to infer the relationship between the correlated parameters beyond the data experimentally collected. However, these weak, but significant relationships support the need for cluster analysis to discern threshold responses and complexities within these relationships.
Clustering the 7-day gene expression by day-0 elongation suggests that initial elongation is predictive of the 7-day gene expression. Day-0 unloading stiffness confirmed the results found for TIMP3 when clustered by elongation. The contingency tables from cluster analysis of the gene expression showed the expected greater percentage of tendons fatigue loaded within the primary phase for clusters exhibiting lower day-0 elongation. The data suggest that tendons fatigue loaded to a number of cycles within the primary phase exhibit low elongation and a hypertrophic response. Similarly, tendons that are fatigue loaded to a number of cycles within the secondary phase of fatigue loading exhibit a high amount of day-0 elongation and a shut-down in expression of Col I, Col XII, MMP2, and TIMP3. Since upregulation of Col I and XII is typical of an anabolic response, MMP2 is indicative of remodeling, and TIMP3 is associated with inhibition of inflammation, suppression of these particular genes is indicative of a catabolic degeneration.
Tendons that fall within cluster 2 that were fatigue loaded within the primary phase represent tendons that exhibit the expected minimal amount of induced damage, but a surprising decrease in gene expression. Tendons that exhibited a lower upregulation of genes in response to minimal induced damage may have experienced a different local strain environment (possibly more shear) or different structural changes than tendons that exhibited minimal induced damage and a more adaptive molecular response. Alternatively, the tenocytes in these tendons could be more responsive to the levels of stretch associated with the exhibited elongation than the tendons that were loaded similarly in cluster 1.24 Similarly, tendons that fell within cluster 2 that were fatigue loaded within the secondary phase represent tendons that exhibited a low amount of induced damage despite a high number of applied cycles. Interestingly, MMP2 expression was downregulated for greater amounts of induced damage in a dose response manner. Distinguishing between tendons that were fatigue loaded to a high or low number of cycles in the context of the damage induced is essential to interpreting the response of the tendon over time.
Lavagnino et al. showed a weak, but significant correlation between applied grip-to-grip strain and the tendon-ciliary deflection angle was not recovered to pre-loading state with higher applied strain25. This work suggests that increase in non-recovered deflection angle in tenocytes cilia with greater elongation likely contributes to the observed 7-day molecular response. Also, under loading, gap junctions characterized by the presence of connexin 32 stimulate Col I production, while gap junctions characterized by the presence of connexin 43 inhibit Col I production26. Interestingly, connexin 32 containing junctions are arranged along the tensile loading direction in the tendon, whereas connexin 43-containing junctions are along all directions 26. Taken together with our findings that tendons that experienced greater non-recoverable day-0 elongation also experienced less increase in Col I production, a non-uniform increase in strain surrounding the cells is likely associated with the increase in elongation.
Contralaterals to loaded limbs exhibited significant differences in gene expression from naive control tendons leading us to use naive tendons as controls. Large standard deviations in the expression of some genes for some groups reflect the expected contralateral effect of a large range of damage induced across animals for the same fatigue loading protocol. The significant decrease in Col I, Col V, MMP9, MMP14, TIMP1, and TIMP2 in contralaterals compared to naive tendons may be attributable to either a systemic effect or a compensatory change in gait in the contralateral limb, although no gross gait asymmetry was noted. We suspect that the observed downregulation is the result of a systemic effect, since altered loading would more likely result in upregulation of these markers (as observed in low fatigue loading) instead of the observed downregulation. Future studies will evaluate other non-load bearing tendons, such as the tail tendons, to assess the ubiquitous effect of this possible systemic response.
In this study, the temporal response of the tendon was investigated 7 days post fatigue loading based on preliminary studies that showed a peak in response at this time point for the 7200 cycle fatigue loading group. Despite evidence that this time point is critical, a limitation of our study is that additional, particularly earlier, timepoints were not evaluated. In addition, while gene expression provides valuable insight into the molecular response that can lead to repair or further damage, we did not evaluate protein levels, which will be the focus of future studies.
In conclusion, we showed that evaluating the 7-day molecular profile in light of day-0 elongation provides important insight that is lost from comparing number of fatigue loading cycles only. Our data showed that loading generally results in an adaptive response. However, the tendon's ability to effectively respond deteriorates as greater damage is induced.
Supplementary Material
Figure 6.
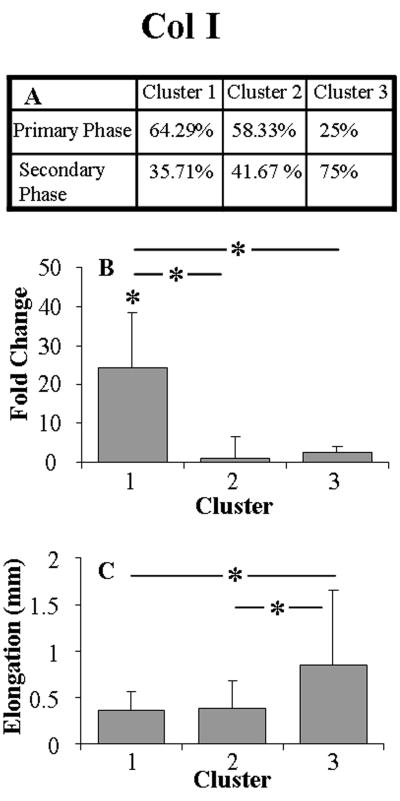
Cluster analysis of Col I by day-0 elongation. Shown is percentage of tendons that were fatigue loaded within the primary and secondary phase of each cluster (A), 7-day gene expression (avgs and std devs) (B), and coinciding day-0 elongation (avgs and std devs) (C).
Acknowledgments
This study was supported by the NIH (AR52743 and AR058123). The authors thank Daniel J. Leong and Stephen J. Ros for their contributions.
References
- 1.Kannus P, Jozsa L. Histopathological changes preceding spontaneous rupture of a tendon. A controlled study of 891 patients. J Bone Joint Surg Am. 1991;73:1507–1525. [PubMed] [Google Scholar]
- 2.Tallon C, Maffulli N, Ewen SW. Ruptured Achilles tendons are significantly more degenerated than tendinopathic tendons. Med Sci Sports Exerc. 2001;33:1983–1990. doi: 10.1097/00005768-200112000-00002. [DOI] [PubMed] [Google Scholar]
- 3.Barbe MF, Barr AE, Gorzelany I, et al. Chronic repetitive reaching and grasping results in decreased motor performance and widespread tissue responses in a rat model of MSD. J Orthop Res. 2003;21:167–176. doi: 10.1016/S0736-0266(02)00086-4. [DOI] [PMC free article] [PubMed] [Google Scholar]
- 4.Soslowsky LJ, Carpenter JE, DeBano CM, et al. Development and use of an animal model for investigations on rotator cuff disease. J Shoulder Elbow Surg. 1996;5:383–392. doi: 10.1016/s1058-2746(96)80070-x. [DOI] [PubMed] [Google Scholar]
- 5.Szczodry M, Zhang J, Lim C, et al. Treadmill running exercise results in the presence of numerous myofibroblasts in mouse patellar tendons. J Orthop Res. 2009;27:1373–1378. doi: 10.1002/jor.20878. [DOI] [PMC free article] [PubMed] [Google Scholar]
- 6.Foure A, Nordez A, Cornu C. Plyometric training effects on Achilles tendon stiffness and dissipative properties. J Appl Physiol. 2010;109:849–854. doi: 10.1152/japplphysiol.01150.2009. [DOI] [PubMed] [Google Scholar]
- 7.Maffulli N, Testa V, Capasso G, et al. Similar histopathological picture in males with Achilles and patellar tendinopathy. Med Sci Sports Exerc. 2004;36:1470–1475. doi: 10.1249/01.mss.0000139895.94846.8d. [DOI] [PubMed] [Google Scholar]
- 8.Rees JD, Maffulli N, Cook J. Management of tendinopathy. Am J Sports Med. 2009;37:1855–1867. doi: 10.1177/0363546508324283. [DOI] [PubMed] [Google Scholar]
- 9.Gardner K, Arnoczky SP, Caballero O, Lavagnino M. The effect of stress-deprivation and cyclic loading on the TIMP/MMP ratio in tendon cells: an in vitro experimental study. Disabil Rehabil. 2008;30:1523–1529. doi: 10.1080/09638280701785395. [DOI] [PubMed] [Google Scholar]
- 10.Sun HB, Andarawis-Puri N, Li Y, et al. Cycle-dependent matrix remodeling gene expression response in fatigue-loaded rat patellar tendons. J Orthop Res. 2010 doi: 10.1002/jor.21132. In Press. [DOI] [PMC free article] [PubMed] [Google Scholar]
- 11.Andarawis-Puri N, Sereysky JB, Jepsen KJ, Flatow EL. The relationships between cyclic fatigue loading, changes in initial mechanical properties, and the in vivo temporal mechanical response of the rat patellar tendon. J Biomech. doi: 10.1016/j.jbiomech.2011.10.008. In press. [DOI] [PMC free article] [PubMed] [Google Scholar]
- 12.Fung DT, Wang VM, Andarawis-Puri N, et al. Early response to tendon fatigue damage accumulation in a novel in vivo model. J Biomech. 43:274–279. doi: 10.1016/j.jbiomech.2009.08.039. [DOI] [PMC free article] [PubMed] [Google Scholar]
- 13.Fung DT, Wang VM, Laudier DM, et al. Subrupture tendon fatigue damage. J Orthop Res. 2009;27:264–273. doi: 10.1002/jor.20722. [DOI] [PMC free article] [PubMed] [Google Scholar]
- 14.Fung DT, Wang VM, Andarawis-Puri N, et al. Early response to tendon fatigue damage accumulation in a novel in vivo model. J Biomech. 2010;43:274–279. doi: 10.1016/j.jbiomech.2009.08.039. [DOI] [PMC free article] [PubMed] [Google Scholar]
- 15.StatSoft I. Electronic Statistics Textbook. Tulsa, OK: StatSoft; 2011. WEB: http://www.statsoft.com/textbook/ [Google Scholar]
- 16.Andarawis-Puri N, Ricchetti ET, Soslowsky LJ. Rotator cuff tendon strain correlates with tear propagation. J Biomech. 2009;42:158–163. doi: 10.1016/j.jbiomech.2008.10.020. [DOI] [PMC free article] [PubMed] [Google Scholar]
- 17.Sun HB, Andarawis-Puri N, Li Y, et al. Cycle-dependent matrix remodeling gene expression response in fatigue-loaded rat patellar tendons. J Orthop Res. doi: 10.1002/jor.21132. In Press. [DOI] [PMC free article] [PubMed] [Google Scholar]
- 18.Eriksen HA, Pajala A, Leppilahti J, Risteli J. Increased content of type III collagen at the rupture site of human Achilles tendon. J Orthop Res. 2002;20:1352–1357. doi: 10.1016/S0736-0266(02)00064-5. [DOI] [PubMed] [Google Scholar]
- 19.Birk DE, Mayne R. Localization of collagen types I, III and V during tendon development. Changes in collagen types I and III are correlated with changes in fibril diameter. Eur J Cell Biol. 1997;72:352–361. [PubMed] [Google Scholar]
- 20.Oshiro W, Lou J, Xing X, et al. Flexor tendon healing in the rat: a histologic and gene expression study. J Hand Surg Am. 2003;28:814–823. doi: 10.1016/s0363-5023(03)00366-6. [DOI] [PubMed] [Google Scholar]
- 21.Koskinen SO, Heinemeier KM, Olesen JL, et al. Physical exercise can influence local levels of matrix metalloproteinases and their inhibitors in tendon-related connective tissue. J Appl Physiol. 2004;96:861–864. doi: 10.1152/japplphysiol.00489.2003. [DOI] [PubMed] [Google Scholar]
- 22.Bramono DS, Richmond JC, Weitzel PP, et al. Matrix metalloproteinases and their clinical applications in orthopaedics. Clin Orthop Relat Res. 2004:272–285. doi: 10.1097/01.blo.0000144166.66737.3a. [DOI] [PubMed] [Google Scholar]
- 23.Black RA. TIMP3 checks inflammation. Nat Genet. 2004;36:934–935. doi: 10.1038/ng0904-934. [DOI] [PubMed] [Google Scholar]
- 24.Arnoczky SP, Lavagnino M, Egerbacher M, et al. Loss of homeostatic strain alters mechanostat “set point” of tendon cells in vitro. Clin Orthop Relat Res. 2008;466:1583–1591. doi: 10.1007/s11999-008-0264-x. [DOI] [PMC free article] [PubMed] [Google Scholar]
- 25.Lavagnino M, Arnoczky SP, Gardner K. In situ deflection of tendon cell-cilia in response to tensile loading: an in vitro study. J Orthop Res. 29:925–930. doi: 10.1002/jor.21337. [DOI] [PubMed] [Google Scholar]
- 26.Waggett AD, Benjamin M, Ralphs JR. Connexin 32 and 43 gap junctions differentially modulate tenocyte response to cyclic mechanical load. Eur J Cell Biol. 2006;85:1145–1154. doi: 10.1016/j.ejcb.2006.06.002. [DOI] [PubMed] [Google Scholar]
Associated Data
This section collects any data citations, data availability statements, or supplementary materials included in this article.


