Abstract
Damage accumulation underlies tendinopathy. Animal models of overuse injuries do not typically control loads applied to the tendon. Our in vivo model in the rat patellar tendon allows direct control of the loading applied to the tendon. Despite this advantage, natural variation among tendons results in different amounts of damage induced by the same loading protocol. Our objectives were to (1) assess changes in the initial mechanical parameters (hysteresis, stiffness of the loading and unloading load-displacement curves, and elongation) after fatigue loading to identify parameters that are indicative of the induced damage, and (2) evaluate the relationships between these identified initial damage indices with the stiffness 7 day after loading. Left patellar tendons of adult, female retired breeder, Sprague-Dawley rats (n = 68) were fatigue loaded per our previously published in vivo fatigue loading protocol. To induce a range of damage, fatigue loading consisted of either 5, 100, 500 or 7200 cycles that ranged from 1 N to 40 N. Diagnostic tests were applied before and immediately after fatigue loading, and after 45 min of recovery to deduce recoverable and non-recoverable changes in initial damage indices. Relationships between these initial damage indices and the 7-day stiffness (at sacrifice) were determined. Day-0 hysteresis, loading and unloading stiffness exhibited cycle-dependent changes. Initial hysteresis loss correlated with the 7-day stiffness. k-means cluster analysis demonstrated a relationship between 7-day stiffness and day-0 hysteresis and unloading stiffness. This analysis also separated samples that exhibited low from high damage in response to both high or low number of cycles; a key delineation for interpretation of the biological response in future studies. Identifying initial parameters that reflect the induced damage is critical since the ability of the tendon to repair depends on the damage induced and the number of applied loading cycles.
Keywords: Tendon fatigue damage, Non-recoverable damage, Hysteresis, Stiffness, Cluster analysis
1. Introduction
Tendinopathies leading to tendon rupture are common and debilitating clinical problems. Degeneration in ruptured tendons and matrix disorganization in macroscopically ‘healthy’ tendons suggest pre-rupture damage accumulation (Kannus and Jozsa, 1991; Tallon et al., 2001). Consequently, animal models have been used to investigate the response of the tendon to overuse or cyclic loading (Wang et al., 1995; Ker et al., 2000; Schechtman and Bader, 2002). Chronic injury from treadmill running, muscle stimulation, and repeated reaching tasks have shown histological and mechanical evidence of degeneration (Backman et al., 1990; Soslowsky et al., 2000; Nakama et al., in press). Despite insight gained from these models, their inability to control the loads applied directly to the tendon may introduce confounding variability.
We have previously developed and utilized an in vivo model of fatigue damage accumulation in the rat patellar tendon (Fung et al., 2010). Briefly, the rat patellar tendon was chosen because: (1) the rat is a small animal that has been used to investigate tendon biomechanics; (2) the patellar tendon can be directly loaded without direct instrumentation of the tendon; and (3) the patellar tendon exhibits clinical tendinopathy. Our model allows us to accurately control the loading applied to the tendon and titrate input parameters such as number of cycles, loading magnitude, and loading frequency to investigate specific clinical conditions. Despite improvement gained from controlling the load directly applied to the tendon, animal-to-animal variation in tendon size and strength results in varying amounts of damage induced by the same fatigue loading protocol. We expect that the response of the tendon to fatigue loading reflects the additive effect of the number of applied cycles to induce damage and the resulting amount of induced damage, suggesting that due to natural variation between animals, both of these aspects should be considered in interpreting the response of the tendon to fatigue loading. However, little is known about the relationships between applied number of fatigue loading cycles, initial recoverable, and non-recoverable changes in mechanical properties and the mechanical properties of the tendon at a later time point. Therefore, the objectives of this study were to (1) assess the relationship between the applied number of fatigue loading cycles and the recoverable (transient effect of loading) and non-recoverable (damaging to the matrix) changes in initial mechanical parameters (damage indices) after fatigue loading to identify parameters that are indicative of the amount of damage induced within the tendon, and (2) evaluate the relationship between the number of applied fatigue loading cycles and initial damage indices with the mechanical response 7 days after fatigue loading. We hypothesized that (H1): Non-recoverable changes in hysteresis, tendon length, stiffness of the loading and unloading load-displacement curves and measures characterizing the toe-region (initial mechanical parameters) will depend on the number of applied fatigue cycles; (H2): The stiffness 7 day after fatigue loading will correlate with the amount of initial induced damage, as indicated by the damage indices.
2. Methods
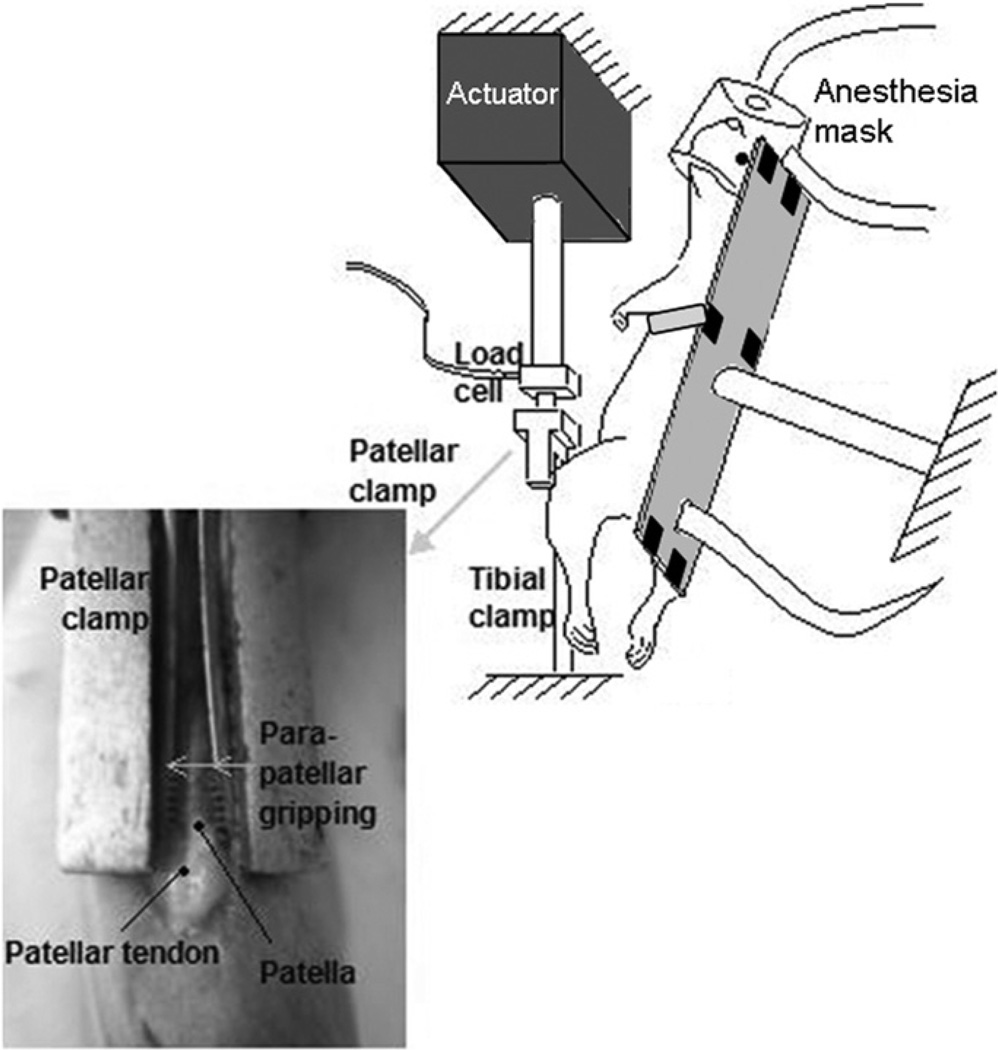
Following IACUC approval, adult, female retired breeder, Sprague-Dawley rats (n = 68) (Charles River Laboratories, Ltd., Wilmington, MA) were anesthetized with isoflurane (2–3% by volume, 0.4 L/min) and their left patellar tendons (PT) were exposed (Fung et al., 2010). Under aseptic conditions, a clamp fixed the tibia at ~30° knee flexion. A clamp gripped and connected the patella to a 50-lb load cell and actuator of a servo-hydraulic loading system, allowing loading of the PT without contact with the tendon (Fig. 1). The PT was fatigue loaded (Fig. 2) while continuously hydrated with sterile phosphate buffered saline solution. Clamps were removed and incisions were sutured with 6–0 prolene. Analgesia (Buprenex) was administered and rats resumed cage activity.
Fig. 1.
Schematic of experimental setup. Grips connect the patella to an Instron testing machine allowing fatigue loading of the patellar tendon without direct instrumentation with the tendon.
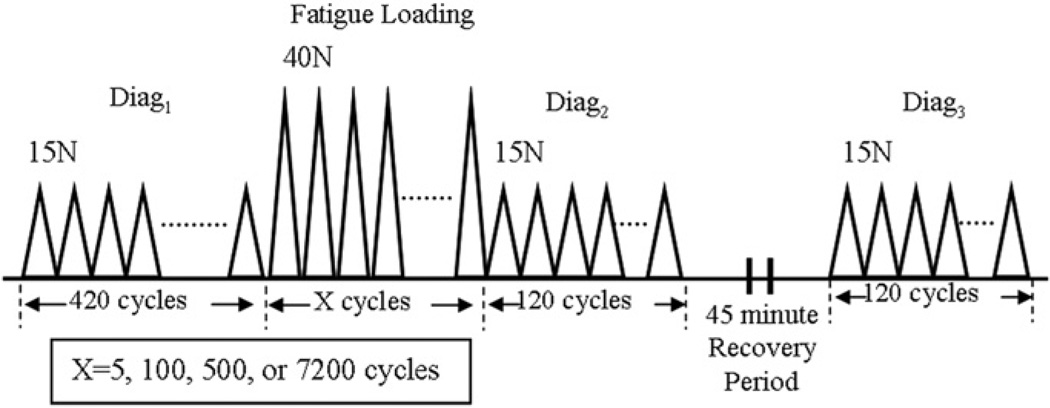
Fig. 2.
Fatigue loading protocol (haversine waveform at 1 Hz). A diagnostic test is applied (diag1) for 420 cycles between 1 N and 15 N. Fatigue loading then follows for x cycles between 1 N and 40 N (x = 5, 100, 500, or 7200). A second diagnostic test (diag2) is then applied for 120 cycles, followed by 45 min recovery, then a final diagnostic (diag3) test.
2.1. Fatigue loading protocol
Our previously described fatigue loading protocol was adapted for this study (Fig. 2) (Fung et al., 2009a,b; Fung et al., 2010). Briefly, a diagnostic test consisting of 420 cycles from 1 N to 15 N was applied (diag1). Fatigue loading, consisting of x cycles from 1 N to 40 N, where x was either 5 (n = 15), 100 (n = 15), 500 (n = 16), or 7200 (n = 16), was then applied. Rats were randomly assigned into a fatigue loading group. A diagnostic test similar to diag1, but consisting of 120 cycles was then applied (diag2). The tendon was unloaded, allowed a 45 min recovery, and subjected to a diagnostic (diag3) that was identical to diag2. A haversine waveform and a rate of 1 Hz was consistently used.
2.2. Initial recoverable and non-recoverable changes in mechanical parameters
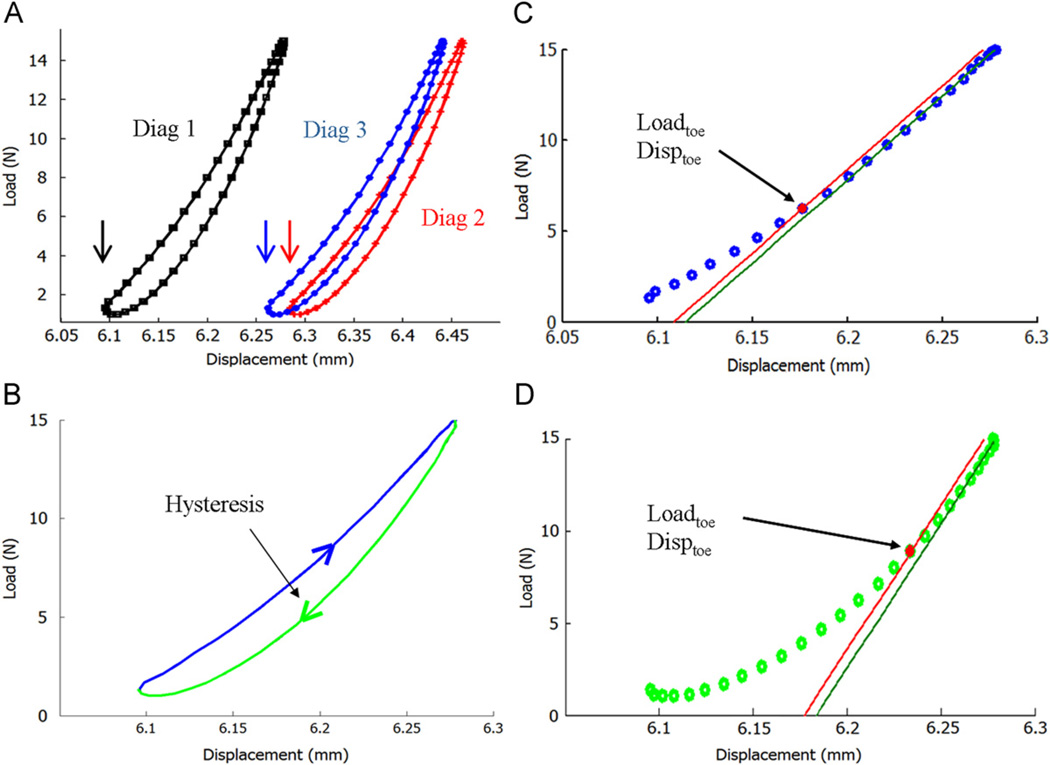
For each diagnostic test, the last 10 cycles of the load-displacement curves were isolated for analysis. Non-recoverable changes were assessed after allowing transient effects to dissipate, by comparing the average properties from the last 10 cycles in diag3 to those from diag1. Recoverable changes were assessed by comparing the average properties from the last 10 cycles of diag2 to those from diag3. Hysteresis, tendon elongation, stiffness of the loading and unloading curves, and the change in load and displacement marking the end of the toe region (loadtoe and disptoe) were evaluated. Tendon elongation was deduced from the change in initial actuator position in the last 10 cycles of each diagnostic test (Fig. 3). The loading stiffness (EL) and unloading stiffness (EU) were calculated from a line fit to the linear portion of the curve (top 30% and bottom 50% of the loading and unloading curves, respectively). The y-intercept of the fitted line was shifted by −0.1%, and its intersection with the curve marked the end of the toe region (Fig. 3). The load and displacement at the intersection point between the shifted line and the curve identified the loadtoe and disptoe (Fig. 3). This method of identifying the toe region is similar to methods in the literature that have been used to identify the yield point (Ucar et al., 2011). In addition, unlike bi-linear fits, the current method does not rely on any initial assumptions regarding the shape of the curve, which was desirable since the impact of different levels of damage on the shape of the load-displacement curves was unknown. The ratio of the unloading and loading stiffness was calculated as D = 1 − EU/EL (Jepsen and Davy, 1997). For each cycle group, difference in mechanical parameters between diagnostics was assessed with repeated measures ANOVA and Bonferroni post-hoc tests. If a parameter exhibited a non-recoverable change, the non-recoverable change for each group was calculated (relationship between diag3 and diag1) and compared between fatigue loading groups with a one-way ANOVA and Bonferroni post-hoc tests.
Fig. 3.
(A) For each diagnostic test, the last 10 cycles of the load-displacement curves were isolated. Change in tendon length was deduced from the change in actuator position at the start of the last 10 cycles (marked by arrows). (B) Average hysteresis was calculated. (C) The loading and (D) unloading curves were separated. A line was fit to the linear region and its y-intercept was shifted by −0.1% to mark the load and displacement corresponding to the end of the toe region and determine the stiffness.
2.3. Relationship between number of cycles, day-0 mechanical parameters, and 7-day stiffness
Rats were sacrificed 7 days after loading. The quadriceps-patella-PT-tibia complexes were harvested (n = 15/primary phase group (5, 100, and 500 cycles) and n = 8/secondary phase group (7200 cycles)) and loaded to failure at a strain rate of 0.3%/sec. The remaining animals were used for a different study after sacrifice.
The 7-day stiffness of the primary and secondary phase tendons was first compared using a t-test, without accounting for initial mechanical parameters. This analysis was conducted to evaluate the temporal response of the tendon in the context of the initial number of cycles applied to induce damage; the most common way of assessing the temporal response of the tendon. Next, using a Pearson correlation, we assessed the relationship between the 7-day stiffness with the day-0 non-recoverable changes in mechanical parameters, disregarding the number of cycles.
Finally, we evaluated the relationship between the initial induced damage (non-recoverable change in initial parameters) and the 7-day stiffness, and assessed the results taking into account the number of applied fatigue loading cycles. We expected the following outcomes: (1) a low number of cycles (primary phase) will result in a low amount of induced damage, (2) a high number of cycles (secondary phase) will result in a high amount of induced damage, and (3) a high number of cycles will result in a low amount of induced damage. We utilized k-means cluster analysis to separate the data into 3 clusters (reflective of the expected 3 outcomes). Intuitively outcomes 1 and 2 are expected. However variability between animals results in some tendons being more resistive to the accumulation of damage than other tendons, leading to the scenario described by the third outcome. While we expect that the behavior of most tendons will be described by outcomes 1 and 2, cluster analysis makes it possible to separate out tendons that are naturally more resistive to damage or are likely to accumulate great amounts of damage despite a low number of applied cycles. k-means cluster analysis iteratively assigns each data point into a cluster, such that the sum of distances from all points within a cluster to its centroid is minimized (StatSoft, 2011). Through this iterative process, clusters are modified so as to minimize the variability within each cluster and maximize differences between clusters. Each cluster was to include a minimum of 3 data points; otherwise, the initial damage parameter being evaluated for clustering the 7-day stiffness was dismissed. A Kruskal–Wallis with post-hoc Dunn’s multiple comparison test was used to compare the clusters for each initial damage parameter and its corresponding 7-day stiffness. In addition, contingency tables demonstrating the percentage of tendons in each cluster that were fatigue loaded within the primary or secondary phase was tabulated, and Chi2 tests were performed. Statistical significance, denoted by a ‘*’, was set at p ≤ 0.05. A statistical trend, denoted by ‘#’, was set at p ≤ 0.1.
3. Results
3.1. Initial mechanical parameters assessed after fatigue loading
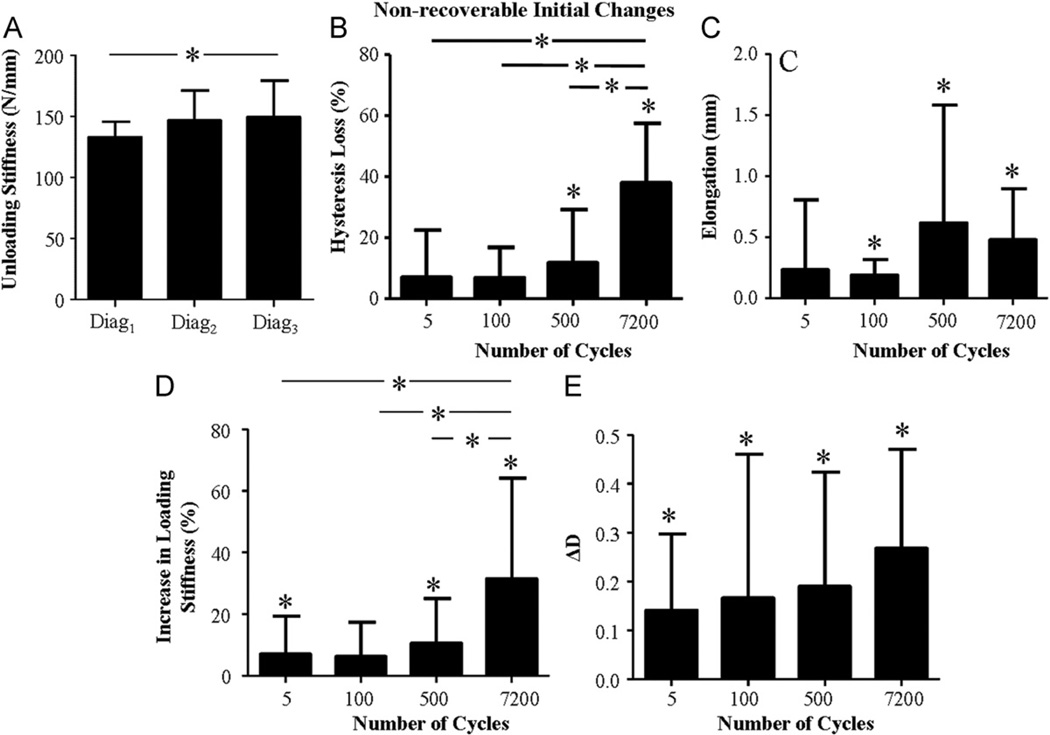
For all groups, no significant differences were found between diag3 and diag2, (recoverable) in any day-0 parameter evaluated (except disptoe for the 5 cycle group). However, a significant difference between diag3 and diag1 (non-recoverable) was found in hysteresis, elongation, loading, and unloading stiffness, disptoe (for the 5 cycle group only) and D (non-recoverable D will be denoted by ΔD) (Fig. 4). No significant non-recoverable changes were found in loadtoe for any cycle number group. Accordingly, for the remainder of this manuscript, changes in initial mechanical parameters refer to non-recoverable changes. Supporting H1, the loss in hysteresis and the increase in loading stiffness were significantly higher for tendons that were fatigue loaded for a number of cycles within the secondary than primary phase. The increase in unloading stiffness was significant only for the 7200 cycle group. Contrary to H1, tendon elongation, and ΔD were not sensitive to the number of fatigue loading cycles.
Fig. 4.
Increase in unloading stiffness was observed for 7200 cycles only (A). Hysteresis loss (B) and increase in loading stiffness (D) were cycle dependent but elongation (C) and ΔD (E) were not. A ‘*’ above a bar indicates a significant non-recoverable change for the fatigue loading group. Significant differences between groups are denoted by a bar with a ‘*’.
3.2. Relationships among initial mechanical parameters
Hysteresis loss significantly correlated with ΔD and the increase in loading and unloading stiffness (Table 1). The increase in loading stiffness significantly correlated with the increase in unloading stiffness and ΔD (Table 1). Elongation did not correlate with any initial mechanical parameter.
Table 1.
Correlation between initial mechanical parameters.
| Elongation | Loading stiffness (%) |
Unloading stiffness (%) |
ΔD (D3−D1) |
|
|---|---|---|---|---|
| Hysteresis | NS | p < 0.001 | p < 0.001 | p < 0.001 |
| R2 = 0.69 | R2 = 0.42 | R2 = 0.25 | ||
| m = 0.77 | m = 0.86 | m = 46.21 | ||
| Elongation | NS | NS | NS | |
| Loading stiffness (%) | p < 0.001 | p < 0.001 | ||
| R2 = 0.73 | R2 = 0.29 | |||
| m = 0.6 | m = 0.01 | |||
| Unloading stiffness (%) | NS |
NS: non-significant; m slope.
3.3. 7-Day stiffness compared between primary and secondary phase fatigue loading
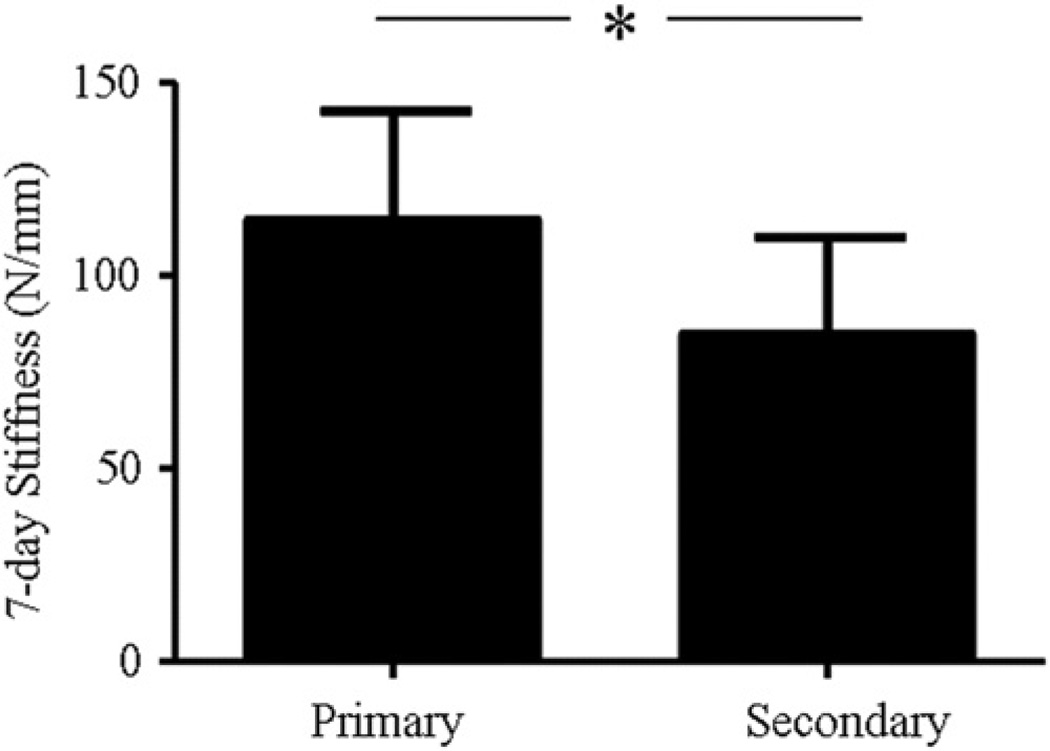
The 7-day stiffness of tendons that were fatigue loaded within the primary phase was significantly higher than that of those fatigue loaded within the secondary phase (Fig. 5).
Fig. 5.
7-day stiffness of tendons that were fatigue loaded within the primary phase was significantly higher than that of tendons that were fatigue loaded within the secondary phase.
3.4. Correlations between 7-day stiffness and initial mechanical parameters
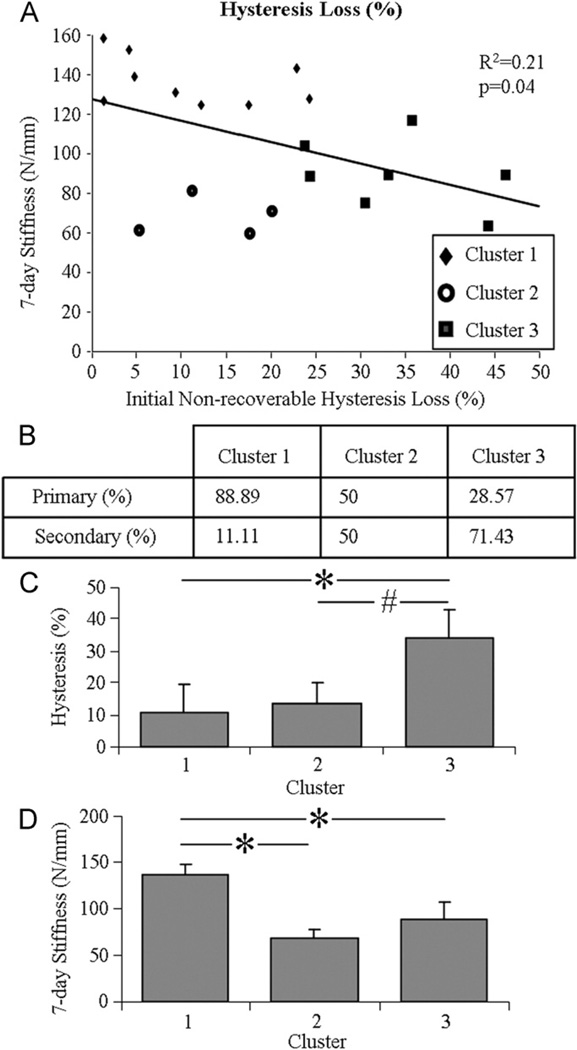
Tendons that exhibited an initial hysteresis loss (86.96% of the data) significantly correlated (negative) with the 7-day stiffness (Fig. 6A). No other correlations between initial mechanical parameters and 7-day stiffness were found.
Fig. 6.
7-day stiffness significantly correlated with initial non-recoverable hysteresis loss (A). Shown composition of tendons that were fatigue loaded within the primary and secondary phase of each cluster (B), day-0 hysteresis loss (C) and coinciding 7-day stiffness (D).
3.5. 7-Day stiffness relative to initial mechanical parameters and number of fatigue cycles
Comparing clusters 1 and 3 from k-means cluster analysis suggested that a tendon that exhibits an increase in day-0 hysteresis loss also exhibits a decrease in 7-day stiffness (Fig. 6C and D). Interestingly, hysteresis loss exhibited by tendons in cluster 2 did not differ from that of tendons in cluster 1,despite a significantly lower 7-day stiffness that was similar to the stiffness of tendons in cluster 3. The contingency table (Fig. 6B) shows a decreasing composition of tendons that were fatigue loaded to a number of cycles within the primary phase (and conversely an increasing composition of tendons from the secondary phase) going from cluster 1 to 3 (p = 0.05).
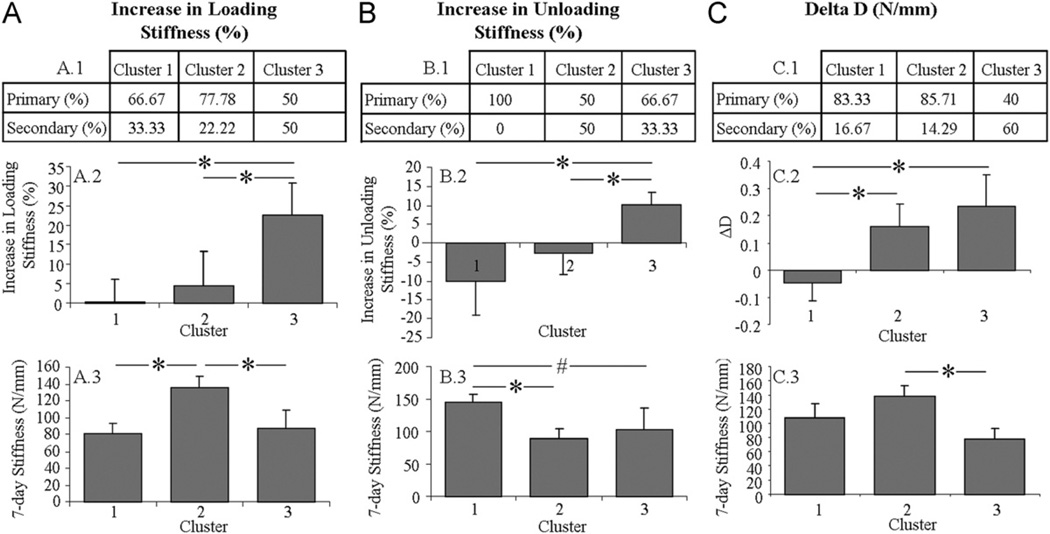
Similarly, tendons in cluster 3 exhibited significantly higher day-0 unloading stiffness and lower 7-day stiffness than those in cluster 1 (Fig. 7B.2 and B.3). Interestingly, day-0 unloading stiffness exhibited by tendons in cluster 2 did not differ from that of tendons in cluster 1 despite a lower 7-day stiffness that was similar to the stiffness of tendons in cluster 3. The contingency table (Fig. 7B.1) shows a similar composition of tendons that were fatigue loaded within the primary phase between clusters 2 and 3 (p > 0.05), but a composition of tendons strictly from the primary phase in cluster 1.
Fig. 7.
Cluster analysis of 7-day stiffness with day-0 loading stiffness (A), unloading stiffness (B), and ΔD (C). Shown composition of tendons that were fatigue loaded within the primary and secondary phase of each cluster (A.1, B.1, C.1), day-0 loading stiffness (A.2), unloading stiffness (B.2) and ΔD (C.2) and coinciding 7-day stiffness (A.3, B.3, and C.3).
Despite a significantly higher loading stiffness for tendons in cluster 3 than 1, these clusters did not differ in 7-day stiffness or composition of tendons from the primary and secondary phase of fatigue loading (Fig. 7A). Tendons in cluster 2 did not differ from tendons in cluster 1 in day-0 loading stiffness or composition of tendons from the primary and secondary phase of fatigue loading but exhibited significantly higher 7-day stiffness. Similarly, tendons in cluster 3 exhibited significantly higher day-0 loading stiffness than tendons in clusters 1 and 2 (with a similar composition of tendons) but exhibited significantly lower 7-day stiffness from cluster 2 only. Similar findings were observed for ΔD (Fig. 7C).
k-means clustering of the 7-day stiffness by the day-0 elongation did not meet the criteria of maintaining a minimum of 3 points per cluster (data not shown).
4. Discussion
We have identified initial damage parameters that serve as indices of the damage induced in the tendon and assessed their effectiveness to cluster the 7-day stiffness. Initial non-recoverable changes were found in hysteresis, loading and unloading stiffness, elongation, and ΔD, suggesting that these parameters could serve as indices of the damage induced in the tendon. For the damage levels induced in this study, the lack of change in the loadtoe and disptoe suggests that these measurements could not serve as indices of the damage level within the range of damage evaluated in this study. Hysteresis, loading, and unloading stiffness were greater for tendons that were fatigue loaded within the secondary than primary phase, but elongation and ΔD were not dependent on the number of fatigue loading cycles, suggesting that accumulation of damage does not affect every damage parameter in a cumulative manner.
Day-0 elongation did not correlate with any other initial damage parameter, suggesting that the responsible matrix changes differ from those that result in changes in other damage parameters. In contrast, loading stiffness and hysteresis correlated with all initial parameters, except elongation. It is likely that correlations between initial mechanical parameters that were individually impacted by the number of applied cycles are driven by their common relationship to the number of cycles. Additionally, the unique relationship between each day-0 parameter and the 7-day stiffness suggests that these parameters may reflect different manifestations of damage.
Tendon elongation suggests increases in strains within the tendon, and increased risk of further injury (Malicky et al., 2002; Andarawis-Puri et al., 2009). This is likely attributable to both loss of the natural collagen fibril crimp and plastic deformation of the fibrils themselves. Loss of hysteresis has been observed for specimens fatigue loaded similarly (Fung et al., 2009a,b), and reflects a loss of viscoelastic dampening, likely due to changes in noncollagenous components in the interfibrillar space (Eliasson et al., 2007) and loss of fibril crimp (leaving the elastic collagen to prominently respond to loading). Elongation and hysteresis loss suggest that a manifestation of damage is loss of the protective natural fibril crimp and viscoelastic dampening. Increases in loading and unloading stiffness reflect changes in the ability of the tendon to bear load and recover after its removal. While surprising, the observed increase in loading stiffness is consistent with the findings by Fung et al. that showed an increase in stiffness for low and moderate fatigue loading and a decrease for high fatigue loading that was attributed to redistribution of the load from damaged to undamaged fibers (Fung et al., 2010). The decrease in unloading stiffness likely reflects an earlier stage of damage wherein greater recovery is occurring because of loading of more taught fibers. The increase in unloading stiffness for the 7200 cycle fatigue loading group indicates impairment in the recoil ability of the tendon and that less deformation is recovered for a given decrement of load.
A significant correlation was observed between the 7-day stiffness and the day-0 hysteresis loss, implying that the relationship between these 2 parameters can be inferred beyond the data experimentally collected. However, the absence of a significant correlation (or the presence of a weak correlation as in the case of day-0 hysteresis) between 7-day stiffness and day-0 parameters supports the need for k-means cluster analysis to discern the complex relationship between these parameters.
Cluster analysis of 7-day stiffness and day-0 hysteresis suggests that day-0 hysteresis predicts the mechanical response of the tendon. In addition to this parameter correlating with the day-7 stiffness, the contingency table showed the expected greater composition of tendons fatigue loaded within the primary phase for clusters exhibiting lower day-0 hysteresis loss and higher 7-day stiffness. The expected minimal induced damage that results from fatigue loading to a low number of cycles, leading to the highest 7-day stiffness is demonstrated by tendons that were fatigue loaded within the primary phase in cluster 1. In contrast, tendons that fell within the secondary phase of fatigue loading in this cluster likely exhibited superior mechanical strength resulting in minimal day-0 induced damage and high 7-day stiffness despite fatigue loading to a high number of cycles. Similarly, the expected maximum induced damage that results from fatigue loading to a high number of cycles, leading to a reduction in 7-day stiffness is demonstrated by tendons that were fatigue loaded within the secondary phase in the third cluster. Interestingly, the third cluster included some tendons that were fatigue loaded within the primary phase, suggesting that these tendons exhibited inferior mechanical properties resulting in greater initially induced damage and lower 7-day stiffness than tendons that were fatigue loaded within the primary phase in cluster 1. The unexpected greater impact of a minimal amount of induced damage on 7-day stiffness is demonstrated by cluster 2. Interestingly, an equal number of tendons that were fatigue loaded within the primary and secondary phases exhibited this behavior. A similar relationship was observed between day-0 unloading stiffness and 7-day stiffness.
Surprisingly, despite a relationship between number of loading cycles and the increase in day-0 loading stiffness, a relationship between the day-0 loading stiffness and the 7-day stiffness was not evident, suggesting that this manifestation of damagemay relate to parameters not evaluated in this study. The 7-day stiffness related to the day-0 ΔD similarly as its relationship with the day-0 loading stiffness, suggesting that this damage parameter may not provide further insight into the amount of induced damage.
The absence of a significant recoverable component in any parameter evaluated (except disptoe for the 5 cycle group) was surprising. It is possible that our fatigue loading protocol results in a negligible viscoelastic component that is dissipated during fatigue loading (possibly explaining the recoverable effect found for 1 parameter for the lowest cycle number group only) and recovered prior to the last 10 cycles of the second diagnostic test. We chose to analyze the last 10 cycles because the response of the tendon was consistent across them.
The 7-day time point was chosen based on the prior work, which showed a transient molecular response that peaked 7 days after fatigue loading and a stiffness loss that occurred immediately and was not recovered for at least 6 weeks (Fung et al., 2009a,b). This suggests that the biological response during these 7 days (differences in repair) will not likely result in observable differences in mechanics, and therefore we do not expect differences in repair during this time course to confound the relationships determined between the initial induced damage and the 7-day stiffness. However, for longer times after fatigue loading, we expect that the rates of repair (that will lead to different outcomes in mechanical strength) will be affected by the amount of damage initially induced in conjunction with the number of applied fatigue cycles. In addition, in this study, non-recoverable day-0 damage was defined as the changes in initial parameters that were not recovered after 45 min. Our evaluation of initial structural changes was limited to gross assessment. Future studies will evaluate the relationship between initial day-0 damage parameters that were identified in this study, and day-0 and 7-day microscopic structural changes in the tendon. Another limitation to this study is that ethical constraints limited the possible time for recovery, while keeping the animal under anesthesia, to 45 min (based on the longest fatigue loading group). While we expect that most of the recovery occurs during that time, it is possible that waiting for a significantly longer period of time would result in further recovery.
In conclusion, we have identified initial mechanical parameters that are indicative of different aspects of induced damage and investigated their relationship with the 7-day stiffness. Our data suggests that the initial non-recoverable hysteresis is predictive of the 7-day stiffness. Our findings are critical to understand the response of the tendon to fatigue damage accumulation, since the ability of the tendon to repair will depend on the amount of damage induced and the number of applied cycles. Future studies will evaluate the temporal molecular response of the tendon in relation to initial damage parameters.
Acknowledgments
This study was supported by the National Institutes of Health (AR052743 and AR058123).
Footnotes
Conflict of interest statement
We have no conflicts of interest to disclose.
References
- Andarawis-Puri N, Ricchetti ET, Soslowsky LJ. Rotator cuff tendon strain correlates with tear propagation. Journal of Biomechanics. 2009;42(2):158–163. doi: 10.1016/j.jbiomech.2008.10.020. [DOI] [PMC free article] [PubMed] [Google Scholar]
- Backman C, Boquist L, Friden J, Lorentzon R, Toolanen G. Chronic achilles paratenonitis with tendinosis: an experimental model in the rabbit. Journal of Orthopaedic Research. 1990;8(4):541–547. doi: 10.1002/jor.1100080410. [DOI] [PubMed] [Google Scholar]
- Eliasson P, Fahlgren A, Pasternak B, Aspenberg P. Unloaded rat achilles tendons continue to grow, but lose viscoelasticity. Journal of Applied Physiology. 2007;103(2):459–463. doi: 10.1152/japplphysiol.01333.2006. [DOI] [PubMed] [Google Scholar]
- Fung DT, Li Y, Basta-Pljakic J, Laudier D, Sun HB, Jepsen KJ, Schaffler MB, Flatow EL. Tendon response to in vivo fatigue damage. Transactions of Orthopaedic Research Society. 2009a;34:0048. doi: 10.1002/jor.20722. [DOI] [PMC free article] [PubMed] [Google Scholar]
- Fung DT, Wang VM, Andarawis-Puri N, Basta-Pljakic J, Li Y, Laudier DM, Sun HB, Jepsen KJ, Schaffler MB, Flatow EL. Early response to tendon fatigue damage accumulation in a novel in vivo model. Journal of Biomechanics. 2010;43(2):274–279. doi: 10.1016/j.jbiomech.2009.08.039. [DOI] [PMC free article] [PubMed] [Google Scholar]
- Fung DT, Wang VM, Laudier DM, Shine JH, Basta-Pljakic J, Jepsen KJ, Schaffler MB, Flatow EL. Subrupture tendon fatigue damage. Journal of Orthopaedic Research. 2009b;27(2):264–273. doi: 10.1002/jor.20722. [DOI] [PMC free article] [PubMed] [Google Scholar]
- Jepsen KJ, Davy DT. Comparison of damage accumulation measures in human cortical bone. Journal of Biomechanics. 1997;30(9):891–894. doi: 10.1016/s0021-9290(97)00036-5. [DOI] [PubMed] [Google Scholar]
- Kannus P, Jozsa L. Histopathological changes preceding spontaneous rupture of a tendon. A controlled study of 891 patients. Journal of Bone and Joint Surgery (American) 1991;73(10):1507–1525. [PubMed] [Google Scholar]
- Ker RF, Wang XT, Pike AV. Fatigue quality of mammalian tendons. Journal of Experimental Biology. 2000;203(Pt 8):1317–1327. doi: 10.1242/jeb.203.8.1317. [DOI] [PubMed] [Google Scholar]
- Malicky DM, Kuhn JE, Frisancho JC, Lindholm SR, Raz JA, Soslowsky LJ. Neer Award 2001: nonrecoverable strain fields of the anteroinferior glenohumeral capsule under subluxation. Journal of Shoulder and Elbow Surgery. 2002;11(6):529–540. doi: 10.1067/mse.2002.127093. [DOI] [PubMed] [Google Scholar]
- Nakama LH, K B, King S, Abrahamsson DM. Rempel. Evidence of tendon microtears due to cyclical loading in an in vivo tendinopathy model. Journal of Orthopaedic Research. doi: 10.1016/j.orthres.2005.03.006. (in press). [DOI] [PubMed] [Google Scholar]
- Schechtman H, Bader DL. Fatigue damage of human tendons. Journal of Biomechanics. 2002;35(3):347–353. doi: 10.1016/s0021-9290(01)00177-4. [DOI] [PubMed] [Google Scholar]
- Soslowsky LJ, Thomopoulos S, Tun S, Flanagan CL, Keefer CC, Mastaw J, Carpenter JE. Neer Award 1999 Overuse activity injures the supraspinatus tendon in an animal model: a histologic and biomechanical study. Journal of Shoulder and Elbow Surgery. 2000;9(2):79–84. [PubMed] [Google Scholar]
- StatSoft I. Electronic Statistics Textbook. Tulsa, OK: StatSoft; 2011. 〈 http://www.statsoft.com/textbook/〉. [Google Scholar]
- Tallon C, Maffulli N, Ewen SW. Ruptured achilles tendons are significantly more degenerated than tendinopathic tendons. Medicine and Science in Sports and Exercise. 2001;33(12):1983–1990. doi: 10.1097/00005768-200112000-00002. [DOI] [PubMed] [Google Scholar]
- Ucar Y, Brantley WA, Johnston WM, Dasgupta T. Mechanical properties, fracture surface characterization, and microstructural analysis of six noble dental casting alloys. Journal of Prosthetic Dentistry. 2011;105(6):394–402. doi: 10.1016/S0022-3913(11)60081-4. [DOI] [PubMed] [Google Scholar]
- Wang XT, Ker RF, Alexander RM. Fatigue rupture of wallaby tail tendons. Journal of Experimental Biology. 1995;198(Pt 3):847–852. doi: 10.1242/jeb.198.3.847. [DOI] [PubMed] [Google Scholar]


