

Abstract
The Wistar–Kyoto (WKY) rat exhibits physiological and behavioral similarities to endophenotypes of human depression. In the forced swim test (FST), a wel-characterized antidepressant-reversible test for behavioral despair in rodents, WKYs express characteristics of behavioral despair; increased immobility, and decreased climbing. To map genetic loci linked to behavior in the FST, we conducted a quantitative trait loci (QTL) analysis of the segregating F2 generation of a WKY · Fisher 344 (F344) reciprocal intercross. Using linear-model-based genome scans to include covariate (sex or lineage) by-QTL interaction effects, four significant QTL influencing climbing behavior were identified. In addition, we identified three, seven, and two suggestive QTL for climbing, immobility, and swimming, respectively. One of these loci was pleiotropic, affecting both immobility and climbing. As found in human linkage studies, several of these QTL showed sex-and/or lineage-dependent effects. A simultaneous search strategy identified three epistatic locus pairs for climbing. Multiple regression analysis was employed to characterize the joint contributions of these QTL and to clarify the sex-and lineage-dependent effects. As expected for complex traits, FST behavior is influenced by multiple QTL of smal effect, each contributing 5%–10%, accounting for a total 10%–30% of the phenotypic variance. A number of loci mapped in this study share overlapping candidate regions with previously identified emotionality QTL in mice as wel as with susceptibility loci recognized by linkage or genome scan analyses for major depression or bipolar disorder in humans. The presence of these loci across species suggests that these QTL may represent universal genetic factors contributing to mood disorders.
Animal models that mirror aspects of complex human disorders, such as depression, are invaluable tools for investigating the role of genetic and environmental factors that may influence the development or nature of these disorders. In the current study, we created a segregating F2 generation by reciprocaly crossing a valid genetic rat model of depression (the WKY rat) with a control rat strain. The population was tested in the forced swim test (FST), the oldest and most widely used model of depressive behavior (Cryan et al. 2002). Our goals were to identify genetic loci involved in depression in our rat model and to determine if any of these loci acted in a sex-specific or lineage-specific manner. To identify common genetic loci for depressive behavior across species, we also compared these loci with those found for emotionality in mice and depressive disorders in humans.
In the FST, immobility is considered to represent “behavioral despair” (Porsolt et al. 1977, 1978) and/ or passive coping behavior (Armario et al. 1988; Marti and Armario 1993), while climbing (vigorous, verticaly oriented swimming) represents escape-oriented, active coping behavior (Lucki 1997). Antidepressant drugs reliably reduce immobility and increase swimming or climbing in this test (Cryan et al. 2002; Lucki 1997). The inbred Wistar–Kyoto (WKY) rat, a genetic model for depressive disorders (Pare 1989b; Solberg et al. 2003), exhibits depressive-like behavior in this and other relevant tests such as the open field test and the learned helplessness paradigm (e.g., Pare 1989b; Redei et al. 2001). WKY males, but not females, exhibit increased immobility, while both sexes show less climbing than other rat strains, including the Fischer344 (F344), an inbred strain behavioraly, physiologicaly, and geneticaly distinct from the WKY (Jacob et al. 1995; Pare 1989a; Sebkhi et al. 1999; Solberg et al. 2003). We have recently reported that FST behavior is heritable in a WKY · F344 cross (Solberg et al. 2003, Ahmadiyeh 2003), suggesting that FST behaviors are under genetic control.
Quantitative trait loci (QTL) analysis is frequently used to identify chromosomal regions implicated in complex behavioral traits (Lander and Schork 1994). Complete genome maps and advanced molecular tools make the positional candidate method of identifying genes from QTL analyses increasingly more feasible (Flint and Mott 2001; McPeek 2000). In fact, QTL analysis in animal models of disease has led to gene identification for complex diseases such as diabetes, asthma, and blood pressure (Korstanje and Paigen 2002).
The present study aims to identify chromosomal loci involved in FST immobility, swimming, and climbing behaviors of the WKY rat using a reciprocal intercross design and QTL analysis of F2 generation males and females. This approach alows us to consider sex-and lineage-specific effects of each locus, making it possible to find loci resembling the sex-specific linkages and parent-of-origin effects reported in human genetic studies of depression (Zubenko et al. 2002).
Materials and methods
Animals
Al animal experimentation was approved by the Northwestern University Animal Care and Use Committee. Al animals were maintained in a 14:10 light: dark cycle and kept under constant ambient temperature (21 ± 1°C) with food and water available ad libitum. Parental WKY and F344 animals were obtained from Harlan Sprague–Dawley (Indianapolis, IN) and bred reciprocaly (WKY females mated with F344 males and vice versa), pairing one male with two females, to generate 121 Fl animals. Sister–brother breeding of both lineages (WKY mother and F344 mother) of F1s generated 486 F2 generation animals. Pups were weaned at 24 days of age, separated by sex, and housed 3–5 animals per cage. At the time of weaning, 5-mm tail samples were colected for genomic DNA isolation. At 11 weeks of age, animals were weighed and tested in the FST. Two days prior to the FST, al animals were tested in the open field test (OFT) of emotionality for a separate study. In a pilot experiment, where the order of OFT and FST testing was reversed, we determined that OFT testing did not affect subsequent FST behavior (data not shown).
Forced swim test
The FST procedure used was similar to that described by Porsolt et al. (1977). Animals were placed into a glass cylinder (30 cm diameter, 45 cm deep) of 25°C tap water for 15 min. 24 h later, rats were again placed into the cylinder of water for 5 min. Al testing took place between 11:00 and 15:00. Activity during the second swim test was video-recorded for subsequent scoring using a time-sampling technique previously described (Detke et al. 1995) in which behavior was scored as immobility, climbing, or swimming every 5 sec. We have previously shown that immobility in the FST is not related to body weight (Solberg et al. 2003).
Analysis of compositional data
In the 5-min FST an animal is swimming, climbing, or immobile at each time point (scored every 5 sec). Thus, the data for these three measures wil sum to 60. Data that sum to a fixed total are referred to as “compositional” data (Aithchison 2003) and the individual measurements are not independent. We applied a variety of transformations to the data as recommended by Aitchison (2003). Although we obtain roughly similar results, none represented a substantial improvement over simply scanning the three traits individualy.
Results reported here are based on simple logarithmic transforms of the data [log(immobility + 1), log(climbing + 1), and log(61) swimming)] to reduce skewness in the distributions. A three-dimensional scatter plot of the data is shown in Figure 1, where it can be seen that the data occupy a triangular region, or simplex, in the data space. Means and standard deviations of the transformed data are reported in Table 1.
Figure 1.

Three-dimensional scatter plot of log(immobility + 1), log(climbing + 1) and log(61) swimming).
Table 1.
Summary of log-transformed FST measures in the F2 generation
| Trait | Mean ± SD | n |
|---|---|---|
| Immobility | 1.81 ± 0.90 | 482 |
| Climbing | 1.57 ± 0.95 | 482 |
| Swimming | 2.57 ± 0.57 | 482 |
Genotyping
Genomic DNA was extracted from tail samples of F2 animals by phenol-chloroform extraction. One hundred eight SSLP markers polymorphic by at least 2 bp between WKY and F344 strains were chosen from the Rat Genetic Database at the Medical Colege of Wisconsin (http://rgd.mcw.edu) and purchased from Research Genetics (Huntsvile, AL). Percent success rate for al genotypes was 90.2%. Markers were spaced an average of 16 cM (range = 2–27 cM) apart. Markers with inter-strain differences less than 12 bp were amplified in polymerase chain reaction (PCR) reactions of 5 land products separated on 6% polyacrylamide gels, as previously described (Shimomura et al. 2001). Markers with interstrain differences greater than 12 bp were amplified in PCR reactions of 20 μl [2μl l DNA at 50 ng/μl l, 2 μl 10 X PCR buffer, 1.6 μl l dNTP at 1.25 mM, 1.2 μl MgCl2 at 25 mM, 2 μl BSA at 10 mg/ml, 10.7 μl ddH2O, 0.2 μl forward primer (100 μM), 0.2 μl reverse primer (100 μM), and 0.1 μl Taq polymerase as used in the acrylamide procedure] and visualized on agarose gels (NuSieve or GenePure, ISC Bioexpress, Kaysvile, UT) using EtBr staining (12–17-bp difference, 4%; 18 bp or greater, 3%).
Genome scan analysis
We carried out genome scans using the pseudomarker (release 1.02) software package (Sen and Churchil 2001) (http://www.jax.org/staff/churchil/labsite/software/). Significance of QTLs was established by permutation analysis (Churchil and Doerge 1994). Significant QTL exceeded the 0.05 genomewide adjusted threshold and suggestive QTL exceeded the 0.63 genomewide adjusted threshold (Lander and Kruglyak 1995).
A simple genome scan compares two linear models of the data:
| (1) |
| (2) |
where yi are the phenotypes, β0 and β1 are regression coefficients, and εI are normal errors. The index i runs through al individuals in the cross. We allow the QTL, represented by genotypes Qi, to scan over a grid of locations covering the genome and plot a logarithm of the odds (LOD) score to summarize the evidence for a QTL at each location. The LOD score is the difference in log10 likelihood values between models (1) and (2), where the individual model likelihoods are maximized with respect to the regression coefficients. If a trait differs on average between the two sexes but the QTL has the same effect on both males and females, this can be modeled for by including sex as an additive covariate in the genome scan. Including an additive covariate in each of models (1) and (2), we obtain a new pair of linear models:
| (3) |
| (4) |
where Xi is the covariate. A genome scan based on the LOD score contrasting models (3) and (4) accounts for the effects of the covariate. Alternatively, the QTL effect may depend on the state of a covariate. For example, independent of differences in the trait between the sexes, a QTL may have an effect in only one of the sexes. We can allow for covariate dependent QTL effects by using a linear model that includes a QTL-by-covariate interaction term:
| (5) |
To make inferences about covariate-dependent QTL effects, one must consider al three models (3), (4), and (5). One reasonable approach is to scan the QTL position computing the LOD score contrasting model (5) with model (3). This provides a peak LOD score at the most likely position of the QTL. We then compute the change in likelihood between models (4) and (5) at the peak position as a test for the QTL-by-covariate interaction. The secondary test is done at a fixed point and we may use an unadjusted significance threshold based on the chi-square distribution of the standard likelihood ratio statistic converted to the LOD scale.
In this study, we carried out genome scans using sex and lineage and a sex-by-lineage interaction as additive covariates [model (4) - model (3)]. This accounts for average differences among the four groups of rats defined by the combinations of sex and lineage. We ran three additional genome scans with sex, lineage, and sex-by-lineage, respectively, as interactive covariates [model (5) - model (3)]. These scans helped us to identify sex-and lineage-specific effects of QTLs. LOD thresholds (established by permutation analysis) are higher for the interactive genome scans because the hypothesis being tested has more components (degrees of freedom). In each case we computed the contribution from the interaction term alone [model (5) - model (4)] and required that this LOD score should exceed a nominal 0.05 threshold (based on the chi-square distribution) in order to declare a significant covariate-by-QTL interaction.
We also carried out genome scans separately on subpopulations defined by sex or lineage. The shortcoming of this approach is that a QTL may appear to be absent in one subpopulation because the smaller sample size reduces the power to detect the effect. Thus, results cannot be interpreted unambiguously. However, we found these scans to be helpful in the interpretation of the covariate-by-QTL interaction effects.
A simultaneous search strategy (Sen and Churchil 2001; Sugiyama et al. 2002) was employed to examine al possible locus pairs for epistatic interactions between QTL. Significant overall LOD thresholds were determined by permutation analysis (in this case using only 100 permutations). The QTL-by-QTL interaction component of the LOD was assessed at p < 0.001, unadjusted before a significant interaction was declared. We then extended the pairwise search to include covariate-by-QTL-by-QTL interactions using the same strategy as with the single-locus genome scans.
Multiple QTL regression
The various genome scans described above result in overlapping lists of QTLs with indications of which QTLs may interact with sex, with lineage, with sex lineage, or with one another. In order to understand how al of these QTLs contribute simultaneously to the different traits, we collected all main effects and interactions that were indicated as being suggestive or better in the genome scans. This multiple regression analysis was carried out using R/qtl software (Broman et al. 2003) (http://www.biostat.jhsph.edu/kbroman/software). For each trait separately, individual terms were dropped in a backward elimination search until all terms remaining in the model were significant at the p < 0.01 level. Main effects that were included in significant interaction were retained in the model. The result is a somewhat shorter list of QTLs such that, when adjusted for al other QTLs in the model, they still make a substantial contribution. These are the QTLs that we have reported here.
Results
FST behavior in parent, F1 and F2 generation rat
Differences in immobility and climbing behaviors in the FST between parents, F1, and F2 generation rats of a WKY x F344 cross have been reported previously (Solberg et al. 2003). Briefly, WKY males exhibit significantly higher immobility relative to F344 males, whereas no difference is seen in immobility between WKY and F344 females. Both male and female WKYs exhibit significantly lower climbing relative to F344 males and females. While WKY males exhibit significantly more swimming than WKY females, and F344 males exhibit significantly less swimming than F344 females (strain x sex interaction, F1,85 = 7.4, p < 0.01), no significant difference is seen between WKY and F344 males and females for swimming behavior. In the F2 generation, males swim significantly more than females (F1,482 = 16.5, p < 0.001). Parent-of-origin effects are found for climbing in both the F1 and F2 generations, while a parent-of-origin effect is found in the F2 generation for immobility. No parent-of-origin effects were found for swimming in either the F1 or F2 generation. We also reported previously a significant negative correlation between immobility and climbing in F2 generation males and females (Solberg et al. 2003). When separated by both sex and lineage, F2 generation females from a WKY female x F344 male lineage exhibited the greatest negative correlation between log-transformed immobility and climbing (r = −0.71, p< 0.01), followed by females from a F344 female x WKY male lineage (r =−0.57, p < 0.01). F2 generation males also exhibited a significant negative correlation: r = −0.41 and −0.32, p < 0.01 for the WKY female x F344 male and F344 female x WKY male lineages, respectively. These results suggest that immobility and climbing may be under similar genetic control as suggested previously (Lucki 1997) and that this genetic control may be under the influence of parental lineage. A positive correlation is found between log-transformed immobility and swimming. This was higher in females (r = 0.74 and 0.62, p < 0.01) than in males (r = 0.51 and 0.40, p < 0.01) for WKY female x F344 male and F344 female x WKY male lineages, respectively. Interestingly, correlation is found between log-transformed climbing and swimming in males only (r = 0.44 and 0.61 for WKY female x F344 male and F344 female x WKY male lineages, respectively).
Immobility
The distributions for immobility in both the F1 and F2 generations were significantly skewed, with most animals exhibiting low immobility (F344 profile) (Solberg et al. 2003), reflecting the dominance of F344 alleles in this cross.
In the segregating F2 generation of a WKY x F344 cross, there are main effects of both sex (F1, 480 = 13.2, p < 0.001) and lineage (F1,480 = 9.7, p < 0.01) for immobility. We identified three loci (Chrs 3, 5, and 8) with suggestive main effects for immobility using sex lineage as an additive covariate (Table 2, Fig. 2). When analyzed with sex, lineage, or both as interactive covariates, six novel suggestive QTL were identified. Three of these loci (Chrs 9 at 25 cM, 9 at 50 cM, and 16 at 25 cM) were identified using sex as an interactive covariate, one (Chr 16 at 5 cM) with lineage as an interactive covariate, and two (Chrs 2 at 0 cM and 10 at 0 cM) using sex lineage as an interactive covariate (Fig. 2).
Table 2.
Summary of single-marker genome scan results for log(immobility)
| Location (cM) | Peak marker | LOD additivea | LOD trait · sexb | LOD trait · lineagec | LOD trait · sex · lineaged |
|---|---|---|---|---|---|
| Chr 2 at 0 | D2Rat188 | 4.88 | |||
| Chr 3 at 55 | D3Rat71 | 2.43 | 3.03 | ||
| Chr 5 at 95 | D5Rat40 | 3.23 | 4.07 | 3.87 | 4.98 |
| Chr 8 at 20 | D8Rat163 | 2.16 | |||
| Chr 9 at 25 | D9Rat130 | 4.01 | |||
| Chr 9 at 50 | D9Rat67 | 3.26 | |||
| Chr 10 at 0 | D10Rat96 | 4.71 | |||
| Chr 16 at 5 | D16Arb5 | 3.10 | |||
| Chr 16 at 25 | D16Rat75 | 3.16 |
Scans with no interactive covariates have suggestive threshold 2.0, significant threshold 3.3.
Scans with an interactive covariate have suggestive threshold 2.9, significant threshold 4.1.
Scans with an interactive covariate have suggestive threshold 3.0, significant threshold 4.0.
Scans with an interactive covariate have suggestive threshold 4.6, significant threshold 6.2.
Figure 2.

LOD plots of genome scans for log (immobility). Chromosome location is on the X axis, LOD score is on the Y axis. The red line indicates significant and the green line indicates the suggestive threshold. (A). Scan for main effects with sex and lineage as additive covariates. (B). Scan with sex as interactive and lineage as additive covariate. (C). Scan for main effects with lineage as interactive and sex as additive covariate. (D). Scan for main effects with sex and lineage as interactive covariates. Pink trace in scans B–D represents the covariate (sex or lineage) by QTL alone.
In the pairwise genome scan, one suggestive epistatic interaction was found between the loci on Chromosomes 8 (D8Rat163) and 9 (D9Rat67).
The multiple regression analysis of immobility (Table 5) retained seven of these loci, two with sex-specific and one with lineage-specific effects. The epistatic loci were not retained in this model. QTL that were retained in the regression model were named Imm1–6. One locus, (Chr 16 at 25 cM) was also found to effect climbing behavior and was named FST1. The regression model explains 21.9% of the total variance for this phenotype and none of the loci explained more than 5%. This result suggests that the trait is truly polygenic in nature and it is likely that we have not identified all contributing loci. Furthermore, among the loci identified, the actual effect sizes may be smaller than predicted (Beavis 1997).
Table 5.
Multiple regression model for log (immobility)
| Source | Peak marker | %Variance | F | p-value | Locus name |
|---|---|---|---|---|---|
| Sex | 6.0 | 7.09 | 0.000002 | ||
| Lineage | 3.2 | 6.29 | 0.00034 | ||
| Chr 2 at 0 cM | D2Rat188 | 1.9 | 5.45 | 0.0035 | Imm1 |
| Chr 3 at 55 cM | D3Rat71 | 1.9 | 5.68 | 0.0028 | Imm2 |
| Chr 5 at 95 cM | D5Rat40 | 3.6 | 10.55 | 0.0002 | Imm3 |
| Chr 8 at 20 cM | D8Rat163 | 1.8 | 5.41 | 0.0036 | Imm4 |
| Chr 9 at 25 cM | D9Rat130 | 2.9 | 4.20 | 0.0017 | Imm5 |
| Chr 16 at 5 cM | D16Arb5 | 2.3 | 3.43 | 0.0067 | Imm6 |
| Chr 16 at 25 cM | D16Rat75 | 2.0 | 2.95 | 0.016 | FST1 |
| Sex · Chr 16 at 25 cM | 1.9 | 5.71 | 0.0027 | ||
| Sex · Chr 16 at 25 cM | 1.4 | 4.08 | 0.014 | ||
| Lineage · Chr 16 at 5 cM | 1.9 | 5.55 | 0.0032 | ||
| % Variance explained | 21.9 |
Climbing
While F1 generation animals exhibited a relatively normal distribution with a mean similar to the F344, suggesting a F344 dominant mode of inheritance for this trait, the distribution for climbing in the F2 generation was significantly skewed toward WKY-like behavior (Solberg et al. 2003).
For climbing in the segregating F2 generation, there is only a main effect of lineage (F1,480 = 13.2, p < 0.001). We identified six loci with suggestive main effects for this trait, two of which reached the significance threshold (Table 3, Fig. 3). When analyzed using sex, lineage, or both as interactive covariates, four more loci were identified, two of which reached significance. Although the marginal effect of sex in the F2 population as a whole is not significant (p = 0.12), when considered in the context of the QTL effects and their interactions with sex, the effect of sex on this trait is substantial (p < 0.001). Thus, the absence of an overall sex effect does not rule out the possibility of sex x genotype interactions. In fact, four of these loci (Chrs 1 at 0 cM, 13 at cM, 15 at 0 cM, 17 at 40 cM) were detected using sex as an interactive covariate. While no novel loci were detected using lineage as an interactive covariate, several previously identified loci were also found to be effected by lineage.
Table 3.
Summary of single-marker genome scan results for log (climbing)
| Location (cM) | Peak marker | LOD, additivea | LOD, trait · sexb | LOD, trait · lineagec | LOD trait · sex · lineaged |
|---|---|---|---|---|---|
| Chr 1 at 0 | D1Rat246 | 3.06 | |||
| Chr 1 at 100 | D1Rat147 | 3.93 | 4.82 | 5.03 | 6.01 |
| Chr 2 at 60 | D2Rat220 | 5.55 | 5.47 | 5.66 | 9.00 |
| Chr 3 at 40 | D1Rat181 | 2.98 | 3.44 | 4.34 | 5.35 |
| Chr 6 at 0 | D6Rat46 | 2.87 | 3.28 | 3.05 | |
| Chr 13 at 10 | D13Rat120 | 3.01 | |||
| Chr 14 at 60 | D14Rat34 | 2.28 | |||
| Chr 15 at 0 | D15Rat1 | 3.69 | |||
| Chr 16 at 20 | D16Rat75 | 2.18 | 5.17 | 3.21 | 7.49 |
| Chr 17 at 40 | D17Rat46 | 3.53 | 4.98 |
Scans with no interactive covariates have suggestive threshold 2.1, significant threshold 3.8 (significant loci in bold).
Scans with an interactive covariate have suggestive threshold 3.0, significant threshold 4.2 (significant loci in bold).
Scans with an interactive covariate have suggestive threshold 3.0, significant threshold 4.1 (significant loci in bold).
Scans with an interactive covariate have suggestive threshold 4.9, significant threshold 6.2 (significant loci in bold).
Figure 3.

LOD plots of genome scans for log(climbing). Chromosome location is on the X axis, LOD score is on the Y axis. The red line indicates significant and the green line indicates the suggestive threshold. (A). Scan for main effects with sex and lineage as additive covariates. (B). Scan with sex as interactive and lineage as additive covariate. (C). Scan with lineage as interactive and sex as additive covariate. (D). Scan with sex and lineage as interactive covariates. Pink trace in B–D represents the scan for the covariate x QTL interaction alone.
We examined all pairwise combinations of marker loci for association with this trait in a two-dimensional genome scan and found suggestive sex-specific interactions between loci on Chromosomes 2 (at 60 cM) and 9 (at 75 cM) and between Chromosomes 3 (at 35 cM) and 16 (at 25 cM). We also found a suggestive lineage-specific interaction between loci on Chromosomes 1 (at 0 cM) and 2 (at 60 cM).
For climbing, the regression model retained seven loci (Table 6). QTL that were retained in the regression model were named Climb1–6. These include three sex-specific effects, 2 lineage specifics, and three epistatic interactions, one of which is lineage dependent. As seen with immobility, each QTL explains only a small percentage of the variance and the model explains 31.9% of the total variance in this phenotype.
Table 6.
Multiple regression model for log (climbing)
| Source | Peak marker | %Variance | F | p-value | Locus name |
|---|---|---|---|---|---|
| Sex | 6.2 | 5.73 | 2.32E-06 | ||
| Lineage | 6.3 | 4.56 | 9.07E-06 | ||
| Chr 1 at 0 cM | D1Rat246 | 7.3 | 3.37 | 3.41E-05 | Climb1 |
| Chr 1 at 100 cM | D1Rat147 | 2.7 | 8.72 | 0.00019 | Climb2 |
| Chr 2 at 60 cM | D2Rat220 | 7.8 | 4.23 | 2.49E-06 | Climb3 |
| Chr 3 at 40 cM | D3Rat181 | 4.8 | 5.25 | 3.10E-05 | Climb4 |
| Chr 6 at 0 cM | D6Rat46 | 2.1 | 6.80 | 0.0012 | Climb5 |
| Chr 15 at 0 cM | D15Rat1 | 2.6 | 4.26 | 0.0022 | Climb6 |
| Chr 16 at 25 cM | D16Rat75 | 5.1 | 4.16 | 8.13E-05 | FST1 |
| Sex · Chr 1 at 0 cM | 1.9 | 6.14 | 0.0023 | ||
| Sex · Chr 15 at 0 cM | 1.8 | 5.81 | 0.0032 | ||
| Sex · Chr 16 at 25 cM | 2.0 | 6.55 | 0.0016 | ||
| Lineage · Chr 1 at 0 cM | 3.7 | 3.96 | 0.00072 | ||
| Lineage · Chr 2 at 60 cM | 2.9 | 3.15 | 0.0049 | ||
| Chr 1 at 0 · Chr 2 at 60 cM | 4.1 | 3.30 | 0.0011 | ||
| Chr 3 at 40 · Chr 16 at 25 cM | 2.4 | 3.93 | 0.0038 | ||
| Lineage · Chr 1 at 0 · Chr 2 at 60 cM | 2.8 | 4.56 | 0.0013 | ||
| % Variance explained | 31.9 |
This regression model identified a locus on Chromosome 16 at 25 cM that appears to be acting on both climbing and immobility. This locus has been named FST1. This locus is female-specific in both phenotypes, significant in climbing, and suggestive in immobility. Furthermore, it is WKY lineage specific for climbing at the suggestive level. The Chromosome 3 locus (at 55 and 40 cM for immobility and climbing, respectively) may also represent a common QTL between these two traits.
Swimming
Distribution of the F1 generation data is normal. The F2 generation data is slightly skewed toward increased swimming. No dominance effects are seen as no differences were found between WKY and F344 parents.
While only one suggestive QTL (Chr 8) was identified using the main genome scan for swimming, six more suggestive QTL (Chrs 1 at 80 cM, 9 at 25 cM, 14 at 25 cM, 15 at 0 cM, 15 at 15 cM, 20 at 0 cM) were found using genome scans with sex, lineage, or sex lineage interactive effects (see Table 4, Fig. 4). Multiple regression analysis retained two QTL (Chrs 8 at 20 cM and 20 at cM), one (Chr 20 at 0 cM) with a lineage-specific effect (see Table 7). The model explains 8.6% of total variation in this trait.
Table 4.
Summary of single-marker genome scan results for log (swimming)
| Location (cM) | Peak marker | LOD, mainscana | LOD trait · sexb | LOD trait · lineagec | LOD trait · sex · lineaged |
|---|---|---|---|---|---|
| Chr 1 at 80 | D1Rat51 | 2.97 | |||
| Chr 8 at 20 | D8Rat163 | 2.56 | 3.41 | 3.35 | 5.07 |
| Chr 9 at 25 | D9Rat130 | 2.99 | |||
| Chr 14 at 25 | D14Rat12 | 4.81 | |||
| Chr 15 at 0 | D15Rat1 | 2.88 | |||
| Chr 15 at 15 | D15Rat56 | 3.28 | |||
| Chr 20 at 0 | D20Rat1 | 3.69 | 5.51 |
Scans with no interactive covariates have suggestive threshold 2.0, significant threshold 3.6.
Scans with an interactive covariate have suggestive threshold 2.9, significant threshold 4.1.
Scans with an interactive covariate have suggestive threshold 2.8, significant threshold 4.2.
Scans with an interactive covariate have suggestive threshold 4.2, significant threshold 6.1.
Figure 4.

LOD plots of genome scans for log(swimming). Chromosome location is on the X axis, LOD score is on the Y axis. The red line indicates significant and the green line indicates the suggestive threshold. (A). Scan for main effects with sex and lineage as additive covariates. (B). Scan with sex as interactive and lineage as additive covariate; (C). Scan with lineage as interactive and sex as additive covariate. (D). Scan with sex and lineage as interactive covariates. Pink trace in B–D represents the scan for the covariate x QTL interaction alone.
Table 7.
Multiple regression model for log (swimming)
| Source | Peak marker | %Variance | F | p-value | Locus name |
|---|---|---|---|---|---|
| Sex | 5.9 | 10.12 | 1.43E-06 | ||
| Chr 8 at 20 cM | D8Rat163 | 2.0 | 5.24 | 0.0056 | Swim1 |
| Chr 20 at 0 cM | D20Rat1 | 3.1 | 4.06 | 0.0027 | Swim2 |
| Lineage · Chr 20 at 0 | 2.5 | 6.37 | 0.0019 | ||
| % Variance explained | 8.6 |
QTL effects
Many, but not all, QTL showed the expected directions of the genotypic effects on the phenotype. For example, the WKY homozygote at Chr 3 at 55 or 40 cM shows increased immobility and decreased climbing (WKY profile; Fig. 5); this effect is seen in both sexes and works in an additive fashion. In contrast, some QTL showed opposite directions of effects that could contribute to transgressive segregation in the F2 population: The WKY homozygote at Chr 16 at 25 cM displays decreased immobility and increased climbing (F344 profile; Fig. 6). This locus is also sex-interactive since only the female WKY homozygotes show low immobility and high climbing (F344 profile), with the F344 allele being dominant. The epistatic interaction between Chr 1 at 0 cM and Chr 2 at 60 cM is not only found in the F344 lineage only, but it exhibits transgressive segregation for Chromosome 2 (with F344 homozygotes exhibiting low climbing; WKY profile) and the expected direction of effect for Chromosome 1 (WKY homozygotes exhibiting low climbing) (Fig. 7).
Figure 5.
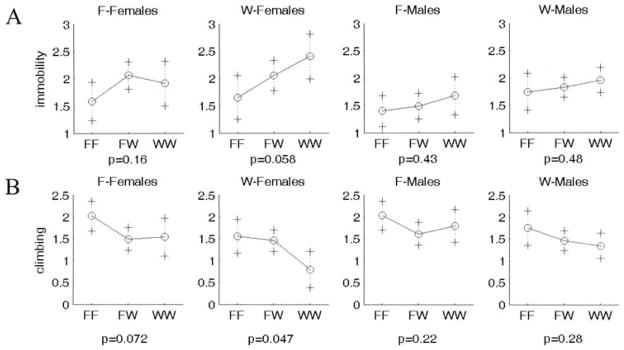
Representative plot of allele effects showing the expected direction of effect (WKY homozygotes show increased immobility and decreased climbing). One plot is shown for each group separated by sex and lineage. (A). Chr3at 55 cM for immobility. (B). Chr 3 at 40 cM for climbing. F-Females and F-Males represent F2 generation rats from a F344 grandmother x WKY grandfather lineage, whereas W-Females and W-Males represent F2 generation rats from a WKY grandmother x F344 grandfather lineage. X axis represents genotypes. F and W represent F344 and WKY alleles, respectively. FW represents heterozygote for each allele. Y axis is log(immobility).
Figure 6.
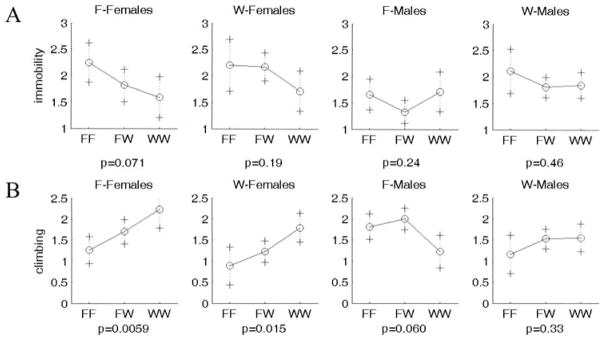
Representative plot of allele effects showing transgressive segregation (WKY homozygotes show F344 profile with decreased immobility and increased climbing). Chr 16 at 25 cM shows paradoxical F344 profile for (A) immobility and (B) climbing. One plot is shown for each group separated by sex and lineage. F-Females and F-Males represent F2 generation rats from a F344 grandmother x WKY grandfather lineage, whereas W-Females and W-Males represent F2 generation rats from a WKY grandmother x F344 grandfather lineage. X axis represents genotypes. F and W represent F344 and WKY alleles, respectively. FW represents heterozygote for each allele. Y axis is log(immobility) and log(climbing), respectively.
Figure 7.
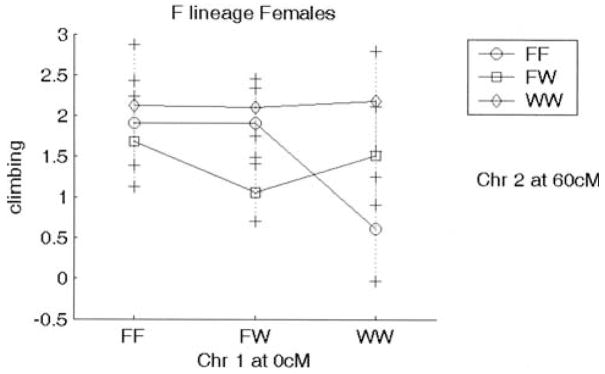
Plot showing lineage effect on interacting loci Chr 1 at 0 cM and Chr 2 at 60 cM. Effect is seen only in animals from the F344 lineage. Animals homozygote for the WKY allele at Chr 1 at 0 cM and those homozygote for the F344 allele show decreased climbing (WKY 1profile). X axis represents genotypes for Chromosome 1; genotypes for Chromosome 2 are depicted in the figure key. F and W represent F344 and WKY alleles, respectively. FW represents heterozygote for each allele. Y axis is log(climbing).
Overlapping candidate regions
Using the mouse–rat homology maps available at The Jackson Laboratory (http://www.informatics.jax.org) and the VCMap comparative mapping program available at the Rat Genome Database at the Medical College of Wisconsin (http://rgd.mcw.edu), we found that several of our loci show overlapping candidate regions with previously identified QTL for emotionality in the mouse and bipolar and major depression in humans (Table 8).
Table 8.
Comparison of QTL of FST behavior with mouse QTL for behavioral despair and emotionality and with human genetic linkage to depressive disorders
| QTL | Mouse despair | Mouse/rat/emotionality | Human EOR-MDa | Human bipolar | Human anxiety disorder |
|---|---|---|---|---|---|
| Imm1 D2Rat188 | DB latency to bury: D2Rat188 (Ahmadiyeh et al. 2004) | 5q11 interacts with 6q24 (McInnis et al. 2003) | |||
| Imm2 D3Rat71 | 15q13.1 (Zubenko et al. 2002) | ||||
| Imm3 D5Rat40 | TST: Chr/4: 68.1 cM (Turri et al. 2001a; Yoshikawa et al. 2000) | 1p33–66 (Cichon et al. 2001) | |||
| Imm6 D16Arb5 | “Anxiety”: Chr 14: 16–20 cM (Henderson 2004) | 3p21(Kelsoe et al. 2001) | |||
| Climb1 D1Rat246 | 6q21–22 (Cichon et al. 2001), 6q24 interacts with 5q11 (McInnis et al. 2003) | ||||
| Climb2 D1Rat147 | “Anxiety”: Chr 7: 56–70 cM (Henderson 2004) | 11p15.5 (Muglia et al. 2002; Zandi et al. 2003) | |||
| Climb3 D2Rat220 | 3q26–27 (Cichon et al. 2001), 3q27 (Kelsoe et al. 2001) | ||||
| Climb4 D3Rat181 | 2q21–33 (Cichon et al. 2001) | ||||
| Climb5 D6Rat46 | DB latency to bury: D6Rat46 (Ahmadiyeh et al. 2004); EPM D6Mit1 (Ramos et al. 1999) | 2p24–21 (Cichon et al. 2001) | |||
| Climb6 D15Rat1 | OFT a repeated saline injection: Chr 14: 3 cM (Boyle and Gill 2001) | ||||
| FST1 D16Rat75 | 8p21 (Cichon et al. 2001) | 8p21–22 (Cloninger et al. 1998) |
Early-Onset Recurrent Major Depression.
Discussion
We have genetically mapped behavioral despair exhibited in the forced swim test. Through genome-wide analysis of a segregating F2 population of a WKY x F344 cross, where the WKY represent a genetic animal model of depressive behavior, we have identified seven loci that influence immobility, seven loci that influence climbing, and two loci that influence swimming in the FST. Most of these loci differentially affect males and females, and an effect of lineage is noted for one immobility locus and two climbing loci. The genomewide interaction analysis identified one pair of loci that had an epistatic effect on immobility and three pairs of loci that had epistatic effects on climbing, one of which was lineage specific. We also identified at least one pleiotropic locus that affects both immobility and climbing. Importantly, several of our QTL show overlapping candidate regions with previously identified QTL for emotionality in the mouse and areas of linkage with major depression and bipolar disorder in humans.
The significant and suggestive QTL identified in the current study explain 22.0%, 31.9%, and 8.6% of the total phenotypic variance for immobility, climbing, and swimming, respectively. Similar percentages of variance were associated with the behavioral despair QTL found in the study of Yoshikawa et al. (2002) and other behavioral QTL analyses. Because most of our loci contribute small percentages to the total phenotypic variance, it is likely that several more loci, below the threshold of detection, play a role in these behaviors in addition to epigenetic and environmental influences.
We have identified one locus that exhibits pleiotropic effects: Chr 16 at 25 cM appears to be acting on both immobility and climbing. A second locus, Chr 3 at 55 and 40 cM (for immobility and climbing, respectively) may also be exhibiting pleiotropic effects. The Chr 16 locus exhibits paradoxical behavior: Females homozygous for the WKY allele at FST1 show increased climbing, a F344 pattern of behavior. This phenomenon, transgressive segregation, has been found in several other QTL studies (e.g., Caldarone et al. 1997; Mogil et al. 1997; Ramos et al. 1999; Shimomura et al. 2001; Wehner et al. 1997; Yoshikawa et al. 2002) and suggests that the locus of the unaffected parent is contributing to the resulting behavior. It appears that some additional significant or suggestive loci affecting one trait are also affecting the other in the expected direction of effect, but these loci have reached statistical significance for only one of the two traits in this study. Further investigation may be required to determine which loci are truly contributing pleiotropic effects and which are specific to only one of the traits.
While several behavioral and biological factors can influence behavior in the FST (e.g., basal levels of anxiety, slowness in muscle movement, body temperature), our results complement and extend those of previous studies that identified QTL for immobility in the FST and the tail suspension test (TST) (Turri et al. 2001; Yoshikawa et al. 2002), another test for behavioral despair in mice that is also responsive to antidepressant drugs (Liu and Gershenfeld 2001; Steru et al. 1985). Of QTL identified in these studies, we found Imm3 to share conserved synteny with the QTL for immobility on mouse Chromosome 4 affecting TST behavior in mice (Yoshikawa et al. 2002; Table 8). The main difference between our results and those mentioned above is that in the current study the segregating F2 generation was generated using a genetic animal model of depression, whereas the F2 generations in the above studies were created using two inbred strains that differed in FST behavior. This may explain why so few of our QTL overlap with this previous study. As the genetic animal model of depression we used shares endophenotypes with human depression, our results may provide a more particular representation of the genetic factors involved in mood disorders. As discussed below, the overlapping candidate regions shared by our loci and those in mouse models of emotionality and for depressive disorders in humans support this hypothesis.
The WKY has behavioral abnormalities that mirror comorbidity of depression and anxiety in humans (Nemeroff 2002; Sartorius et al. 1996). We compared our results with published QTL for anxiety and emotionality measures in mice and found several loci in common between those and our studies (Table 8). We also found common loci with our own study done using the defensive burying paradigm (a test for anxiety and passive coping) in the same group of F2 generation rats as those used in the current study (Ahmadiyeh et al. submitted). As evidence indicates that similar genetic factors might contribute to depression and generalized anxiety disorder in humans (Kendler et al. 1992), and WKY rats exhibit both depressive and anxious behaviors in behavioral tests, we suggest that these loci may play a role in limbic system activation and/or anxious components of depression.
Several of our loci are concordant with both mouse loci for anxiety-related traits and chromosomal locations associated with human anxiety, major depression, or bipolar disorder. For example, Climb2 [which mapped to a corresponding chromosomal region for a composite QTL for behavioral anxiety measures in the mouse (Henderson et al. 2004)] also overlaps with bipolar disorder loci on human Chromosome 11 (Muglia et al. 2002; Zandi et al. 2003). Climbing, an active behavior that is negatively correlated with immobility, the behavioral measure of despair, responds to tricyclic anti-depressant treatment in the WKYs (Lopez–Rubalcava and Lucki 2000) and can be interpreted as active coping. Since animals homozygotic for the WKY allele at Climb2 show a WKY profile (a decrease in climbing), this locus may contribute to the lack of active coping that is seen in the WKY.
Furthermore, several of the sex and lineage QTL in the current study are similar to sex-specific loci and parent-of-origin effects found in human linkage studies of major depression and bipolar disorder. In humans, it has been suggested that the sets of genes involved in the two sexes may overlap but are not exactly the same, as depression is more prevalent in females than males (Kessler et al. 1994; Weissman and Klerman 1977) and the heritability for this trait in humans is higher in females than in males (Kendler et al. 2001). This hypothesis has recently been verified in linkage disequilibrium studies for early-onset recurrent major depression (Zubenko et al. 2002) and neuroticism (a personality trait often associated with depression) (Fulerton et al. 2003) as several sex-specific loci were found in each study.
Our analysis shows the first lineage effect in behavioral despair in animals. Lineage effects have been noted in human bipolar disorder on Chromosome 18, with both maternal (Gershon et al. 1996; McMahon et al. 1995) and paternal (Stine et al. 1995) patterns of inheritance. Linkage for bipolar disorder has recently been found on Chromosome 11 (11p15.5), close to the dopamine D4 receptor (Drd4) (Muglia et al. 2002; Zandi et al. 2003). Muglia et al. (2002) found that Drd4 alleles showed biased transmission within bipolar lineages with a maternally transmitted parent-of-origin effect, and the authors argued that Drd4 is located in close proximity to a cluster of imprinted genes, suggesting that imprinting may be a factor in the genetics of bipolar disorder. Drd4 and several other imprinted genes are within the confidence interval of Climb2, a significant WKY lineage-specific locus (Table 8). Although the potential role of imprinting in lineage-specific QTL cannot be confirmed in the present study, it clearly remains a possible explanation.
In summary, we have detected multiple QTL associated with immobility, climbing, and swimming behavior in the FST. Most of these QTL were sex-specific and some showed lineage-specific effects on the phenotype. These QTL regions will have to be narrowed down for eventual identification of causative genes involved in despair behavior in rats. However, we believe that characterization of candidate genes that fall in these regions, particularly those that share overlapping candidate regions with human and mouse loci for depression and emotionality, could help unravel the genetic mechanisms of human depressive disorders.
Acknowledgments
This work was supported by a grant from the National Institutes of Mental Health (R0I MH60789). We thank Dr. William Pare for advice and discussion of the WKY rat and Kathryn Paige Harden for assistance in genotyping. JST is an investigator in the Howard Hughes Medical Institute.
References
- 1.Ahmadiyeh N, Churchill GA, Shimomura K, Solberg LC, Takahashi JS, et al. X-linked and to lineage-dependent inheritance of coping responses to stress. Mamm Genome. 2003;14(11):748–757. doi: 10.1007/s00335-003-2292-x. [DOI] [PubMed] [Google Scholar]
- 2.Ahmadiyeh N, Churchill GA, Solberg LC, Baum A, Shimomura K, et al. Lineage is an epigenetic modifier of QTL influencing behavioral coping with stress. Behav Genet. 2004 doi: 10.1007/s10519-004-1018-5. (Submitted) [DOI] [PMC free article] [PubMed] [Google Scholar]
- 3.Aitchison J. The Statistical Analysis of Compositional Data. Caldwell, NJ: Blackburn Press; 2003. [Google Scholar]
- 4.Armario A, Gavalda A, Marti O. Forced swimming test in rats: effect of desipramine administration and the period of exposure to the test on struggling behavior, swimming, immobility and defecation rate. Eur J Pharmacol. 1988;158:207–212. doi: 10.1016/0014-2999(88)90068-4. [DOI] [PubMed] [Google Scholar]
- 5.Beavis W. QTL analysis: Power precision and accuracy. In: Paterson A, editor. Molecular Dissection of Complex Traits. New York: CRC Press; 1997. [Google Scholar]
- 6.Boyle A, Gil K. Sensitivity of AXB/BXA recombinant inbred lines of mice to the locomotor activating effects of cocaine: a quantitative trait loci analysis. Pharmacogenetics. 2001;11:255–264. doi: 10.1097/00008571-200104000-00009. [DOI] [PubMed] [Google Scholar]
- 7.Broman KW, Wu H, Sen S, Churchill GA. R/qtl: QTL mapping in experimental crosses. Bioinformatics. 2003;19:889–890. doi: 10.1093/bioinformatics/btg112. [DOI] [PubMed] [Google Scholar]
- 8.Caldarone B, Saavedra C, Tartaglia K, Wehner JM, Dudek BC, et al. Quantitative trait loci analysis affecting contextual conditioning in mice. Nat Genet. 1997;17:335–337. doi: 10.1038/ng1197-335. [DOI] [PubMed] [Google Scholar]
- 9.Churchill GA, Doerge RW. Empirical threshold values for quantitative trait mapping. Genetics. 1994;138:963–971. doi: 10.1093/genetics/138.3.963. [DOI] [PMC free article] [PubMed] [Google Scholar]
- 10.Cichon S, Schmacher J, Muller DJ, Hurter M, Windemuth C, et al. A genome screen for genes predisposing to bipolar affective disorder detects anew susceptibility locus on 8q. Hum Mol Genet. 2001;10(25):2933–2944. doi: 10.1093/hmg/10.25.2933. [DOI] [PubMed] [Google Scholar]
- 11.Cloninger CR. Anxiety proneness linked to epistatic loci in genome scan of human personality traits. Am J Med Genet. 1998;81:313–317. doi: 10.1002/(sici)1096-8628(19980710)81:4<313::aid-ajmg7>3.0.co;2-u. [DOI] [PubMed] [Google Scholar]
- 12.Cryan JF, Markou A, Lucki I. Assessing antidepressant activity in rodents: recent developments and future needs. Trends Pharmacol Sci. 2002;23:238–245. doi: 10.1016/s0165-6147(02)02017-5. [DOI] [PubMed] [Google Scholar]
- 13.Detke MJ, Rickels M, Lucki I. Active behaviors in the rat forced swimming test differentially produced by serotonergic and noradrenergic antidepressants. Psychopharmacology (Berl) 1995;121:66–72. doi: 10.1007/BF02245592. [DOI] [PubMed] [Google Scholar]
- 14.Flint J, Mott R. Finding the molecular basis of quantitative traits: successes and pitfalls. Nat Rev Genet. 2001;2:437–445. doi: 10.1038/35076585. [DOI] [PubMed] [Google Scholar]
- 15.Fullerton J, Cubin M, Tiwari H, Wang C, Bomhra A. Linkage analysis of extremely discordant and concordant sibling pairs identifies quantitative-trait loci that influence variation in the human personality trait neuroticism. Am J Hum Genet. 2003;72:879–890. doi: 10.1086/374178. [DOI] [PMC free article] [PubMed] [Google Scholar]
- 16.Gershon ES, Badner JA, Detera–Wodleigh SD, Ferraro TN, Berrettini WH. Maternal inheritance and chromosome 18 allele sharing in unilineal bipolar illness pedigrees. Am J Med Genet. 1996;67:202–207. doi: 10.1002/(SICI)1096-8628(19960409)67:2<202::AID-AJMG11>3.0.CO;2-N. [DOI] [PubMed] [Google Scholar]
- 17.Henderson ND, Turri MG, DeFries JC, Flint J. QTL analysis of multiple behavioral measures of anxiety in mice. Behav Genet. 2004;34:267–293. doi: 10.1023/B:BEGE.0000017872.25069.44. [DOI] [PubMed] [Google Scholar]
- 18.Jacob HJ, Brown DM, Bunker RK, Daly MJ, Dzau VJ, et al. A genetic linkage map of the laboratory rat, Rattus norvegicus. Nat Genet. 1995;9:63–69. doi: 10.1038/ng0195-63. [DOI] [PubMed] [Google Scholar]
- 19.Kelsoe JR, Spence MA, Loetscher E, Foguet M, Sadovnick AD, et al. A genome survey indicates a possible susceptibility locus for bipolar disorder on chromosome 22. Proc Natl Acad Sci USA. 2001;98:585–590. doi: 10.1073/pnas.011358498. [DOI] [PMC free article] [PubMed] [Google Scholar]
- 20.Kendler KS, Neale MC, Kessler RC, Heath AC, Eaves LJ. Major depression and generalized anxiety disorder. Same genes, (partly) different environments? [see comments.] Arch Gen Psychiatry. 1992;49:716–722. doi: 10.1001/archpsyc.1992.01820090044008. [DOI] [PubMed] [Google Scholar]
- 21.Kendler KS, Gardner CO, Neale MC, Prescott CA. Genetic risk factors for major depression in men and women: similar or different heritabilities and same or partly distinct genes? Psychol Med. 2001;31:605–616. doi: 10.1017/s0033291701003907. [DOI] [PubMed] [Google Scholar]
- 22.Kessler RC, McGonagle KA, Nelson CB, Hughes M, Swartz M, et al. Sex and depression in the National Comorbidity Survey. II: Cohort effects. J Affect Disord. 1994;30:15–26. doi: 10.1016/0165-0327(94)90147-3. [DOI] [PubMed] [Google Scholar]
- 23.Korstanje R, Paigen B. From QTL to gene: the harvest begins. Nat Genet. 2002;31:235–236. doi: 10.1038/ng0702-235. [DOI] [PubMed] [Google Scholar]
- 24.Lander E, Kruglyak L. Genetic dissection of complex traits: guidelines for interpreting and reporting linkage results. Nat Genet. 1995;11:241–247. doi: 10.1038/ng1195-241. [DOI] [PubMed] [Google Scholar]
- 25.Lander ES, Schork NJ. Genetic dissection of complex traits. Science. 1994;265:2037–2048. doi: 10.1126/science.8091226. [DOI] [PubMed] [Google Scholar]
- 26.Liu X, Gershenfeld HK. Genetic differences in the tail-suspension test and its relationship to imipramine response among 11 inbred strains of mice. Biol Psychiatry. 2001;49:575–581. doi: 10.1016/s0006-3223(00)01028-3. [DOI] [PubMed] [Google Scholar]
- 27.Lopez–Rubalcava C, Lucki I. Strain differences in the behavioral effects of antidepressant drugs in the rat forced swimming test. Neuropsychopharmacology. 2000;22:191–199. doi: 10.1016/S0893-133X(99)00100-1. [DOI] [PubMed] [Google Scholar]
- 28.Lucki I. The forced swimming test as a model for core and component behavioral effects of antidepressant drugs. Behav Pharmacol. 1997;8:523–532. doi: 10.1097/00008877-199711000-00010. [DOI] [PubMed] [Google Scholar]
- 29.Marti J, Armario A. Effects of diazepam and desipramine in the forced swimming test: influence of previous experience with situation. Eur J Pharmacol. 1993;236:295–299. doi: 10.1016/0014-2999(93)90601-d. [DOI] [PubMed] [Google Scholar]
- 30.McInnis MG, Dick DM, Wilour VL, Avramopoulos D, MacKinnan DF, et al. Genome-wide scan and conditional analysis in bipolar disorder: evidence for genomic interaction in the National Institute of Mental Health genetics initiative bipolar pedigrees. Biol Psychiatry. 2003;54:1265–1273. doi: 10.1016/j.biopsych.2003.08.001. [DOI] [PubMed] [Google Scholar]
- 31.McMahon FJ, Stine OC, Meyers DA, Simpson SG, De Paulo JR. Patterns of maternal transmission in bipolar affective disorder. Am J Hum Genet. 1995;56:1277–1286. [PMC free article] [PubMed] [Google Scholar]
- 32.McPeek MS. From mouse to human: fine mapping of quantitative trait loci in a model organism. Proc Natl Acad Sci USA. 2000;97:12389–12390. doi: 10.1073/pnas.240463597. [DOI] [PMC free article] [PubMed] [Google Scholar]
- 33.Mogil JS, Richards SP, O’Toole LA, Helms ML, Mitchel SR, et al. Identification of a sex-specific quantitative trait locus mediating nonopioid stress-induced analgesia in female mice. J Neurosci. 1997;17:7995–8002. doi: 10.1523/JNEUROSCI.17-20-07995.1997. [DOI] [PMC free article] [PubMed] [Google Scholar]
- 34.Muglia P, Petronis A, Mundo E, Lander S, Cate T, et al. Dopamine D4 receptor and tyrosine hydroxylase genes in bipolar disorder: evidence for a role of DRD4. Mol Psychiatry. 2002;7:860–866. doi: 10.1038/sj.mp.4001098. [DOI] [PubMed] [Google Scholar]
- 35.Nemeroff CB. Comorbidity of mood and anxiety disorders: the rule, not the exception? [letter; comment.] Am J Psychiatry. 2002;159:3–4. doi: 10.1176/appi.ajp.159.1.3. [DOI] [PubMed] [Google Scholar]
- 36.Pare WP. “Behavioral despair” test predicts stress ulcer in WKY rats. Physiol Behav. 1989a;46:483–487. doi: 10.1016/0031-9384(89)90025-5. [DOI] [PubMed] [Google Scholar]
- 37.Pare WP. Stress ulcer susceptibility and depression in Wistar Kyoto (WKY) rats. Physiol Behav. 1989b;46:993–998. doi: 10.1016/0031-9384(89)90203-5. [DOI] [PubMed] [Google Scholar]
- 38.Porsolt RD, Le Pichor M, Jaffre M. Depression: a new animal model sensitive to antidepressant treatments. Nature. 1977;266:730–732. doi: 10.1038/266730a0. [DOI] [PubMed] [Google Scholar]
- 39.Porsolt RD, Anton G, Blavet N, Jaffre M. Behavioral despair in rats: a new model sensitive to antidepressant treatments. Eur J Pharmacol. 1978;47:379–391. doi: 10.1016/0014-2999(78)90118-8. [DOI] [PubMed] [Google Scholar]
- 40.Ramos A, Moisan MP, Chaouloff F, Mormede C, Mormede P. Identification of female-specific QTLs affecting an emotionality-related behavior in rats. Mol Psychiatry. 1999;4:453–462. doi: 10.1038/sj.mp.4000546. [DOI] [PubMed] [Google Scholar]
- 41.Redei EE, Solberg LC, Kluczynski JM, Pare WP. Paradoxical hormonal and behavioral responses to hypothyroid and hyperthyroid states in the Wistar– Kyoto rat. Neuropsychopharmacology. 2001;24:632–639. doi: 10.1016/S0893-133X(00)00229-3. [DOI] [PubMed] [Google Scholar]
- 42.Sartorius N, Ustun TB, Lecrubier Y, Wittchen HU. Depression comorbid with anxiety: results from the WHO study on psychological disorders in primary health care. Br J Psychiatry Suppl Jun. 1996;(30):38–43. [PubMed] [Google Scholar]
- 43.Sebkhi A, Zhao L, Lu L, Haley CS, Nunez DJ, et al. Genetic determination of cardiac mass in normotensive rats: results from an F344 x WKY cross. Hypertension. 1999;33:949–953. doi: 10.1161/01.hyp.33.4.949. [DOI] [PubMed] [Google Scholar]
- 44.Sen S, Churchil GA. A statistical framework for quantitative trait mapping. Genetics. 2001;159:371–387. doi: 10.1093/genetics/159.1.371. [DOI] [PMC free article] [PubMed] [Google Scholar]
- 45.Shimomura K, Low–Zeddies SS, King DP, Steeves TD, Whiteley A, et al. Genome-wide epistatic interaction analysis reveals complex genetic determinants of circadian behavior in mice. Genome Res. 2001;11:959–980. doi: 10.1101/gr.171601. [DOI] [PubMed] [Google Scholar]
- 46.Solberg L, Ahmadiyeh N, Baum AE, Vitaterna MH, Takahashi JS, et al. Depressive-like behavior and stress reactivity are independent traits in a Wistar Kyoto · Fisher 344 cross. Mol Psychiatry. 2003;8:423–433. doi: 10.1038/sj.mp.4001255. [DOI] [PubMed] [Google Scholar]
- 47.Steru L, Chermat R, Thierry B, Simon P. The tail suspension test: a new method for screening antidepressants in mice. Psychopharmacology. 1985;85:367–370. doi: 10.1007/BF00428203. [DOI] [PubMed] [Google Scholar]
- 48.Stine OC, Xu J, Koskela R, McMahon FJ, Gschwend M, et al. Evidence for linkage of bipolar disorder to chromosome 18 with a parent-of-origin effect. Am J Hum Genet. 1995;57:1384–1394. [PMC free article] [PubMed] [Google Scholar]
- 49.Sugiyama F, Churchill GA, Li R, Libby LJ, Carver T, et al. QTL associated with blood pressure, heart rate, and heart weight in CBA/CaJ and BALB/cJ mice. Physiol Genomics. 2002;10:5–12. doi: 10.1152/physiolgenomics.00002.2002. [DOI] [PubMed] [Google Scholar]
- 50.Turri MG, Datta SR, DeFries J, Henderson ND, Flint J. QTL analysis identifies multiple behavioral dimensions in ethological tests of anxiety in laboratory mice. Curr Biol. 2001;11:725–734. doi: 10.1016/s0960-9822(01)00206-8. [DOI] [PubMed] [Google Scholar]
- 51.Wehner JM, Radcliffe RA, Rosmann ST, Christensen SC, Rasmussen DL, et al. Quantitative trait locus analysis of contextual fear conditioning in mice. Nat Genet. 1997;17:331–334. doi: 10.1038/ng1197-331. [DOI] [PubMed] [Google Scholar]
- 52.Weissman MM, Klerman GL. Sex differences and the epidemiology of depression. Arch Gen Psychiatry. 1977;34:98–111. doi: 10.1001/archpsyc.1977.01770130100011. [DOI] [PubMed] [Google Scholar]
- 53.Yoshikawa T, Watanabe A, Ishitsuka Y, Nakaya A, Nakatani N. Identification of multiple genetic loci linked to the propensity for “behavioral despair” in mice. Genome Res. 2002;12:357–366. doi: 10.1101/gr.222602. [DOI] [PubMed] [Google Scholar]
- 54.Zandi PP, Wilour VL, Huo Y, Chelis J, Potash JB, et al. Genome scan of a second wave of NIMH genetics initiative bipolar pedigrees: chromosomes 2, 11, 13, 14, and X. Am J Med Genet. 2003;119B:69–76. doi: 10.1002/ajmg.b.10063. [DOI] [PubMed] [Google Scholar]
- 55.Zubenko GS, Hughes HB, Stiffler JS, Zubenko WN, Kaplan BB. Genome survey for susceptibility loci for recurrent, early-onset major depression: Results at 10 cM resolution. Am J Med Genet. 2002;114:413–422. doi: 10.1002/ajmg.10381. [DOI] [PubMed] [Google Scholar]