Abstract
Identification of the optimal vaccine allocation for the control of influenza requires consideration of uncertainty arising from numerous unpredictable factors, including viral evolution and diversity within the human population’s immunity as well as variation in vaccine efficacy. The best policy must account for diverse potential outcomes based on these uncertainties. Here we used a mathematical model parametrized with survey-based contact data, demographic, and epidemiological data from seasonal influenza in the United States to determine the optimal vaccine allocation for five outcome measures: infections, hospitalizations, deaths, years of life loss, and contingent valuation. We incorporated uncertainty of epidemiological parameters and derive probability distributions of optimal age- and risk-specific allocation of vaccine. Our analysis demonstrated that previous recommendations of targeting schoolchildren (ages 5–17 years) and young adults (18–44 years) are generally robust in the face of uncertainty. However, when the outcome measure is to minimize deaths, years of life loss, or contingent valuation, uncertainty analysis identified scenarios under which it is optimal to target people at high risk for complications, even when vaccine are in abundance.
Keywords: Seasonal influenza, Vaccination, Mathematical modeling, Optimization
Introduction
Despite long-standing vaccination efforts, seasonal influenza continues to be responsible for substantial morbidity and mortality in the United States. It is estimated that seasonal influenza results in an average of 36,000 deaths, more than 200,000 hospitalizations, and an economic burden of approximately US$87 billion annually [1,2]. To minimize the economic and social impact of epidemic and pandemic influenza, optimal allocation of vaccines is imperative [1–3]. A number of studies have developed mathematical models that identify and evaluate the effectiveness of vaccine allocation strategies for different public health objectives such as minimizing mortality, infections, and hospitalizations [3–8].
Previous studies have derived vaccination strategies by using a base-case parameter set [3–8], even though there is considerable uncertainty in influenza epidemiological parameters [9,10,11]. Influenza epidemics recur yearly in part due to the cyclical evolution of influenza viruses from year to year [9]. This rapid evolution of influenza provides limits the foresight with which a vaccine may be developed and deployed, leading to uncertainty in vaccine efficacy and availability [10]. This evolution also changes the clinical and epidemiological parameters of influenza [9], all of which influence influenza severity and spread. To accommodate this variation, these optimization studies have generally employed a univariate sensitivity analysis to test the robustness of their results with respect to a given epidemiological parameter such as the reproductive number [3,4,6]. However, the performance of models that neglect uncertainty is dependent on assumed parameter values [7,11,12], particularly in models wherein small changes in parameter values may influence the effectiveness of individual strategies. Performance in these models may shift from optimal to highly suboptimal based on real values of parameters within the range of known uncertainty [12]. Though univariate sensitivity analysis helps to assess potential individual parameters that could mislead a base case analysis, univariate analysis does not provide comprehensive study of systems where simultaneous changes in more than one parameter may result in synergistic shifts in outcome arising from real-world nonlinearities [13]. In influenza transmission models, the outcome of a given vaccination policy depends on nonlinear interactions of various factors such as age-specific susceptibility, vaccine efficacy, transmission rate, and virulence [3,6,14]. To evaluate outcomes in response to imperfect knowledge, multivariate uncertainty and sensitivity analysis is needed.
In this paper, we apply multivariate uncertainty and sensitivity analysis to assess the robustness of optimal vaccine allocation policies [3,11] to uncertainty in epidemiological parameters. For each epidemiological parameter of the model, we estimate a probability distribution using data from the published literature. Sampling each epidemiological parameter from the corresponding probability distribution, we identified the optimal vaccine allocation strategy for each health outcome measure. Our multivariate sensitivity analysis facilitated an investigation of the effect of parameter uncertainty on vaccination policies and the identification of the key epidemiological parameters influencing the optimal vaccine allocation.
Methods
We extended a previous compartmental age-structured SEIR (susceptible, latent, infections, recovered) model for seasonal influenza epidemics [3] by including high risk group for complications due to other health conditions such as asthma, heart disease, and pregnancy (Supplementary Material). The model tracks 17 age groups: ages 0, 1 to 4, 5 to 9, 10 to 14… 70 to 74, and 75 and older. Each age group is subdivided into two risk groups: low risk and high risk of complication upon influenza infection. Influenza vaccines are not licensed in the United States for children younger than 6 months of age [15], so we assumed that they are not vaccinated. We parametrized the model with a distribution of values for the epidemiological parameters from the published literature (Table 1). We assumed that vaccine efficacy for high risk group was identical to that of the low risk group. Under this assumption, how results are conservative, given that vaccine efficacy for people at high risk for complications is generally expected to be lower than for healthy individuals [16].
Table 1.
Epidemiological parameters of the seasonal influenza model and their distributions
| Variable | Distribution | References |
|---|---|---|
| Infectious period (ages 0–14) | Gamma(Mean 3.6, Std 1.9) | 19 |
| Infectious period (ages 15+) | Gamma(Mean 3.9, Std 1.9) | 19 |
| Latent period | Triangular(Min 1, Mode 2, Max 3) | 20–23 |
| Susceptibility (ages 0–3) | Normal(Mean 0.83, Std 0.369) | 24 |
| Susceptibility (ages 4–17) | Normal(Mean 0.49, Std 0.5) | 24 |
| Susceptibility (ages 18+) | Normal(Mean 0.53, Std 0.49) | 24 |
| Reproductive number (R) | Normal(Mean 1.3, Std 0.15, Min 1) | 25 |
| Case mortality (ages 0–4) | Normal(Mean 4×10⁻⁵, Std 10−5, Min 0) | 2 |
| Case mortality (ages 5–17) | 10−5 | 2 |
| Case mortality (ages 18–49) | Normal(Mean 9×10⁻⁵, Std 3×10⁻⁵, Min 0) | 2 |
| Case mortality (ages 50–64) | Normal(Mean 134×10−5, Std 45×10−5, Min 0) | 2 |
| Case mortality (ages 65+) | Normal(Mean 117×10−4, Std 39×10−4, Min 0) | 2 |
| Case hospitalization (ages 0–4) | Normal(Mean 0.0141, Std 0.0047, Min 0) | 2 |
| Case hospitalization (ages 5–17) | Normal(Mean 0.0006, Std 0.0002, Min 0) | 2 |
| Case hospitalization (ages 18–49) | Normal(Mean 0.0042, Std 0.0014, Min 0) | 2 |
| Case hospitalization (ages 50–64) | Normal(Mean 0.0193, Std 0.0064, Min 0) | 2 |
| Case hospitalization (ages 65+) | Normal(Mean 0.0421, Std 0.0140, Min 0) | 2 |
| Proportion high risk (ages 0.5–1) | Normal(Mean 0.0415, Std 0.0044, Min 0) | 26 |
| Proportion high risk (ages 2–5) | Normal(Mean 0.0883, Std 0.0051, Min 0) | 26 |
| Proportion high risk (ages 5–18) | Normal(Mean 0.1168, Std 0.0030, Min 0) | 26 |
| Proportion high risk (ages 19–24) | Normal(Mean 0.1235, Std 0.0055, Min 0) | 26 |
| Proportion high risk (ages 25–49) | Normal(Mean 0.1570, Std 0.0027, Min 0) | 26 |
| Proportion high risk (ages 50–64) | Normal(Mean 0.3056, Std 0.0044, Min 0) | 26 |
| Proportion high risk (ages 65+) | Normal(Mean 0.4701, Std 0.0050, Min 0) | 26 |
| High-risk relative mortality (ages 0–19) | Triangular(Min 0.4, Mode 0.6, Max 21.9)/Triangular(Min 0.041, Mode 0.07, Max 0.30) | 17 |
| High-risk relative mortality (ages 20–64) | Uniform(Min 0.8, Max 24.9)/Triangular(Min 0.21, Mode 0.31, Max 0.41) | 17 |
| High-risk relative mortality (ages 65+) | Uniform(Min 23, Max 29.6)/Triangular(Min 2.3, Mode 3.51, Max 4.52) | 17 |
| High-risk relative hospitalization (ages 0–19) | Uniform(Min 6.0, Max 21.4)/Uniform(Min 0.57, Max 6.9) | 17 |
| High-risk relative hospitalization (ages 20–64) | Uniform(Min 6.9, Max 22.3)/Uniform(Min 1.5, Max 12.0) | 17 |
| High-risk relative hospitalization (ages 65+) | Uniform(Min 33.3, Max 68.4)/Uniform(Min 12.5, Max 15.8) | 17 |
| Vaccine efficacy against infection (ages 0.5–15) | Uniform(Min 0.54, Max 0.8) | 27,28 |
| Vaccine efficacy against infection (ages 16–64) | Uniform(Min 0.54, Max 0.7) | 27,28 |
| Vaccine efficacy against infection (ages 65+) | Uniform(Min 0.33, Max 0.66) | 27,28 |
| Vaccine efficacy against mortality | Uniform(Min 0.39, Max 0.54) | 16 |
| Vaccine efficacy against hospitalization | Uniform(Min 0.21, Max 0.73) | 16,27 |
Std = standard deviation; Min = minimum; Max= maximum; Normal (Mean m, Std s, Min a) is the standard Normal (Mean m, Std s) random variable censored so that it has minimum a.
Taking into account these uncertainties, we computed the optimal allocation of varying number of vaccine doses available for 5000 sets of independently sampled parameter values [3]. For each set, optimization was performed for five different outcome measures that have been widely employed to evaluate the effectiveness of influenza vaccination strategies: infections, deaths, hospitalizations, years of life lost, and contingent valuation [3–6,16–18]. Strategies for administrating vaccine were optimized based on vaccine allocation to five low-risk age groups 6 months–4 years, 5–17 years, 18–44 years, 45–64 years, and 65+ years, and a single group of high-risk people of all ages.
Uncertainty and sensitivity analysis
Uncertainty analysis
Probability distributions of epidemiological parameters were obtained from published literature (Table 1); distributions used incorporated both biological variations in influenza and human populations between years, as well as the variation inherent in estimating population-level quantities from sample statistics. Each input parameter distribution was sampled 5000 times. For each set of sampled parameters, we computed the optimal vaccine allocation.
Sensitivity analysis
Building on the uncertainty analysis, we ranked the model parameters according to their effect on optimal vaccine allocation. For each input parameter (epidemiological parameter) and output variable (outcome measure), we computed the partial rank correlation coefficient (PRCC) to measure the strength of monotonic association between the input parameters and the output variable [29]. The larger the PRCC, the stronger the influence of the model parameter on the optimal proportion of individuals vaccinated in each group. We used PRCCs to evaluate the importance of input parameters in contributing to the variability of the outcome measure. However, PRCCs do not provide quantitative insight into how much change occurs in an output variable as a result of the uncertainty in a given input parameter. To address this issue we computed the first-order sensitivity index of input parameters in contributing to the variability of the optimal vaccine allocation. The first-order sensitivity index is the expected reduction in the variance of an output variable that would be obtained if the input parameter were fixed instead of uncertain [30]. For computational efficiency, we computed the index on a second-order regression model fitting the input parameters and the output variables of our model.
Reproductive number
To determine the relative contribution of an age group to disease transmission, we computed the within- and between-group reproductive number. The within-group reproductive number was defined as the expected number of new infections produced in an age-group by an infectious individual from the same age-group, and the between-group reproductive number was defined as the expected number of new infections produced in an age group by an infectious individual from another age group.
Results
Uncertainty analysis
In the absence of vaccination, the model predicted an attack rate, proportion of the population infected during the epidemic, of 32% (95% CI: 20%–37%). Empirical estimate of attack rate is very difficult to determine, as a significant proportion of infections are asymptomatic and only a proportion of symptomatic cases seek healthcare. However, the predictions of our model are consistent with that of other models of seasonal influenza in the USA [31,32]. The annual influenza vaccination coverage in the United States average 34% [33], which is approximately equal to an uptake of 100 million doses per year. We showed that when more than 60 million doses of vaccine were distributed, optimization over uncertainty robustly yielded prioritization of vaccination to schoolchildren (aged 5–17) and young adults (18–44) for all five outcome measures considered (Figure 1). When the optimal outcome minimized the total number of deaths, minimized years of life loss, or was quantified by contingent valuation, people at high risk should also be prioritized for vaccination (Figure 1). The optimal vaccine allocation became more sensitive to the outcome measure for fewer doses of vaccine (Figures S1–S3). As the amount of vaccine available was reduced, vaccination priority shifted away from young adults (aged 18–44) to schoolchildren (aged 5–17) when the optimal outcome minimized the total number of infections or hospitalizations. However, when the optimal outcome minimized the total number of deaths, minimized years of life loss, or was quantified by contingent valuation, vaccination priority shifted away from young adults (aged 18–44) to people at high risk for complications.
Figure 1.
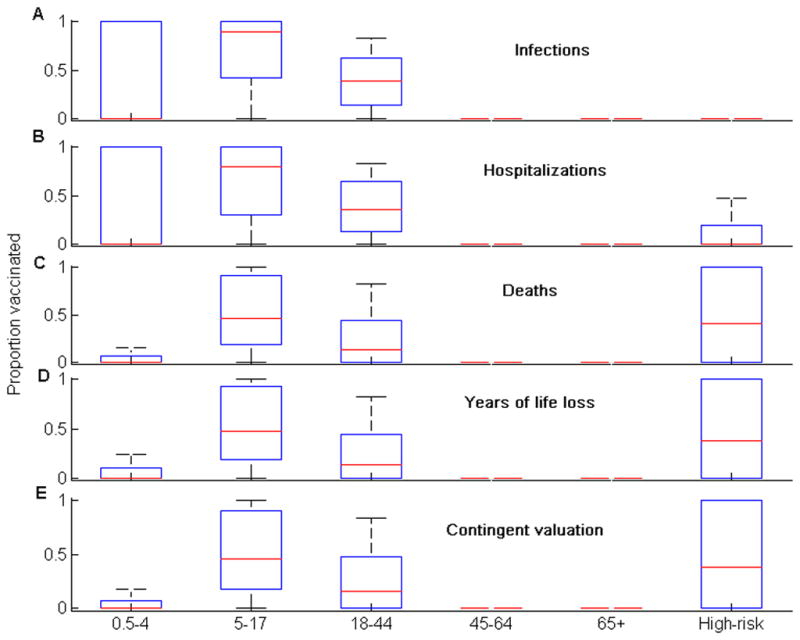
The optimal allocation of 80 million vaccine doses for the five different outcome measures. The box-plot shows the median (red line), the interquartile range (blue box), and the minimum and maximum values (black bars) of the optimal proportion of individuals vaccinated for each group.
Sensitivity analysis
Our multivariate sensitivity analysis demonstrated that the reproductive number and infectious period are the most important parameters (|PRCC|>0.5) in determining the optimal vaccine allocation strategy for the five outcome measures (Table 2). The partial rank correlation coefficients associated with the infection period were highly statistically significant (p value < 0.001). The reproductive number and infectious period alone explaining almost 90% of the variability observed in the optimal allocation of vaccines for the five different outcome measures (Table 3).
Table 2.
PRCCC sensitivity of optimal vaccine allocation to epidemiological parameters of the seasonal influenza model for the five different outcome measures.
| Outcome measure | |||||||||
|---|---|---|---|---|---|---|---|---|---|
| Deaths | Years of life loss | Contingent value | Infections | Hospitalizations | |||||
| Parameter | PRCC | Parameter | PRCC | Parameter | PRCC | Parameter | PRCC | Parameter | PRCC |
| Recovery rate ages 0–14 | 0.60 | Recovery rate ages 0–14 | 0.59 | Reproductive number (R) | 0.83 | Reproductive number (R) | 0.59 | Recovery rate ages 15+ | −0.56 |
| Recovery rate ages 15+ | −0.58 | Recovery rate ages 15+ | −0.55 | Recovery rate ages 15+ | −0.61 | Recovery rate ages 15+ | −0.58 | Recovery rate ages 0–14 | 0.54 |
| Reproductive number (R) | 0.58 | Vaccine efficacy (vs infection) ages 16–65 | −0.24 | Recovery rate ages 0–14 | 0.60 | Recovery rate ages 0–14 | 0.55 | Vaccine efficacy (vs infection) ages 16–65 | −0.25 |
Partial rank correlation coefficients (PRCCs) were used to determine the association between the optimal proportions of individuals vaccinated in each group and input parameters of the model. The amount of vaccine was 80M doses. The PRCC of each parameter was statistically significant (P value <0.001).
Table 3.
First-order SI sensitivity of optimal vaccine allocation to epidemiological parameters of the seasonal influenza model for the five different outcome measures.
| Outcome measure | |||||||||||
|---|---|---|---|---|---|---|---|---|---|---|---|
| Deaths | Years of life loss | Contingent value | Infections | Hospitalizations | |||||||
| Parameter | SI | Parameter | SI | Parameter | SI | Parameter | SI | Parameter | SI | ||
| Age group 5–17 | Recovery rate ages 0–14 | 0.51 | Recovery rate ages 0–14 | 0.46 | Recovery rate ages 0–14 | 0.50 | Age group 0.5–4 | Recovery rate ages 15+ | 0.56 | Recovery rate ages 15+ | 0.52 |
| Recovery rate ages 15+ | 0.30 | Recovery rate ages 15+ | 0.29 | Recovery rate ages 15+ | 0.28 | Recovery rate ages 0–14 | 0.41 | Recovery rate ages 0–14 | 0.41 | ||
| Reproductive number (R) | 0.10 | Reproductive number (R) | 0.19 | Reproductive number (R) | 0.16 | Vaccine efficacy (vs infection) ages 0.5–16 | 0.004 | Vaccine efficacy (vs infection) ages 16–65 | 0.03 | ||
| Age group 18–44 | Recovery rate ages 0–14 | 0.48 | Recovery rate ages 15+ | 0.33 | Recovery rate ages 0–14 | 0.41 | Age group 5–17 | Recovery rate ages 0–14 | 0.54 | Recovery rate ages 0–14 | 0.54 |
| Recovery rate ages 15+ | 0.47 | Recovery rate ages 0–14 | 0.32 | Recovery rate ages 15+ | 0.35 | Recovery rate ages 15+ | 0.43 | Recovery rate ages 15+ | 0.33 | ||
| Reproductive number (R) | 0.03 | Reproductive number (R) | 0.20 | Reproductive number (R) | 0.13 | Susceptibility ages 5–17 | 0.013 | Reproductive number (R) | 0.07 | ||
| High-risk group | Recovery rate ages 15+ | 0.41 | Reproductive number (R) | 0.81 | Reproductive number (R) | 0.77 | Age group 18–44 | Recovery rate ages 15+ | 0.49 | Recovery rate ages 0–14 | 0.46 |
| Recovery rate ages 0–14 | 0.30 | Vaccine efficacy (vs infection) ages 16–65 | 0.06 | Recovery rate ages 15+ | 0.04 | Recovery rate ages 0–14 | 0.48 | Recovery rate ages 15+ | 0.41 | ||
| Reproductive number (R) | 0.21 | Recovery rate ages 15+ | 0.03 | Vaccine efficacy (vs infection) ages 16–65 | 0.03 | Susceptibility ages 5–17 | 0.006 | Vaccine efficacy (vs infection) ages 16–65 | 0.08 | ||
The first-order sensitivity index (SI) was used to determine the contribution of input parameters to the variability of the optimal proportions of individuals vaccinated per group. The analysis only considered groups with sufficient variability in the distribution of the optimal proportion of vaccinated individuals (Figure 1). The amount of vaccine was 80M doses.
Monotonic relationships between outcomes and input variables of the model, assumed in our sensitivity analysis, were verified (Figures 2–6). The optimal proportion of schoolchildren (aged 5–17) vaccinated increased as the infectious period of people aged 0–14 increased, and it decreased as the infectious period of people over 15 increased. For young adults (aged 18–44), the optimal proportion vaccinated increased as the infectious period of people aged 0–14 decreased, and decreased as the infectious period of people over 15 decreased. For a given value of the reproductive number (R), the relative contribution of each age-group (e.g. schoolchildren and young adults) to disease transmission increased with its infectious period (Figures 7 & 8). As expected, the optimal proportion of vaccinated individuals in each age group increased with its (within- and between-group) reproductive numbers (Figures 2–8). Therefore, the optimal vaccine allocation strategy between the different age groups would mainly depend on the relative contribution (within and between group reproductive numbers) of each age group to disease transmission.
Figure 2.
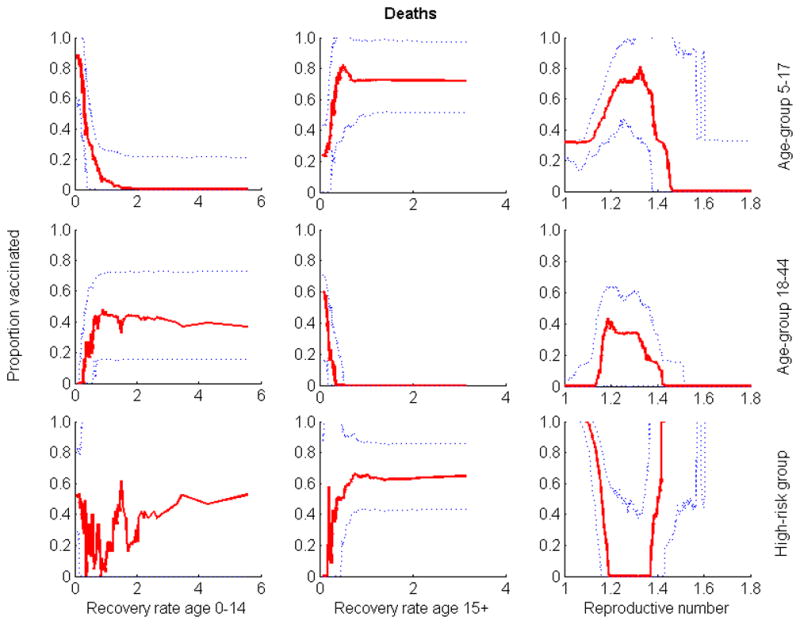
Relationship between the three parameters whose uncertainty exhibited the greatest impact on outcome and the optimal proportion of vaccine allocated to groups when minimizing the number of deaths. Optimization was performed for 80 million doses of vaccine. Solid lines are medians; dotted lines are 25th and 75th percentiles.
Figure 6.
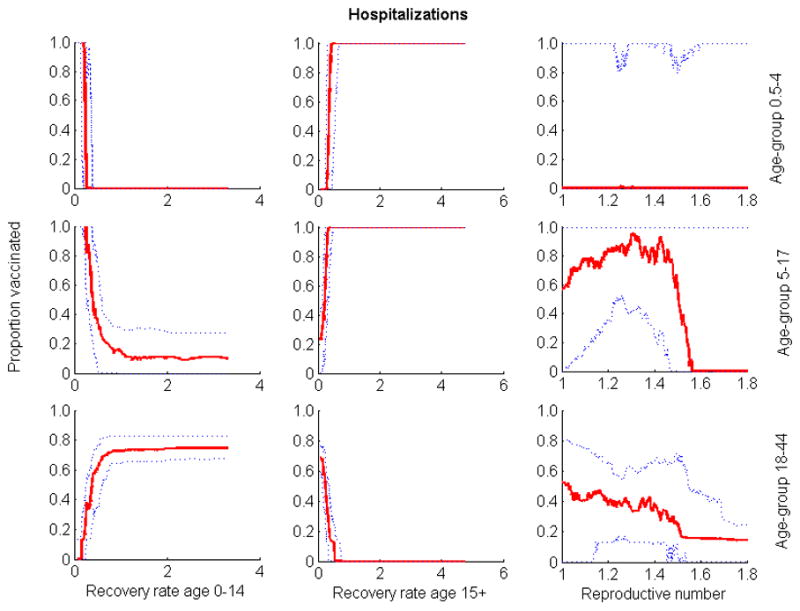
Relationship between the three parameters whose uncertainty exhibited the greatest impact on outcome and the optimal proportion of vaccine allocated to the different groups when quantifying outcome by number of hospitalizations. Optimization was performed for 80 million of vaccine doses. Solid lines are medians; dotted lines are 25th and 75th percentiles.
Figure 7.
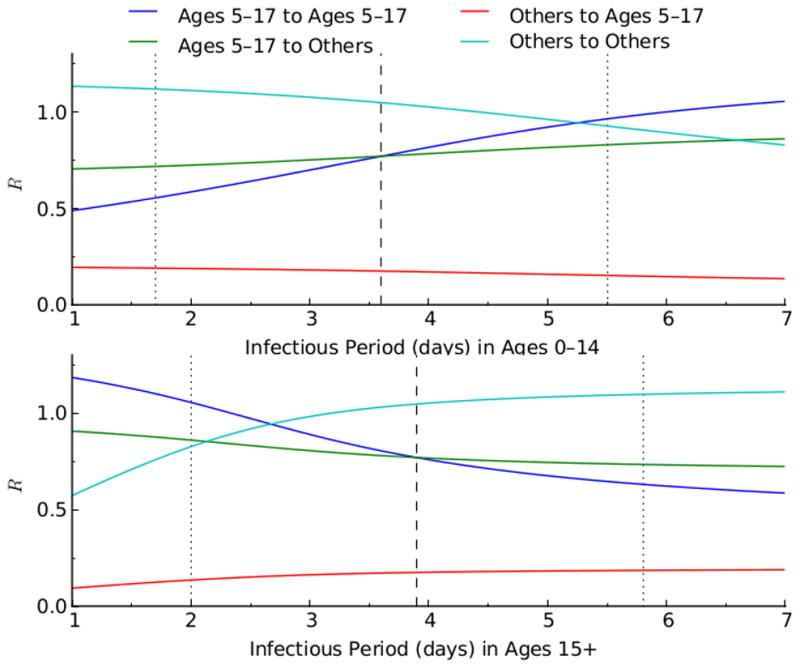
Relationship between the reproductive numbers (R), of the age group 5–17 and the other age groups, and the infectious period (1/recovery rate). The blue and green lines show respectively the within- and between-group reproductive number of age group 5–17. The light blue and red lines represent respectively the within- and between-group reproductive number of the other age groups.
Figure 8.
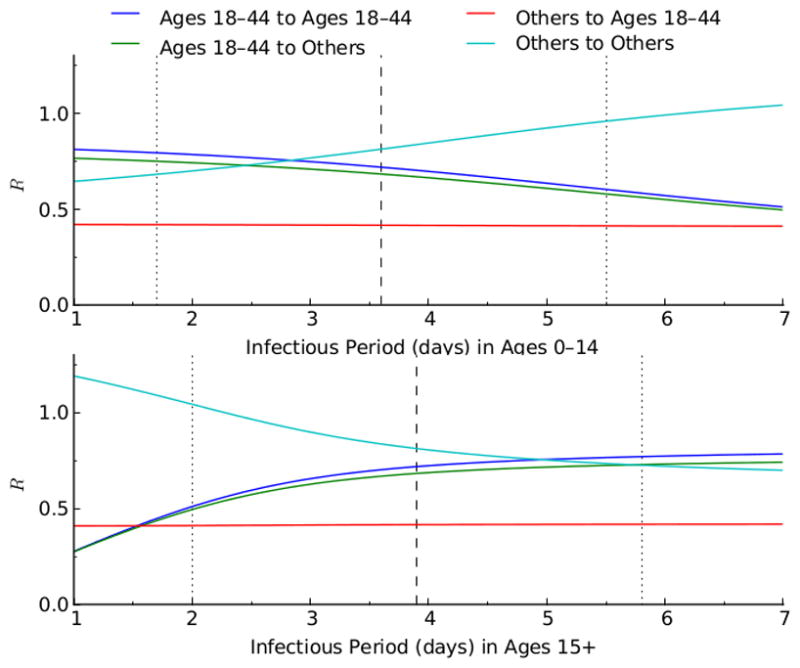
Relationship between the reproductive numbers (R), of the age group 18–44 and the other age groups, and the infectious period (1/recovery rate). The blue and green lines show respectively the within- and between-group reproductive number of age group 18–44. The light blue and red lines represent respectively the within- and between-group reproductive number of the other age groups.
In the absence of considering parameter uncertainty, model results suggest that it would not be optimal to vaccinate high risk groups when vaccines are in abundance. However, uncertainty analysis demonstrates that even when vaccines are abundant, there is a high probability that also vaccinating high risk groups will be optimal. When minimizing the total number of deaths, minimizing years of life lost, or quantifying outcomes by contingent valuation, uncertainty analysis illustrated a synergistic dependence of the optimal proportion of vaccinated individuals in the high-risk group upon the value of the reproductive number (R) (Figures 2–6). When R was smaller than 1.2, the high-risk group was added to the vaccination priority groups (schoolchildren and young adults) (Figures 2–6). In scenarios consistent with these criteria, there are enough vaccines to protect high risk individuals through direct vaccination as well as by curtailing infection from the schoolchildren and young adults groups. When R was greater than 1.5, there is not enough vaccine to provide sufficient indirect protection to the high-risk group through herd immunity. In these cases, minimizing mortality was best achieved through direct protection of the high-risk group.
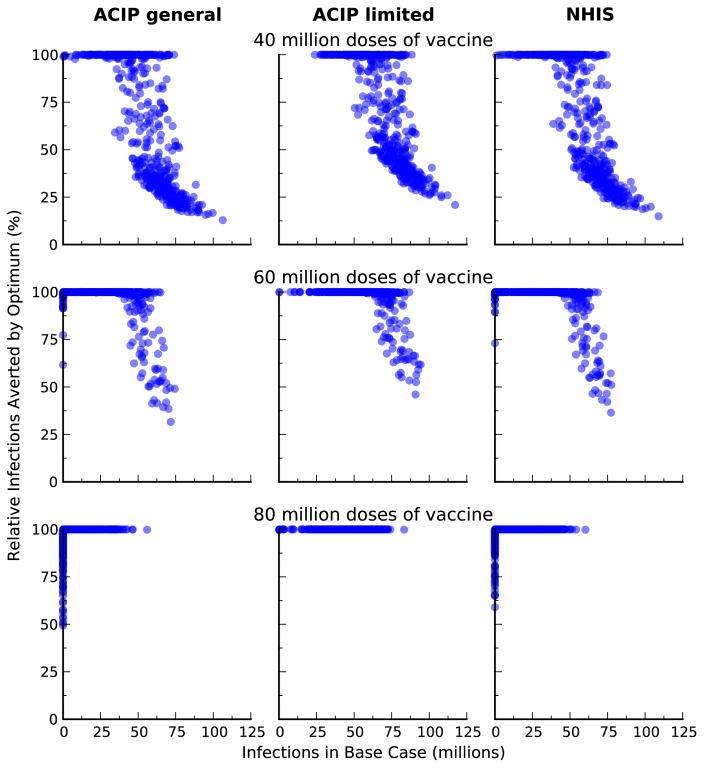
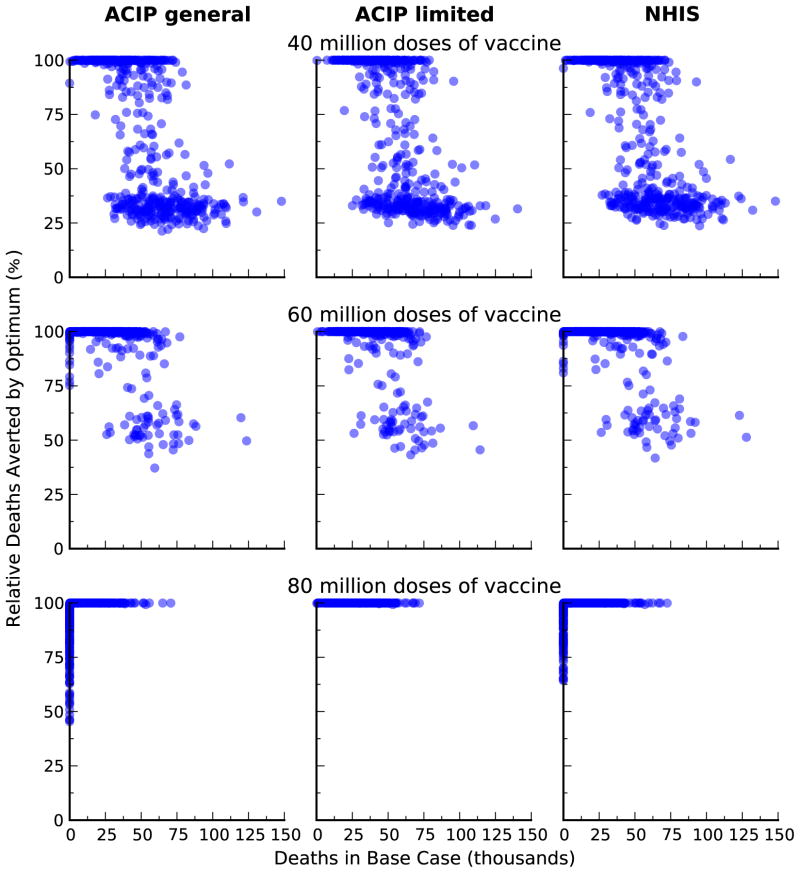
We compared the optimal vaccine allocation strategies with two vaccination strategies based on the United States Centers for Diseases Control and Preventions’ Advisory Committee on Immunization Practices (ACIP) recommendations for influenza vaccination [34] and vaccination strategy based on the 2011 National Health Interview Survey (NHIS) data [35]. The ‘Uniform’ strategy is based on the ACIP recommendations that everyone should get vaccinated when there is plenty of vaccine. Here, we assumed that all age and risk groups have equal coverage. The ‘High-risk’ strategy is based on the ACIP recommendations that high-risk people, children age 0.5–4, and adults age 50+ should get vaccinated when vaccine is limited. Here, we assumed that these risk and age groups have equal coverage. The ‘NHIS’ strategy is based on influenza vaccine use reported in the 2011 NHIS survey data. Here, we assumed that the relative proportion of individuals vaccinated in each group remains fix as the amount of vaccine varies. We showed that our optimal strategies performed substantially better than these ad hoc strategies (Figure 9).
Figure 9.
Comparison of outcomes between optimal and alternative vaccination strategies. We compare reduction in infections from the optimal allocation of different amount of vaccine, relative to three different alternative strategies: the 2011 vaccination coverage in the USA (NHIS); uniform coverage for all age and risk groups (Uniform); and uniform coverage of high-risk group, age 0–4, and age 50+ (High-risk).
Discussion
In this study, we incorporated epidemiological parameter uncertainty into the analysis of optimal allocation of vaccine for the control of seasonal influenza. Using epidemiological and demographic data on seasonal influenza in the United States, we showed that vaccinating children and young adults is the best strategy for mitigating the seasonal influenza. Previous studies have yielded similar result [3,8]. However, the robustness of this result to factors such as uncertainty of epidemiological parameters has been questioned [11]. Here, we have extended these previous studies by investigating the robustness of this result to parameter uncertainty.
Using parameter estimates from historical influenza data, we constructed probability distributions of optimal age-specific allocation of vaccine for the control of seasonal influenza. In general, vaccinating schoolchildren and young adults was the optimal strategy for mitigating seasonal influenza due to schoolchildren being most responsible for influenza transmission, while vaccinating their parents (young adults) serves to block transmission to the rest of the population. Therefore, prioritizing these age groups for vaccination generates substantial benefit for the entire population through herd immunity. The prioritization of schoolchildren and young adults was remarkably robust to uncertainty in influenza epidemiology, to the metric used to measure outcomes, and, to a lesser extent, to the amount of vaccine available. However, uncertainty analysis demonstrated that when the optimal outcome is to minimize deaths, minimize years of life lost, or minimize contingent valuation, and when vaccines are abundant, people at high risk should also be prioritized for vaccination.
Sensitivity analysis of our influenza model identified that the reproductive number and the relative contribution of the age groups to disease transmission (within- and between group reproductive numbers) as the parameters that most influenced optimal vaccination strategy. Therefore, better and rapid assessment of these parameters are essential in developing optimal vaccination strategies for seasonal influenza.
Our results provide guidelines on how to adjust allocation efforts in response to the variable yield of yearly vaccine development. If the amount of available vaccine is low (less than 20% of amount necessary to cover the entire population), the optimal vaccination strategy should be adjusted, and the adjustment depends on the outcome measure used. When the objective is to minimize infections or hospitalizations, vaccination priority should be given to schoolchildren. When the outcome measure is to minimize deaths, years of life loss, or contingent valuation, vaccination priority should progressively be shifted away from young adults toward people at high risk of complications. Therefore, in the presence of low vaccine uptake among young adults, people at high risk should be targeted for vaccination. Achieving high vaccination coverage among children, six months through 18 years of age, remains a very challenging task [37,38]. In the United States, the existing pediatric immunization infrastructure does not have the capacity to vaccine a high proportion of children each year [37,38]. Increasing the level of vaccination coverage among school children would require additional development of the vaccination infrastructure and an increase of parental consent for yearly vaccination of their children through school-located vaccination programs [36–38].
Ideally, our analysis would have used United States data for seasonal influenza. However, age- specific contact data for the United States are not available. Instead, we used the European POLYMOD contact survey data to parameterize the age-specific mixing matrix of our model. We anticipate that there would be little difference between the European age-specific mixing matrix and one generated from US data, but such data would be welcome. Our study could be extended by investigating the impact of uncertainty associated with the mixing matrix on the optimal vaccine allocation for the control of influenza.
Our results show that vaccinating schoolchildren against influenza can substantially reduce disease morbidity and mortality within the entire population despite the inherent uncertainty in influenza epidemiology and vaccination. Furthermore, our study illustrates the importance of incorporating parameter uncertainty into the analysis of mathematical models of public health interventions.
Supplementary Material
Figure 3.

Relationship between the three parameters whose uncertainty exhibited the greatest impact on outcome and the optimal proportion of vaccine allocated to the different groups when minimizing the number of years of life lost. Optimization was performed for 80 million doses of vaccine. Solid lines are medians; dotted lines are 25th and 75th percentiles.
Figure 4.
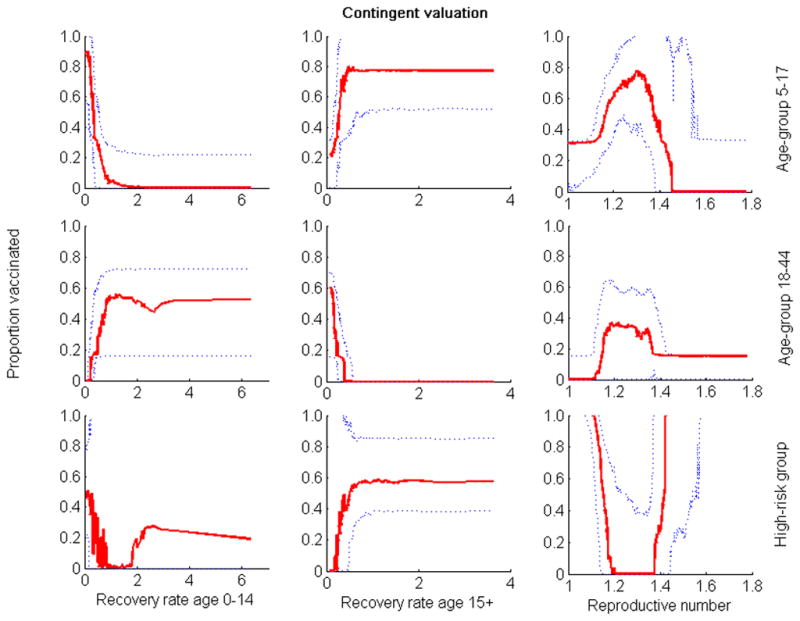
Relationship between the three parameters whose uncertainty exhibited the greatest impact on outcome and the optimal proportion of vaccine allocated to the different groups when quantifying outcome by contingent valuation. Optimization was performed for 80 million of vaccine doses. Solid lines are medians; dotted lines are 25th and 75th percentiles.
Figure 5.
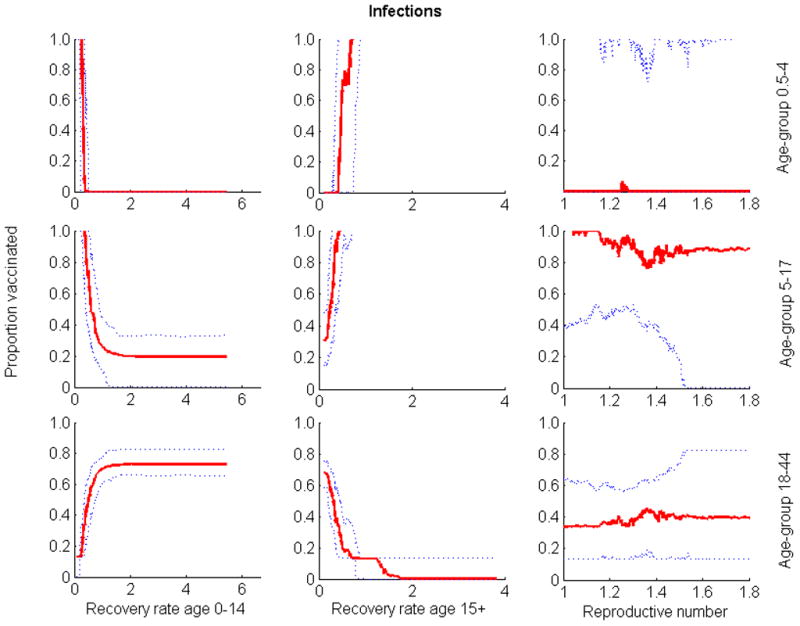
Relationship between the three parameters whose uncertainty exhibited the greatest impact on outcome and the optimal proportion of vaccine allocated to the different groups when quantifying outcome by number of infections. Optimization was performed for 80 million of vaccine doses. Solid lines are medians; dotted lines are 25th and 75th percentiles.
Figure 10.
Comparison of outcomes between optimal and alternative vaccination strategies. We compare reduction in deaths from the optimal allocation of different amount of vaccine, relative to three different alternative strategies: the 2011 vaccination coverage in the USA (NHIS); uniform coverage for all age and risk groups (Uniform); and uniform coverage of high-risk group, age 0–4, and age 50+ (High-risk).
Highlights.
We develop a mathematical model of seasonal influenza in the United States
We identify optimal vaccination allocation strategies under parameter uncertainty
Strategies targeting schoolchildren and young adults are robust to uncertainty
Parameter uncertainty is vital to the evaluation of public health interventions
Acknowledgments
Funding: National Institute of General Medical Sciences MIDAS grant U01GM087719. Funding sources played no role in the design or analysis of this study
Footnotes
Conflicts of Interest: None declared.
Publisher's Disclaimer: This is a PDF file of an unedited manuscript that has been accepted for publication. As a service to our customers we are providing this early version of the manuscript. The manuscript will undergo copyediting, typesetting, and review of the resulting proof before it is published in its final citable form. Please note that during the production process errors may be discovered which could affect the content, and all legal disclaimers that apply to the journal pertain.
References
- 1.Molinari NA, Ortega-Sanchez IR, Messonnier ML, Thompson WW, Wortley PM, Weintraub E, et al. The annual impact of seasonal influenza in the US: measuring disease burden and costs. Vaccine. 2007;25:5086–96. doi: 10.1016/j.vaccine.2007.03.046. [DOI] [PubMed] [Google Scholar]
- 2.Monto AS. The risk of seasonal and pandemic influenza: prospects for control. Clin Infect Dis. 2009;48 (Suppl 1):S20–S25. doi: 10.1086/591853. [DOI] [PubMed] [Google Scholar]
- 3.Medlock J, Galvani AP. Optimizing influenza vaccine distribution. Science. 2009;325:1705–1708. doi: 10.1126/science.1175570. [DOI] [PubMed] [Google Scholar]
- 4.Tuite AR, Fishman DN, Kwong JC, Greer AL. Optimal Pandemic Influenza Vaccine Allocation Strategies for the Canadian Population. PLoS ONE. 2010;5(5):e10520. doi: 10.1371/journal.pone.0010520. [DOI] [PMC free article] [PubMed] [Google Scholar]
- 5.Mylius S, Hagenaars T, Lugner A, Wallinga J. Optimal allocation of pandemic influenza vaccine depends on age, risk and timing. Vaccine. 2008;26:3742–49. doi: 10.1016/j.vaccine.2008.04.043. [DOI] [PubMed] [Google Scholar]
- 6.Matrajt L, Longini IM. Optimizing Vaccine Allocation at Different Points in Time during an Epidemic. PLoS ONE. 2011;5(11):e13767. doi: 10.1371/journal.pone.0013767. [DOI] [PMC free article] [PubMed] [Google Scholar]
- 7.Longini IM, Ackerman E, Elveback LR. An optimization model for influenza A epidemics. Math Biosci. 1978;38:141. [Google Scholar]
- 8.Goldstein E, Apolloni A, Lewis B, Miller JC, Macauley M, Eubank S, et al. Distribution of vaccine/antivirals and the ‘least spread line’ in a stratified population. J R Soc Interface. 2010;7:755–764. doi: 10.1098/rsif.2009.0393. [DOI] [PMC free article] [PubMed] [Google Scholar]
- 9.Earn D, Dushoff J, Levin S. Ecology and evolution of the flu. Trends Ecol Evol. 2002;17:334. [Google Scholar]
- 10.Carrat F, Flahault A. Influenza vaccine: The challenge of antigenic drift. Vaccine. 2007;25:6852–62. doi: 10.1016/j.vaccine.2007.07.027. [DOI] [PubMed] [Google Scholar]
- 11.Eisenberg JNS, Aiello AE, Spicknall IH, Monto AS, Reingold A. Protecting the herd from H1N1. Science. 2009;326:934. doi: 10.1126/science.326.5955.934-a. [DOI] [PubMed] [Google Scholar]
- 12.Ndeffo Mbah ML, Gilligan CA. Optimization of culling strategies for epidemics in metapopulations with symmetric and asymmetric transmission. J Theor Biol. 2010;262:757–763. doi: 10.1016/j.jtbi.2009.11.001. [DOI] [PubMed] [Google Scholar]
- 13.Sterman JD. Business Dynamics: Systems Thinking and Modeling for a Complex World. New York, Irwin: McGraw-Hill; 2000. [Google Scholar]
- 14.Bansal S, Pourbohloul B, Meyers LA. A Comparative Analysis of Influenza Vaccination Programs. PLoS Med. 2006;3(10):e387. doi: 10.1371/journal.pmed.0030387. [DOI] [PMC free article] [PubMed] [Google Scholar]
- 15.Centers for Disease Control and Prevention. Prevention and Control of Influenza with Vaccines: Recommendations of the Advisory Committee on Immunization Practices (ACIP), 2010. MMWR. 2010;59(RR-8):1–62. [PubMed] [Google Scholar]
- 16.Jefferson T, Di Pietrantonj C, Al-Ansary LA, Ferroni E, Thorning S, Thomas RE. Vaccines for preventing influenza in the elderly. Cochrane Database Syst Rev. 2010:CD004876. doi: 10.1002/14651858.CD004876.pub3. [DOI] [PubMed] [Google Scholar]
- 17.Meltzer MI, Cox NJ, Fukuda K. The economic impact of pandemic influenza in the United States: priority for intervention. Emerg Infect Dis. 1999;5:659–71. doi: 10.3201/eid0505.990507. [DOI] [PMC free article] [PubMed] [Google Scholar]
- 18.Miller MA, Viboud C, Olson DR, Grais RF, Rabaa RA, Simonsen L. Prioritization of influenza pandemic vaccination to minimize years of life loss. JJD. 2008;198:305–11. doi: 10.1086/589716. [DOI] [PMC free article] [PubMed] [Google Scholar]
- 19.Cauchemez S, Carrat F, Viboud C, Valleron AJ, Boelle PY. A Bayesian MCMC approach to study transmission of influenza: application to household longitudinal data. Statist Med. 2004;23:3469–87. doi: 10.1002/sim.1912. [DOI] [PubMed] [Google Scholar]
- 20.Balcan D, Hu H, Goncalves B, Bajardi P, Poletto C, Ramasco JJ, et al. Seasonal transmission potential and activity peaks of the new influenza A (H1N1): a Monte Carlo likelihood analysis based on human mobility. BMC Med. 2009;7:45. doi: 10.1186/1741-7015-7-45. [DOI] [PMC free article] [PubMed] [Google Scholar]
- 21.Elveback LR, Fox JP, Ackerman E. An influenza simulation model for immunization studies. Am J Epidemiol. 1976;103:152–65. doi: 10.1093/oxfordjournals.aje.a112213. [DOI] [PubMed] [Google Scholar]
- 22.Moser MR, Bender TR, Margolis HS, Noble GR, Kendal AP, Ritter DG. An outbreak of influenza aboard a commercial airliner. Am J Epidemiol. 1979;110:1–6. doi: 10.1093/oxfordjournals.aje.a112781. [DOI] [PubMed] [Google Scholar]
- 23.Shinde V, Bridges CB, Uyeki TM, Shu B, Balish A, Xu X, et al. Triple-Reassortant swine influenza A (H1) in humans in the United States, 2005–2009. NEJM. 2009;360:2616–25. doi: 10.1056/NEJMoa0903812. [DOI] [PubMed] [Google Scholar]
- 24.Longini IM, Koopman JS, Haber MJ, Cotsonis GA. Statistical inference for infectious diseases: Risk-specific household and community transmission parameters. Am J Epidemiol. 1988;123:845–859. doi: 10.1093/oxfordjournals.aje.a115038. [DOI] [PubMed] [Google Scholar]
- 25.Chowel G, Miller MA, Viboud C. Seasonal influenza in the United States, France and Australia: Transmission and prospects for control. Epidemiol Infect. 2008;136:852–64. doi: 10.1017/S0950268807009144. [DOI] [PMC free article] [PubMed] [Google Scholar]
- 26.Zimmerman RK, Lauderdale DS, Tan SM, Wagener DK. Prevalence of high-risk indications for influenza vaccine varies by age, race, and income. Vaccine. 2010;28:6470–77. doi: 10.1016/j.vaccine.2010.07.037. [DOI] [PMC free article] [PubMed] [Google Scholar]
- 27.Osterholm M, Kelley NS, Sommer A, Belongia EA. Efficacy and effectiveness of influenza vaccines: a systematic review and meta-analysis. Lancet Infect Dis. 2012;12:36–44. doi: 10.1016/S1473-3099(11)70295-X. [DOI] [PubMed] [Google Scholar]
- 28.Treanor JJ, Talbot HK, Ohmit SE, Coleman LA, Thompson MG, Cheng P-Y, et al. Effectiveness of seasonal vaccines in the United States during a season with circulation of all three vaccines strains. Clinical Infect Dis. 2012;55 (7):951–9. doi: 10.1093/cid/cis574. [DOI] [PMC free article] [PubMed] [Google Scholar]
- 29.Marino S, Ian B, Ray CJ, Kirschner DE. A methodology for performing global uncertainty and sensitivity analysis in systems biology. J Theor Biol. 2008;254:178–196. doi: 10.1016/j.jtbi.2008.04.011. [DOI] [PMC free article] [PubMed] [Google Scholar]
- 30.Saltelli A, Tarantola S. On the relative importance of input factors in mathematical models: Safety assessment for nuclear waste disposal. J Am Stat Assoc. 2002;97(459):702–709. [Google Scholar]
- 31.Basta NE, Chao DL, Halloran ME, Matrajt L, Longini IM. Strategies for pandemic and seasonal influenza vaccination of schoolchildren in the United States. Am J Epidemiol. 2009;170 (6):679–686. doi: 10.1093/aje/kwp237. [DOI] [PMC free article] [PubMed] [Google Scholar]
- 32.Chao DL, Halloran ME, Obenchain VJ, Longini IM. FLuTE, a publicly available stochastic influenza epidemic simulation model. PloS Comp Biol. 2010;6(1):e1000656. doi: 10.1371/journal.pcbi.1000656. [DOI] [PMC free article] [PubMed] [Google Scholar]
- 33.Centers for Disease Control and Prevention. Influenza vaccination coverage among children and adults - United States, 2008–09 influenza season. MMWR Morb Mortal Wkly Rep. 2009;58:1091–5. [PubMed] [Google Scholar]
- 34.Centers for Disease Control and Prevention. Prevention and control of influenza with vaccines: recommendations of the Advisory Committee on Immunization Practices (ACIP), 2010. MMWR. 2010;59(RR-8) [PubMed] [Google Scholar]
- 35.Centers for Disease Control and Prevention. [Accessed 28 November 2012];National Health Interview Survey, 2012 A. 2011 http://www.cdc.gov/NCHS/nhis/nhis_2011_data_release.htm.
- 36.Cawley J, Hull HF, Rosculp MD. Strategies for implementing influenza vaccination of school- aged children—A systematic literature review. J Sch Health. 2010;80:167–75. doi: 10.1111/j.1746-1561.2009.00482.x. [DOI] [PubMed] [Google Scholar]
- 37.Hull HF, Ambrose CS. Current experience with school-located influenza vaccination programs in the United States. Human vaccines. 2011;7:153. doi: 10.4161/hv.7.2.13668. [DOI] [PMC free article] [PubMed] [Google Scholar]
- 38.Fiore AE, Epperson S, Perrotta D, Bernstein H, Neuzil K. Expanding the recommendations for annual influenza vaccination to school-age children in the United States. Pediatrics. 2012;129 (suppl 2):S54–S62. doi: 10.1542/peds.2011-0737C. [DOI] [PubMed] [Google Scholar]
Associated Data
This section collects any data citations, data availability statements, or supplementary materials included in this article.


