Abstract
The real-time application of acoustic radiation force impulse (ARFI) imaging requires both short acquisition times for a single ARFI image and repeated acquisition of these frames. Due to the high energy of pulses required to generate appreciable radiation force, however, repeated acquisitions could result in substantial transducer face and tissue heating. We describe and evaluate several novel beam sequencing schemes which, along with parallel-receive acquisition, are designed to reduce acquisition time and heating. These techniques reduce the total number of radiation force impulses needed to generate an image and minimize the time between successive impulses. We present qualitative and quantitative analyses of the trade-offs in image quality resulting from the acquisition schemes. Results indicate that these techniques yield a significant improvement in frame rate with only moderate decreases in image quality. Tissue and transducer face heating resulting from these schemes is assessed through finite element method modeling and thermocouple measurements. Results indicate that heating issues can be mitigated by employing ARFI acquisition sequences that utilize the highest track-to-excitation ratio possible.
I. Introduction
Significant research has been performed on acoustic radiation force-based elasticity imaging as a means to investigate the mechanical properties of soft tissues [1]–[7]. Focused acoustic radiation force has been shown to displace soft tissue and subsequently generate shear waves traveling perpendicular to the direction of longitudinal wave propagation and away from the focus. The magnitude of this displacement is inversely proportional to the tissue's mechanical stiffness, whereas the phase velocity of the generated shear waves is reflective of the tissue's shear modulus [1], [2], [8].
Acoustic radiation force impulse (ARFI) imaging is a radiation force-based elasticity imaging technique that tracks the dynamic response of tissue to a focused impulse of acoustic radiation force. Real-time implementation of the technique has been hampered by 3 primary issues: data transfer/processing rates, frame acquisition time, and thermal safety [9]. As scanners’ on-board processing capabilities continue to evolve, data transfer/processing rates should no longer impede ARFI imaging's real-time implementation; further discussion of this topic is beyond the scope of this paper [10]. More fundamentally, frame acquisition time and thermal safety can be addressed by utilizing custom ARFI imaging beam sequences.
Assuming that a well-sampled (e.g., >80 lateral lines) field of view (FOV) is desired, a conventional ARFI imaging sequence can take hundreds of milliseconds to acquire a single frame, limiting its real-time frame rate to just a few frames per second (fps). Yet, to minimize geometric distortion of an image in the presence of physiologic motion, it is often necessary to reduce ARFI frame acquisition time [11]. Cardiac motion results in velocities in excess of 17 cm/s and accelerations in excess of 190 cm/s2 during systole [12], [13]. With this kind of motion, frame acquisition times would have to be considerably less than the hundreds of milliseconds offered by conventional ARFI imaging to achieve consistent spatial registration within a single frame. Although it might be difficult to implement ARFI imaging during systole, this example highlights the need to decrease ARFI frame acquisition time to mitigate motion effects present throughout the cardiac cycle and other physiologic processes [14].
The use of long duration pulses to displace tissue in ARFI imaging raises questions of thermal safety. Previous work has indicated that implementation of ARFI imaging in a soft tissue environment with appropriate operating parameters can be thermally safe [15], [16]. A single ARFI excitation increases tissue temperature less than 0.04°C in the carotid artery and liver; yet, the 2-dimensional nature of ARFI imaging requires multiple excitations [11], [17]. When an image acquisition sequence, which generates a single frame, is then repeated for the purpose of real-time imaging, tissue temperature increases in excess of 4.5°C are possible at a mere 3 fps acquisition rate for an image consisting of 50 lateral lines [18]. In addition to internal tissue heating, transducer surface heating, or “face heating,” must also be considered [19]. Current International Electrotechnical Commission (IEC) safety standards limit transducer surface temperature increases to 6°C for clinical applications [20].
We investigated the advantages, including reduced heating and frame acquisition time, and disadvantages, notably diminished image quality, of 3 beam sequencing techniques: parallel-receive, multiplexed, and multi-time acquisition. Parallel-receive acquisition tracks multiple beam locations simultaneously during the dynamic response from a single ARFI excitation. Multiplexed acquisition transmits ARFI excitations (and tracks the resulting dynamic responses) at multiple locations during the expected recovery time of the tissue. Multi-time acquisition tracks multiple locations successively during the dynamic response from a single ARFI excitation. Simulations and experimental measurements were utilized to assess the impact of heating in each sequence. Frame acquisition times were calculated based on the number of transmitted pulses and pulse repetition frequency (PRF) used for each sequence. A qualitative comparison of the image quality resulting from the different sequences in a tissue-mimicking phantom and excised bovine cardiac tissue is presented. A quantitative comparison of image quality resulting from these sequences was then conducted by calculating the contrast-to-noise ratio (CNR) of a lesion embedded in a tissue-mimicking phantom.
II. Background
A. ARFI Imaging
ARFI imaging relies on displacement induced by acoustic radiation force. Acoustic radiation force results from a transfer in momentum of the propagating acoustic wave to the target medium. When absorption is the predominant attenuation mechanism in the medium, which is generally the case in soft tissue, radiation force generated from an acoustic plane wave can be expressed as follows [21]–[23]:
| (1) |
where F is the acoustic radiation force, α is the absorption coefficient of the tissue, I is the time-averaged acoustic beam intensity, and c is the speed of sound in the medium. The spatial distribution of this radiation force is dependent on the focal configuration of the transducer and the spatial distribution of the medium's absorption coefficient. ARFI imaging uses a local acoustic radiation force impulse and then tracks the resulting dynamic response with correlation-based methods. These tracking data are used to construct images depicting the following: displacement at a set time after force application, the maximum displacement achieved, the time needed to achieve maximum displacement, and the time required for the specimen to recover to its original position. These parameters have been shown to have an inverse relationship with tissue stiffness [8].
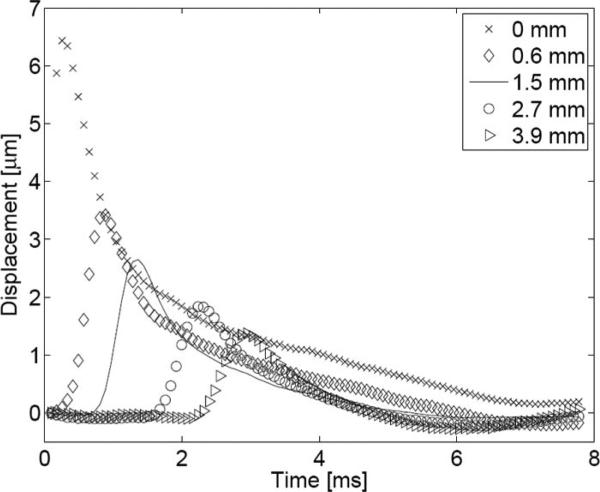
Along with localized displacement within the region of ultrasonic beam propagation, an ARFI excitation produces shear waves, which propagate in the direction transverse to the direction of longitudinal wave propagation. In the case of ARFI imaging, shear wave propagation produces axial displacement at laterally adjacent regions outside of the excitation volume. Fig. 1 shows on- and off-axis displacement observed following an ARFI excitation. Note that the peak displacement for each tracked location occurs later in time as the location moves farther away from the axis of excitation, with the peak for the 3.9 mm off-axis location occurring latest. The time at which this peak occurs depends on the location's distance from the axis of excitation as well as the speed of shear wave propagation. In a linear, isotropic, elastic medium, the speed of these shear waves can be expressed as follows:
| (2) |
where μ is the shear modulus, E is the young's modulus, ν is the Poisson's ratio, and ρ is the density of the tissue. This relationship demonstrates that the shear wave velocity is proportional to the tissue's stiffness. A typical range for shear wave velocities in soft tissue is 1 to 5 m/s [24]. Note in Fig. 1 that peak displacement diminishes as the track location moves farther away from the axis of excitation, resulting from geometric spreading of the wave and viscous losses in the propagation medium.
Fig. 1.
On-axis and off-axis response to an ARFI excitation in a homogeneous phantom. The axial displacement is plotted as a function of time following the initiation of an ARFI excitation for 5 locations: 0.0 (on-axis), 0.6, 1.5, 2.7, and 3.9 mm laterally offset from the axis of excitation.
B. Conventional ARFI Imaging Acquisition
A conventional ARFI imaging sequence interrogates 20–100 lateral locations to form a 2-dimensional image. For each lateral location, a “reference” pulse is transmitted to obtain a radio frequency (RF) echo line before the tissue is displaced. an ARFI excitation, or “push(ing),” pulse of similar amplitude but of increased length (typically between 20 and 200 μs) is then transmitted at that location. “Tracking” pulses are then repeatedly transmitted at this location to obtain multiple RF echo lines during the tissue's dynamic response. The resulting displacements are calculated by implementing correlation-based delay estimation techniques between the tracking RF lines and the reference line. Once the tissue has recovered from the initial ARFI excitation, this sequence (i.e., reference pulse, push pulse, and tracking pulses) is repeated at adjacent beam locations until the desired FOV has been interrogated. A 2-dimensional ARFI displacement image can then be generated for each tracking pulse, capturing the specimen's dynamic response resulting from an ARFI excitation at a specific time. For display purposes, however, only the displacement image at a single time step is presented; the displayed time step is often chosen to occur near the estimated moment of peak tissue displacement.
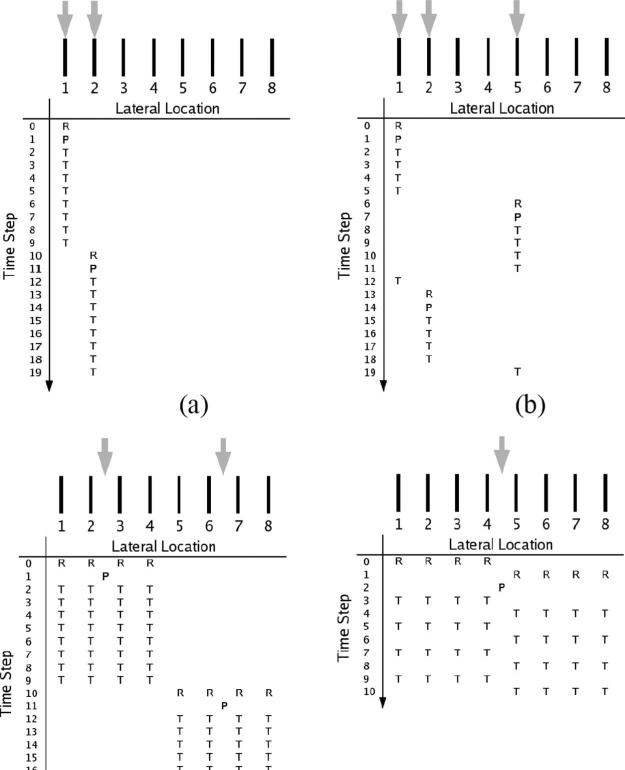
A conventional ARFI sequence is diagrammed in Fig. 2(a). In each beam sequence diagram, the horizontal axis represents lateral beam locations, whereas the vertical axis denotes the time step at which an event occurs. Time steps are defined as the number of pulse repetition intervals (PRIs) following the initial reference pulse. The 3 different ARFI sequencing events—reference pulses, pushing pulses, and tracking pulses—are denoted by the letters R, P, and T, respectively. Above each sequencing chart, receive-beam and transmit-beam locations are denoted by black bars and gray arrows, respectively; in the nonparallel cases, these locations can coincide.
Fig. 2.
Diagrams for the following ARFI imaging beam sequences: (a) conventional, (b) multiplexed, (c) parallel-receive, and (d) multi-time. Black bars denote the lateral locations of tracking beams; gray arrows, the relative ARFI excitation locations. Within each diagram, the horizontal axis denotes relative tracking/push locations, whereas the vertical axis represents time. Reference, push, and track pulses are represented with the characters R, P, and T, respectively.
The overall frame acquisition time in the conventional mode is dictated by 2 factors: the tissue's expected recovery time and the number of interrogated lateral locations. The time needed for the tissue to recover to its initial position (in the absence of physiologic motion) determines how long displacement is tracked at each lateral location. Following this expected recovery time, at least one additional tracking pulse is transmitted as an input to a motion filter, which is designed to reduce the effect of physiologic motion on the tracked ARFI response. The time needed to acquire a full frame in the conventional mode is thus roughly equal to the product of this expected recovery time and the total number of interrogated lateral locations.
C. Alternative Acquisition Schemes
Three beam sequencing techniques were investigated in the present study: parallel-receive acquisition, multiplexed acquisition, and multi-time acquisition. Each can be employed to reduce tissue/face heating and decrease frame acquisition time.
1) Parallel-Receive Acquisition
Parallel-receive beamforming, or just “parallel,” was first employed to increase b-mode frame rates in diagnostic ultrasound [25]. Dahl et al. incorporated this beamforming technique into ARFI imaging acquisition sequences [9]. They demonstrated that for each ARFI excitation it was possible to simultaneously track multiple adjacent locations, reducing frame acquisition time and tissue/face heating; the track-to-excitation ratio (TER), or number of receive-beam locations to transmit-beam locations, is N:1 for this scheme. With parallel-receive acquisition [see Fig. 2(c)], the transmitted pulse (both for the ARFI excitation and the reference/tracking pulses) is centered among a cluster of N adjacent receive-beam locations, which are sampled simultaneously and define the tracking locations. Due to hardware limitations, only 4 locations (i.e., N = 4) were tracked simultaneously for all parallel acquisitions employed in the current study. Parallel-receive acquisition relies on shear wave propagation in that displacement initially generated at the focus propagates to the outermost beam locations. For reference and tracking beams, it is important to use a high transmit F/# and a low receive F/# to obtain adequate transmit-beam amplitude for generating echoes at the outermost receive-beam locations and to ensure a narrow main lobe, respectively [9].
2) Multiplexed Acquisition
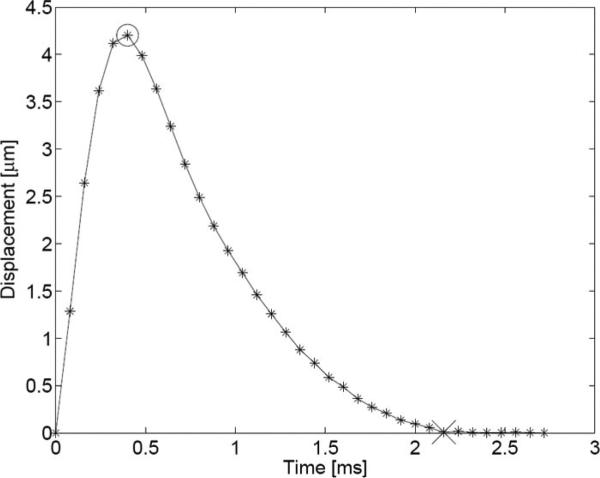
Multiplexed acquisition is a new technique that tracks multiple locations in the same amount of time needed to track just one location in the conventional scheme. The dynamic response resulting from an ARFI excitation in soft tissue generally follows a profile similar to the one depicted in Fig. 3. In the first portion of the response, just following the ARFI excitation, the tissue continues to displace away from the transducer, due to inertia, until a maximum displacement is achieved. This typically takes less than 1 ms, depending on intrinsic material properties and the width of the pushing beam [8]. Following the tissue's attainment of its maximum displacement (denoted with the circle), it typically takes 2–4 ms to recover to its approximate pre-excitation position (denoted with the “x”) in the absence of physiologic motion. Any residual displacement following the expected recovery time is used as input to a motion filter, which attempts to reduce the effect of physiologic motion on displacement tracking [26]. In the conventional scheme, the entire dynamic response from maximum displacement to recovery is tracked. In our experience, there exists little diagnostic information in tissue's exact recovery profile as it can be influenced by shear wave reflections resulting from nearby material boundaries [8]. The multiplexing technique, depicted in Fig. 2(b), focuses on the 2 most important elements of the response curve: the beginning, which captures the maximum displacement, and the tail end, which is needed as an input for the motion filter. The sequence starts out similar to conventional tracking, with a reference and push pulse fired at the initial location, but the resulting dynamic response at that location is tracked only until the time of expected maximum displacement. This sequence is then translated to a new lateral location, typically a distance of half the FOV's lateral extent. After the response is tracked at the new location until the expected time of maximum displacement, a tracking pulse is transmitted at the first location to obtain input for the motion filter. This process is then repeated until the entire FOV is interrogated and results in an approximate 2-fold reduction in the overall frame acquisition time over the conventional scheme. More aggressive reductions (i.e., if multiplexing is performed between N zones in the FOV, resulting in an N-fold reduction) are possible but were not implemented in this study.
Fig. 3.
Plot of the typical response of soft tissue to an ARFI excitation in the absence of physiologic motion. Axial displacement is plotted for a region at the focus of the excitation. Asterisks indicate sampling points; the circle indicates the point of peak displacement; the “x” denotes the point in time at which the medium has recovered.
3) Multi-Time Acquisition
Multi-time acquisition, also a new technique, takes advantage of the slow evolution of tissue's dynamic response profile (Fig. 3). In Fig. 2(d), multi-time acquisition is depicted in conjunction with parallel acquisition. Instead of tracking a single location (or 4 adjacent locations, in the parallel-receive case) throughout the dynamic response, tracking alternates between 2 adjacent tracking locations, both flanking the excitation beam location. In the context of this study, this technique was always employed in conjunction with parallel-receive beamforming, and tracking alternated between two 4-beam clusters (e.g., T[1:4] and T[5:8], where the letter indicates the type of pulse and the values inside the brackets indicate the range of beam locations, when separated by a colon, or specific beam locations, when separated by a comma). With the outermost beams (T [1,2,7,8]) likely outside of the full-width half-maximum beamwidth of the ARFI excitation, this technique relies on shear wave propagation to achieve uniform displacement at the outer beam locations. It achieves an approximate 2-fold reduction in overall frame acquisition time when compared with the parallel-receive scheme alone. When combined with the parallel technique, this acquisition scheme achieves a 2N-fold reduction over the conventional scheme and a TER of 2N:1 (again, for all experiments presented herein, N = 4). Because this technique alternates between 2 track locations (or clusters of locations), they will always be offset in time by one PRI. In the case of the example in Fig. 2(d), this means that beams T[1:4] will be sampled at even time steps while beams T[5:8] will be sampled at odd time steps. In an effort to eliminate this temporal offset, the displacement-versus-time profile for each lateral location was cubic spline interpolated through time, estimating displacement at all locations at a common time step.
4) Hybrid Acquisitions
It is possible to combine any or all of the previously detailed acquisition techniques. The inclusion of parallel-receive acquisition in the multi-time scheme has been explained. It is also possible to combine multiplexed acquisition with multi-time or parallel-receive acquisition. The multiplexed parallel scheme has a beam sequencing chart similar to that of multiplexed acquisition alone [Fig. 2(b)], except that tracking is multiplexed between two 4-beam clusters (T[1:4] and T[5:8], for instance) instead of just 2 beam locations (T[1] and T[5], for instance). Similarly, multiplexed acquisition can be combined with the multi-time parallel technique by multiplexing between two 8-beam clusters (T[1:8] and the next 8 adjacent beam locations, for example). The multiplexed parallel and multiplexed multi-time parallel (or MMP, as it will be referred to later) schemes can yield up to 2N-fold and 4N-fold reductions, respectively, in frame acquisition time when compared with the conventional method.
D. Thermal Effects
With the absorption of acoustic energy that results in radiation force, heat generation in dissipative media also occurs. This associated temperature increase can be estimated with the linear bio-heat transfer equation [18], [27]:
| (3) |
where Ṫ is the rate of temperature change, κ is the thermal diffusivity, T is the temperature, τ is the perfusion time constant, qv is the rate of heat production per unit volume (or heat source function), and cv is the volume specific heat. Due to the impulsive nature of ARFI imaging, heat generation is of short duration, and perfusion effects can generally be ignored during an ARFI frame, simplifying (3) to [18]
| (4) |
where thermal diffusivity κ and volume specific heat cv are material-dependent constants. The heat source function qv, resulting from a continuous, linearly traveling plane wave, can be expressed as [28]
| (5) |
where α is the absorption coefficient of the tissue and I is the time-averaged acoustic beam intensity. The spatial distribution of the heat source function is dependent on the focal configuration of the transducer and the spatial distribution of the medium's absorption coefficient.
III. Methods
Imaging performance was evaluated in a tissue-mimicking phantom and an ex vivo specimen through empirical methods, whereas thermal concerns were assessed through empirical (for face heating) and simulation-based (for tissue heating) techniques. All experiments and simulations were implemented on or modeled after a SONOLINE Antares scanner using either a VF7–3 or a VF10–5 commercial linear array (Siemens Medical Systems, Ultrasound Group, Issaquah, WA).
A. Imaging Performance Evaluation
1) Tissue-Mimicking Phantom
The transducer was fixed above a custom-made tissue-mimicking phantom (CIRS, Norfolk, VA) with an ultrasonic attenuation of 0.7 dB/cm/MHz and a speed of sound of 1540 m/s. The transducer was positioned so that a 3-mm-diameter, spherical lesion embedded in the phantom was aligned in the transducer's axial and elevational foci. The young's moduli of the phantom's background and lesion are 4 kPa and 58 kPa, respectively. For the qualitative studies, all 6 (conventional, multiplexed, parallel, multiplexed parallel, multi-time parallel, and MMP) ARFI acquisition sequences were acquired. Specific transmit parameters are listed in Table I (Experiment #1). In all experimental cases, the transmit and receive F/#s for reference and tracking pulses were 2.0 and 0.5, respectively. Transmit F/#s for ARFI excitation pulses, or “push F/#s,” are listed in Table I for each experiment. The PRF was kept at 9 kHz for all pulses.
TABLE I.
Experimental Transmit Parameters.
| Experiment # | 1 | 2 | 3 | 4 | 5 |
|---|---|---|---|---|---|
| Transducer | VF7–3 | VF10–5 | VF10–5 | VF10–5 | VF10–5 |
| Frequency (MHz) | 4.21 | 5.71 | 5.71 | 5.71 | 5.71 |
| Axial Focus (cm) | 2.0 | 1.3 | 1.0 | 1.5 | 1.5 |
| ARFI Excitation length (μs) | 71.3 | 52.5 | 52.5 | 52.5 | 52.5 |
| #Lateral locations* | 96 | 80 | 96 | 96 | 96 |
| Lateral FOV (cm) | 1.70 | 1.20 | 1.43 | 1.43 | 1.43 |
| Push F/# | 1.5 | multiple | 1.5 | 1.5 | 1.5 |
Refers to receive-beam (i.e., track) locations. Number of ARFI excitation pulses can be determined by dividing this value by sequence's corresponding TER. All beams (receive and transmit) are evenly spaced throughout the lateral FOV.
In the case of the quantitative CNR analysis, only the non-multiplexed sequences (conventional, parallel, and multi-time parallel) were thoroughly evaluated. Although a preliminary analysis of the multiplexed schemes was performed, the results showed large artifacts dependent on beam spacing. Propagation of shear waves between beam locations generated these effects; this phenomenon is addressed in more detail in the Discussion section. For the non-multiplexed schemes, 2 regions, one encompassing the approximate lesion area and one outside the lesion, of equal area and at the same depth were chosen inside the test phantom. CNR was calculated using
| (6) |
where and are the mean displacements in the aforementioned regions inside and outside of the lesion, respectively, and σi and σo are displacement standard deviations of these inside and outside regions, respectively. For each sequence, acquisitions were performed at 3 different transmit powers and 3 different push F/#s (1.0, 1.5, and 2.0) for a total of 27 different acquisition combinations. The transducer was then rotated approximately 30° about the lesion axis twice, to get 3 independent acquisitions for each combination (for a total of 81 acquisitions). The specific transmit parameters used in this experiment are listed in Table I (Experiment #2).
2) Ex Vivo Specimen
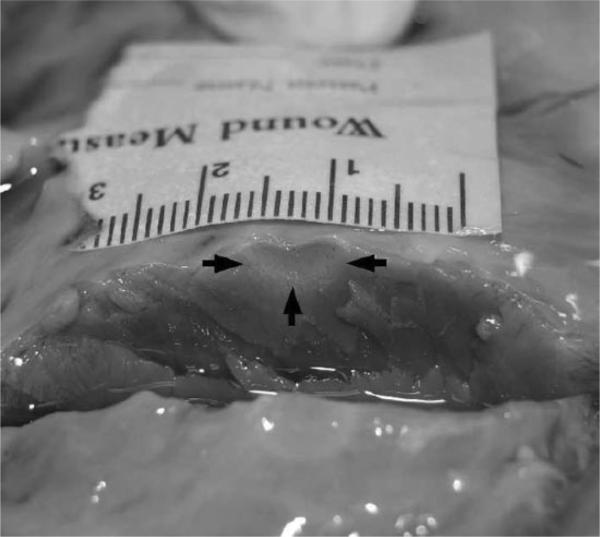
The procedure implemented on the ex vivo specimen was similar to that outlined above for the phantom study. A portion of the left ventricle from bovine cardiac tissue was used in the ex vivo study. A SteeroCath ablation probe (Boston Scientific, Natick, MA) connected to a Cardiac Pathways (Sunnyvale, CA) RF device was then used to ablate a spot in the center of the ventricular septum; a cross section of this lesion is shown in Fig. 4. ARFI imaging transmit parameters used for this experiment are listed in Table I (Experiment #3).
Fig. 4.
Cross section of ablation site in bovine cardiac tissue. The black arrows indicate the approximate distal and lateral boundaries of the ablated region; centimeters are numbered in the presented scale.
B. Thermal Evaluation
Tissue and transducer face heating resulting from ARFI excitations was quantified through empirical and simulation-based methods.
1) Tissue Heating
As direct tissue heating measurements are often difficult to obtain due to poor SNR resulting from inexact placement of the thermocouple, we chose to simulate the resulting thermal distribution in the specimen through finite element method (FEM) modeling. For a more detailed description of this procedure, the reader is referred to Palmeri et al. [18]. Thermal simulations modeled the transmit parameters listed in Table I (Experiment #4). FIELD II, a linear acoustics modeling software package, was first used to model the acoustic intensity field generated at the focus of simulated cardiac tissue from a single excitation [29]. The cardiac tissue was simulated to have an absorption coefficient of 0.52 dB/cm/MHz, a density of 1.06 g/cm3, a specific heat of 3.72 kJ/kg/°C, and a thermal diffusivity of 1.42 × 10⁷ m2/s. The peak of this intensity field was then scaled to the empirically determined value obtained in the phantom-substitution technique outlined by Palmeri et al. [30]. This scaled intensity distribution was used to calculate an initial temperature distribution, as predicted by (5). This initial temperature distribution was then assigned to a 614,792-element mesh (15 mm × 50 mm × 20 mm); quarter-symmetry was assumed to reduce computational overhead. LS-DYNA3D (Livermore Software Technology Corporation, Livermore, CA) was used to solve for the cooling profile through time. If linearity was assumed, it was then possible to use superposition with the solution of a single excitation to construct solutions of multiple excitations (required to generate one complete frame) and multiple acquisitions (resulting from consecutive frame acquisitions).
2) Transducer Surface Heating
At the face of the transducer, the temperature is more evenly distributed over a larger area than at the focus, allowing for repeatable empirical measurements. Face heating measurements were conducted in accordance with the guidelines set forth by the IEc [16], [20]. The tissue-mimicking phantom (in one trial, bovine liver was used instead) was placed in a water bath, which was held at a constant temperature of 33°C; the water level was kept just below the surface of the phantom. The transducer was then fixed in place with a ringstand, so that the face of the transducer was kept flush with the phantom surface and just above the surrounding water level; silicon gel was used to ensure adequate transducer–phantom coupling. A type-T thermocouple was placed at the approximate lateral and elevational center of the transducer–phantom interface. Through a test ARFI sequence, the thermocouple tip position was then adjusted until a peak temperature reading was observed. An MMP ARFI sequence was transmitted with the transmit parameters listed in Table I (Experiment #5). This sequence was repeatedly transmitted at 2 different frame rates (2 and 5 fps) for 3 total acquisition times (2, 4, and 8 s).
IV. Results
A. Tissue-Mimicking Phantom
1) Qualitative Analysis
Images generated from the 6 acquisition schemes are presented in Fig. 5. All 6 figures display the ARFI image resulting from the same time step (0.44 ms after the initiation of the excitation) and are of the same region of the phantom, which contained two 3-mm-diameter, spherical lesions centered at approximately 17 and 23 mm depths. Overall, the 6 images appear quite similar to one another. At the focus, there is very little difference between the multiplexed and non-multiplexed ARFI images in matched pairs [(a) and (b), (c) and (d), and (e) and (f)]. Between these 3 pairs, however, the displacement at the focus decreases slightly as the number of ARFI excitations decreases, with (a) and (b) (80 excitations) having the greatest, and (e) and (f) (20 excitations) having the least, displacement at the focus. In the near field, there is a band of greater displacement, from about 12 to 15 mm in the axial dimension, for the non-multiplexed cases. There does not appear to be any appreciable difference in the far field of any of the images. In the multi-time cases [(e) and (f)], there is vertical banding in the displacement profile at the focus. This banding is also noticeable in the near field of the MMP case (f).
Fig. 5.
Matched ARFI images of a CIRS phantom generated 0.44 ms after the initiation of an ARFI excitation and acquired with 6 different acquisition schemes: (a) conventional, (b) multiplexed, (c) parallel, (d) multiplexed parallel, (e) multi-time parallel, and (f) MMP. The color bar at the far right of the figure depicts the range of axial displacement, from 0 to 14 microns; all 6 images are presented with the same dynamic range.
Table II lists the times taken to acquire each of the images presented in Fig. 5. The scheme letters listed in the table correspond to those listed in the figure. The reduction factor denotes the reduction in acquisition time for each scheme when compared with the conventional scheme. Similar acquisition times were achieved for the ex vivo experiment.
TABLE II.
Image Acquisition Times.
| Acquisition scheme | a | b | c | d | e | f |
|---|---|---|---|---|---|---|
| Time (ms) | 448 | 248 | 112 | 64 | 58 | 36 |
| Reduction factor | 1.0 | 1.8 | 4 | 7.0 | 7.7 | 12.4 |
2) Quantitative Analysis
The CNR of the shallow lesion (centered at approximately 17 mm in Fig. 5) in the tissue-mimicking phantom was calculated through the period of displacement recovery for different acquisition schemes, which utilized different push F/#s and powers. Changes in transmit power did not significantly alter the CNR profiles of any of the acquisition schemes. Differences in push F/#, on the other hand, resulted in significant changes in the CNR profiles and invoked relative changes between the 3 acquisition schemes. Fig. 6 presents plots of the variance of the displacement values in a region outside of the lesion [i.e., from (6)] as a function of time following the initiation of an ARFI excitation; each plot shows results for all 3 acquisition schemes for a specific push F/#. displacement variance outside of the lesion decreases with increasing push F/# for all acquisition schemes; there were no significant trends observed with displacement variance inside of the lesion . At the lowest push F/#, is highest for the conventional scheme; this relationship shifts as push F/# increases, with the multi-time parallel scheme claiming the highest variance, and the other 2 schemes, the lowest. In Fig. 7, 3 plots are shown with 3 CNR profiles, one profile for each acquisition sequence. A few trends can be observed in these plots. First, at the lowest push F/#, both the parallel and multi-time parallel schemes tend to outperform (i.e., achieve a higher CNR value) the conventional scheme. As the push F/# is increased, however, the conventional scheme's performance improves relative to the other 2 schemes, to the point where it outperforms the multi-time parallel scheme for both higher push F/#s and, on average, outperforms the parallel scheme when the push F/# is equal to 2.0. a second important trend to note is that the time needed to reach the peak CNR value depends on the acquisition scheme and push F/#.
Fig. 6.
Plots depicting the displacement variance outside the lesion as a function of the time following the initiation of an ARFI excitation for 3 different push F/#s: (a) 1.0, (b) 1.5, and (c) 2.0. Each figure contains the displacement variance plot for 3 different acquisition schemes (indicated by the legend); each plot displays the average of 3 independent trials with error bars indicating one standard deviation.
Fig. 7.
Plots depicting the CNR in a lesion phantom as a function of the time following the initiation of an ARFI excitation for 3 different push F/#s: (a) 1.0, (b) 1.5, and (c) 2.0.
The CNR-vs.-time behavior of the multiplexed schemes was also analyzed. These plots, however, proved to be highly dependent on the relative distance and timing between ARFI excitation pulses. This phenomenon and its implications are addressed in the Discussion section. Given that the multiplexed scheme becomes its corresponding non-multiplexed scheme (e.g., multiplexed parallel becomes parallel) when the number of track pulses per a lateral location is doubled, CNR analysis was limited to the non-multiplexed cases.
Table III summarizes the peak displacements achieved for 3 acquisition schemes at 3 different push F/#s in regions inside and outside of the phantom lesion. Note that displacements are given in microns [with an average (N = 3) and one standard deviation presented for each] while values in the top row of the table indicate the push F/# employed. Inside the lesion, there is little difference in displacement between acquisition schemes whereas an inverse relationship between displacement and push F/# is observed. These peak displacement values occurred approximately 1.5 ms after the initiation of the ARFI excitation. Outside of the lesion, a similar inverse relationship to push F/# exists, but peak displacement also has an inverse relationship with the TER of the acquisition scheme, with the conventional scheme (1:1 TER) generating the greatest displacement and the multi-time scheme (8:1 TER) generating the least displacement. These peak displacement values occurred within 0.5 ms of the initiation of the ARFI excitation.
TABLE III.
Peak Displacement [μm] Achieved for Different Push F/#s.*
| Inside lesion (a) |
outside lesion (b) |
|||||
|---|---|---|---|---|---|---|
| Acquisition scheme | 1.0 | 1.5 | 2.0 | 1.0 | 1.5 | 2.0 |
| Conventional | 4.5 ± 0.2 | 3.6 ± 0.1 | 2.9 ± 0.1 | 13.8 ± 0.6 | 10.3 ± 0.5 | 8.0 ± 0.4 |
| Parallel | 4.6 ± 0.1 | 3.7 ± 0.1 | 3.0 ± 0.03 | 11.8 ± 0.8 | 9.3 ± 0.5 | 7.4 ± 0.4 |
| Multi-time parallel | 4.6 ± 0.1 | 3.7 ± 0.1 | 3.0 ± 0.04 | 10.4 ± 0.5 | 8.3 ± 0.3 | 6.8 ± 0.3 |
The ± values represent one standard deviation.
Table IV details the time taken following the initiation of an ARFI excitation for the CNR to reach its peak value. For the most part, times tend to show an inverse relationship with push F/# and a direct relationship to the TER of the acquisition sequence, with the conventional scheme (1:1 TER) having the lowest times and the multi-time parallel scheme (8:1 TER) having the highest times.
TABLE IV.
Time (ms) to Peak CNR for Different Push F/#s.*
| Acquisition scheme | 1.0 | 1.5 | 2.0 |
|---|---|---|---|
| Conventional | 0.49 ± 0.04 | 0.49 ± 0.02 | 0.44 ± 0.02 |
| Parallel | 0.57 ± 0.01 | 0.51 ± 0.03 | 0.47 ± 0.01 |
| Multi-time parallel | 0.67 ± 0.02 | 0.63 ± 0.02 | 0.61 ± 0.01 |
The ± values represent one standard deviation.
B. Ex Vivo Specimen
In Fig. 8, a comparison of ARFI images of an ablation site in excised bovine cardiac tissue is presented for different acquisition schemes. All 6 figures display the ARFI image resulting from the same time step (0.44 ms after the initiation of the excitation) and capture the same region in the excised specimen. A cross-sectional picture of the ablation site is presented in Fig. 4. The centered blue area of each image indicates a stiffer region resulting from ablated tissue whereas the flanking red areas of each image indicate more compliant, non-ablated tissue. The proximal surface of the specimen occurs at an approximate depth of 5 mm; the noise in the near field is due to decorrelation resulting from acoustic streaming of the water bath, which was used as a standoff between the transducer and the sample surface. As in the preceding phantom comparison, there is little apparent difference between multiplexed and non-multiplexed pairs (i.e., between (a) and (b), and so forth). Yet, similar to the previous comparison, there is a slight decrease in displacement as the number of ARFI excitations decreases. This is particularly noticeable in the right-hand region of greater compliancy, which shows greater displacement (i.e., going from orange to red) as the number of excitations increases.
Fig. 8.
Matched ARFI images of an ablated region in excised tissue from the left ventricle of a bovine heart. Images were generated 0.44 ms after the initiation of an ARFI excitation with the following acquisition schemes: (a) conventional, (b) multiplexed, (c) parallel, (d) multiplexed parallel, (e) multi-time parallel, and (f) MMP. The color bar at the far right of the figure depicts the range of axial displacement, from 0 to 15 microns; all 6 images are presented with the same dynamic range.
C. Tissue Heating
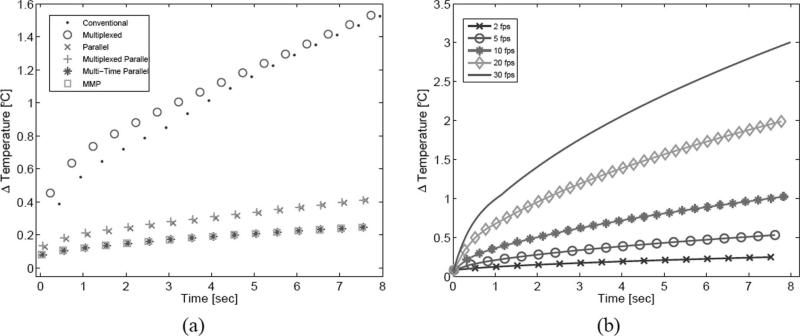
Tissue heating was investigated through FEM modeling. In Fig. 9(a), tissue heating was simulated for all 6 acquisition schemes operating at 2 fps for 8 s. Note that only the peak temperature following each frame acquisition is plotted. Between multiplexed and non-multiplexed pairs, peak temperature values occurred slightly earlier for multiplexed sequences. For the 1:1 and 4:1 TER schemes, the multiplexed sequences resulted in greater tissue heating at the onset of the 8 s acquisition period, with the multiplexed and multiplexed-parallel sequences generating 17.1% and 4.3% more heat, respectively, after the first frame than their paired non-multiplexed sequences. The difference between pairs became insignificant later in the acquisition period, whereas no such difference was ever observed with the 8:1 TER schemes. Additionally, with the lower (1:1 and 4:1) TER schemes, peak tissue heating occurred in the near field during the first portion of the acquisition period and transitioned to the focus later in the period; with the multi-time schemes (8:1 TER), peak heating occurred at the focus throughout the acquisition period. There were sustained differences throughout the acquisition period, however, in peak heating between sequences of varying TER. After the 8 s acquisition period, the peak temperature for the 1:1 TER cases (conventional and multiplexed) was 1.53°C, for the 4:1 cases (parallel and multiplexed parallel) 0.41°C, and for the 8:1 cases (multi-time parallel and MMP) 0.25°C.
Fig. 9.
Simulated peak tissue heating plots. The plot on the left (a) depicts the simulated peak tissue heating resulting from all 6 acquisition schemes, each transmitted at 2 fps for 8 s. The plot on the right (b) depicts the simulated peak tissue heating resulting from the MMP acquisition scheme for 5 different frame rates through an 8 s acquisition period.
In Fig. 9(b), tissue focus heating was simulated for the MMP acquisition scheme for 5 different frame rates. The plotted symbols denote the peak temperature at the focus following each frame acquisition. The peak temperature increases following an 8 s acquisition period were 0.25, 0.54, 1.03, 2.02, and 3.01°C for 2, 5, 10, 20, and 30 fps, respectively.
D. Transducer Surface Heating
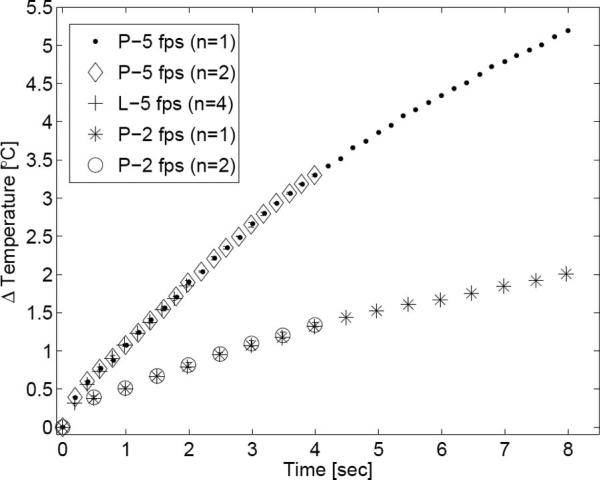
Fig. 10 depicts the transducer face heating resulting from the MMP acquisition sequence. Following an 8 s acquisition period, face heating temperature increases measured 2.0°C and 5.2°C for 2 fps and 5 fps, respectively. The standard deviation of the measurements was small. Additionally, there is excellent agreement among all data sets of the same frame rate, independent of sequence acquisition period (2, 4, or 8 s) or transmission medium (tissue-mimicking phantom or liver). The 2-fps sequence approached a steady state response following the 8 s acquisition period, whereas the 5-fps sequence increased without a definite bound.
Fig. 10.
Transducer surface heating plot. The maximum transducer face temperature increase following each frame acquisition is plotted for the MMP acquisition scheme. The key indicates the test medium (P = phantom; L = bovine liver), frame rate, and number of samples averaged for that trial. When possible, error bars indicating one standard deviation are also shown.
V. Discussion
A. Image Quality Evaluation
Parallel-receive, multiplexed, and multi-time acquisition techniques are able to reduce frame acquisition time and heating with only negligible effects on image quality. Our results for parallel-receive acquisition corroborate earlier findings by Dahl et al. [9]. Yet, despite comparable imaging performance between these acquisition schemes, subtle differences between matched phantom images (Fig. 5) can be seen. Perhaps most obvious is the slight decrease in displacement at the focus as the TER increases with different sequences. This relationship is also reflected in Table III(b). In the conventional and multiplexed schemes (with 1:1 TERs), displacement at the focus is slightly greater when compared with the parallel (4:1 TERs) and multi-time (8:1 TERs) schemes. This is particularly noticeable at the innermost, lateral border of the proximal lesion in Fig. 5 and the right-hand region of greater compliancy in Fig. 8. Also apparent is the vertical banding that is present in the displacement of the parallel and multi-time schemes [Fig. 5(c)–(f)]. This decrease in displacement and banding is due to these schemes’ reliance on shear wave propagation to generate displacement at the flanking track locations. After the ARFI excitation, the region of initial excitation continues to displace as a result of inertia whereas lateral locations displace as a result of shear wave propagation. Shear wave attenuation and geometric spreading will result in less displacement at flanking beam locations whereas a track beam's distance from the excitation region will help dictate when peak displacement occurs at that location (as evidenced by Fig. 1). When a “snapshot” of this dynamic process is taken, the spatial and temporal dependence of peak displacement will manifest itself as banding. As noted by Dahl et al. [9], this banding is particularly noticeable earlier in time, when shear waves have not propagated sufficiently. Our displacement data from earlier time steps corroborate this result.
A decrease in displacement with increasing TER, however, is not seen in the lesion. In Table III(a), peak displacement depends on push F/# but does not depend on the acquisition scheme used. As predicted by continuum mechanics, displacement induced in the more compliant background material shallow and deep to the lesion results in bulk displacement of the much stiffer inclusion, which likely accounts for the lesion displacement observed early in time (<0.5 ms) and is not necessarily indicative of the lesion's stiffness. The fact that the displacement peak inside the lesion occurs much later than the displacement peak outside of the lesion (>1.5 ms compared with <0.5 ms) indicates that this displacement peak, resulting from the continued movement of the lesion, is dominated by inertial effects and by shear wave interaction. According to Palmeri et al., the peak displacement that one tracks within a lesion is produced by shear wave reflections generated at the lesion's boundaries [8]. Since the peak displacement within the lesion results from inertially dictated bulk motion and reflected shear waves, the positions of the tracked beams relative to the excitation region, assuming both are within the lesion, is not particularly important, as the entire lesion will experience a similar peak displacement. The decrease in displacement with increasing push F/# observed in all cases is due to the decrease in elements (and thus transmit power) utilized in a transmit aperture with increasing F/#.
Also present in the phantom images is a band of greater displacement just shallow to the proximal lesion in non-multiplexed cases. This subtle disparity between multiplexed and non-multiplexed acquisition schemes reflects an important issue regarding shear wave propagation. The role that shear waves play and the artifacts they cause became apparent during the preliminary investigation of multiplexed acquisition for the CNR analysis. Eq. (2) predicts a shear wave velocity through the phantom's background of 1.2 m/s. Given the relative proximity of successive ARFI excitations, which are often just over half a centimeter apart, it takes a few milliseconds for the leading edge of a displaced volume (defined by the excitation region) to reach an adjacent push location through shear wave propagation. Thus, careful attention must be paid to the temporal and spatial layout of successive pushing pulses. If the spacing is coincident with shear wave speed, a shear wave from an adjacent push can affect the dynamic response at another location. Additionally, if a passing shear wave induces displacement while a reference pulse is acquired, an artifactual negative displacement will result at that location once the specimen recovers. Previous simulation results indicate that the position of a lesion's boundaries in an ARFI image can be affected by shear wave dynamics [30]. Despite the differences in shear wave dynamics between the acquisition schemes, there were no apparent differences in the lesion outlines among any of the schemes for the time step presented in Fig. 5.
Although it is impossible to definitively identify the presence of a shear wave-induced artifact in a poorly characterized (e.g., in vivo as opposed to phantom) imaging environment, care can be taken to avoid such an artifact when a multiplexed sequence is used. If an approximate shear wave velocity and/or attenuation are known a priori for a given tissue environment, the timing and spacing of successive pushing pulses can be chosen accordingly in an attempt to mitigate, or avoid entirely, interference. Additionally, one could employ an adaptive method, in which a pilot shear wave imaging sequence is first acquired for the purpose of better estimating the tissue's shear wave parameters (velocity and attenuation). Based on these estimates, pushing pulse timing and spacing could then be adaptively adjusted.
The CNR analysis yields 2 important results. First, as indicated in Table IV, the time necessary to reach a peak CNR increases as the TER of the sequence increases. This result agrees with a similar result by Dahl et al. and is due in large part to the additional time required for shear waves to propagate to the outermost track locations of these sequences [9]. There is an inverse relationship between the time to peak CNR and the push F/#, likely a result of the broader excitation region generated with a larger F/#. This broader region consequently takes less time to propagate as a shear wave to the outer track locations. This additional delay for parallel and multi-time schemes would increase acquisition time.
A second result from the CNR analysis is that the performance of each acquisition sequence depends on the push F/#. As the push F/# increases, performance gradually improves for acquisition sequences with lower TERs, with the conventional scheme on average overtaking both the parallel and multi-time parallel schemes when the push F/# is 2.0. According to (6), CNR values depend on both the magnitude and the variance of the displacement inside and outside of a lesion. As indicated in Table IV, a lower TER results in greater displacement, independent of the push F/#. Thus, one would expect peak CNR to increase with decreasing TER, also independent of F/#. Yet, the relative CNR performance of each sequence appears to depend on push F/#. Insight into this relationship can be gleaned by analysis of the variance of this displacement. Fig. 6 presents the variance of displacements outside of the lesion . When push F/# is lowest, the conventional scheme has the highest variance among the 3 schemes; this relationship shifts as push F/# increases. An explanation for this phenomenon rests in the fact that tracking noise, or “jitter,” increases as push F/# decreases, due to the increase in lateral shearing within tracking beams [31]. Parallel and multi-time acquisition, with tracking beams outside of the excitation region, are less affected by this shearing-induced jitter. Conventional acquisition, on the other hand, is very sensitive to this trade-off, as evidenced by the substantial increase in and subsequent relative decrease in CNR when the push F/# is 1.0.
There is room for continued improvement in the ARFI acquisition sequences examined in this study. Advances in scanner hardware will allow for the reception of more than 4 beams simultaneously. In the case of multiplexed acquisition, iterations of this basic technique are also possible. For instance, instead of tracking the response of a location until the peak displacement is achieved, it is also possible to transmit 2 consecutive ARFI excitations, each half the distance of the lateral FOV apart, and then multiplex the tracking between these 2 locations (e.g., in the case of 8 lateral locations, the beam transmit order would be: R[1], P[1], R[5], P[5], T[1], T[5], T[1], T[5], and so forth). This configuration would sample the dynamic response during the relaxation phase (and not just during the period up until peak displacement), but at the expense of decreasing the effective sampling of the earlier portion of the response by a factor of 2, which could render peak displacement estimation difficult. Additionally, it is also feasible to multiplex among more than 2 zones in the FOV (e.g., split the FOV into 3 equal regions and multiplex among them). Such an approach was recently implemented by Hsu et al. with encouraging success [14]. In regard to multi-time acquisition, it might be possible to first track the innermost beams of an 8-beam cluster and then track the outermost beams, as opposed to tracking the left-most and then right-most beam clusters (e.g., T[3:6], T[1,2,7,8] instead of T[1:4], T[5:8]). Since the multi-time technique relies on shear wave propagation to achieve displacement at the outermost beam locations, sampling these locations later in time might be more effective.
B. Frame Rate and Thermal Evaluation
Table II shows that the MMP sequence reduced frame acquisition time by a factor of 12.4, to 36 ms, when compared with the conventional scheme, allowing a frame rate of over 27 fps. If fewer lateral locations were tracked (e.g., narrower FOV) or the recovery time of the material were lower, an even higher frame rate would be possible. It is important to note that although the MMP sequence is predicted to deliver up to a 4N-fold (16-fold, for our 4:1 parallel-receive configuration) reduction in frame acquisition time, this is an upper limit and is fully realized only when the number of track pulses is much greater than the number of reference and push pulses, which was not true in our case.
Despite theoretical frame rates that would allow for real-time imaging, transducer face heating likely limits these rates from currently being realized. Face heating was not measured for all 6 acquisition schemes (in an effort to minimize the risk of damaging the transducer), but the results from the MMP sequence, which one would assume to be the most thermally optimized with its high TER, indicate that it is likely the dominant thermal concern, whereas tissue heating is of secondary importance, assuming reasonable frame rates and pulse intensities are employed. Temperature increases at the transducer face are primarily due to absorption of acoustic energy by the lens and inefficiencies in the piezoelectric elements and backing material [32]. Seeing that transducer face heating appears to be the most problematic thermal issue, it will likely be necessary to continue optimization of transducers for ARFI imaging to further mitigate heating concerns. Although continued reduction in the number or intensity of ARFI excitations in addition to the use of a modest frame rate would allow for the acquisition of repeated ARFI frames, further optimization of a transducer for ARFI imaging might be the most effective option.
With comparable frame rates and FOVs, sequences having the same TER (and thus equal transmit power per frame) converged to the same peak tissue heating value, which occurred at the focus, if enough time was allowed for adequate thermal diffusion [as evidenced by Fig. 9(a)]. Early in the acquisition period, however, near-field heating tended to dominate if there was sufficient beam overlap, which was the case with the lower (1:1 and 4:1) TER schemes. When near-field heating dominates, heating at a specific point in the near field is significantly influenced by multiple, laterally adjacent ARFI excitations [11]. As the time between consecutive ARFI pulses decreases (i.e., as frame acquisition time decreases, as is the case with the multiplexed schemes), near-field tissue, which is heated by multiple, spatially overlapping, yet temporally offset, ARFI excitations, is given less time to cool between these successive excitations. Thus, this cumulative effect causes the overall peak temperature increase to be higher for these sequences (multiplexed and multiplexed parallel) when compared with their non-multiplexed pairs (conventional and parallel, respectively) early in the acquisition period.
As noted by Fahey et al. in their FEM thermal modeling of ARFI imaging, the effect of global perfusion must be taken into account when attempting to model heating trends over extended periods of time; perfusion effects were not incorporated into the thermal model presented in this paper [11]. Physiologic motion was also not taken into account. Neglecting these 2 effects, perfusion and physiologic motion, tends to support the notion that the simulated tissue heating results presented herein are likely an overestimation of the actual heating that would be encountered in vivo.
To further decrease tissue heating, it might be possible to alternate ARFI excitation locations in the MMP acquisition scheme. For even frames, one could center pushing pulses between the previously defined 4-beam clusters (e.g., beams T[1:4], T[5:8], and so forth); for odd frames, one could shift these pushing pulses by 2 beam locations (e.g., now centering them between beams T[3:6], T[7:10], and so forth). Although 2 tracking locations would be lost from both ends of the FOV, alternating the location of the ARFI excitation would serve to further spread out the distribution of transmitted energy, which should reduce peak tissue heating.
VI. Conclusions
Incorporating novel beam sequencing (multiplexed and multi-time techniques) and parallel-receive beamforming into ARFI imaging can effectively reduce frame acquisition time by more than 12-fold, with little reduction in image quality. Additionally, these techniques also tend to mitigate issues with internal tissue heating, as evidenced by the 84% reduction in peak tissue heating observed with the MMP scheme compared with that observed with the conventional scheme. In light of these heating reductions, it appears that the primary thermal concern lies with transducer face heating, which can exceed a 5°C increase at modest frame rates (5 fps) in 8 s with the thermally optimized MMP acquisition sequence. Yet, despite this challenge, the order-of-magnitude reductions in frame acquisition time and tissue heating achieved with these acquisition schemes promise to bolster ARFI imaging's potential as a real-time imaging technique. Continued work on ARFI acquisition sequencing in conjunction with technological advances in on-board processing and transducer thermal management should help facilitate ARFI imaging into becoming a viable, real-time option for elasticity imaging of dynamic biological systems.
Acknowledgments
We thank the Ultrasound Division of Siemens Medical Solutions Usa, Inc. for in-kind support and Joshua Baker-LePain for technical assistance.
This work was supported by NIH 1R01HL075485, NIH 1R01CA114075, and NIH 1R01EB002132 grants, and by the NSF-GRFP.
Biography
 Richard R. Bouchard was born in Winnipeg, Manitoba, Canada, in 1981. He received the B.S.E. degree in biomedical and electrical engineering in 2004 from Duke University, Durham, NC. He is currently a National Science Foundation and James B. Duke graduate fellow pursuing the Ph.D. degree in biomedical engineering at Duke University.
 Jeremy J. Dahl was born in Ontonagon, Michigan, in 1976. He received the B.S. degree in electrical engineering from the University of Cincinnati, Cincinnati, OH, in 1999. He received the Ph.D. degree in biomedical engineering from Duke University in 2004. He is an assistant research professor in the Department of Biomedical Engineering at Duke University. He is currently researching adaptive ultrasonic imaging systems and radiation force imaging methods.
 Mark L. Palmeri received his B.S. degree in biomedical and electrical engineering from Duke University, Durham, NC, in 2000. He was a James B. Duke graduate fellow and received his Ph.D. degree in biomedical engineering from Duke University in 2005 and his M.D. degree from the Duke University School of Medicine in 2007. He is currently an assistant research professor in the Department of Biomedical Engineering at Duke University. His research interests include ultrasonic imaging, characterizing the mechanical properties of soft tissues, and finite element analysis of soft tissue response to acoustic radiation force excitation.
 Stephen J. Hsu was born in Huntsville, AL, in 1980. He received his B.S.E. degree in biomedical and electrical engineering from Duke University, DURHAM, NC, in 2001. He currently is a Ph.D. graduate student in the Duke University Biomedical Engineering Department. His research interests include acoustic radiation force impulse imaging and cardiac ultrasound imaging.
 Gregg E. Trahey (s’83–M’85) received the B.G.S. and M.S. degrees from the University of Michigan, Ann Arbor, MI, in 1975 and 1979, respectively. He received the Ph.D. degree in biomedical engineering in 1985 from Duke University, Durham, NC. He served in the Peace corps from 1975 to 1978, and was a project engineer at the Emergency Care Research Institute in Plymouth Meeting, PA, from 1980 to 1982. He is a professor with the Department of Biomedical Engineering, Duke University. He is conducting research in adaptive phase correction, radiation force imaging methods, and 2-D flow imaging in medical ultrasound.
Contributor Information
Richard R. Bouchard, Department of Biomedical Engineering, Duke University, Durham, NC (rrb@duke.edu).
Jeremy J. Dahl, Department of Biomedical Engineering, Duke University, Durham, NC
stephen J. Hsu, Department of Biomedical Engineering, Duke University, Durham, NC
Mark L. Palmeri, Department of Biomedical Engineering, Duke University, Durham, NC
Gregg E. Trahey, Department of Biomedical Engineering, Duke University, Durham, NC; Department of Radiology, Duke University Medical Center, Durham, NC..
References
- 1.Bercoff J, Chaffai S, Tanter M, Fink M. Ultrafast imaging of beamformed shear waves induced by the acoustic radiation force in soft tissues: Application to transient elastography. Proc. IEEE Ultrason. Symp. 2002:1899–1902. [Google Scholar]
- 2.Fatemi M, Greenleaf JF. Vibro-acoustography: An imaging modality based on ultrasound stimulated acoustic emission. Proc. Natl. Acad. Sci. USA. 1999;96(12):6603–6608. doi: 10.1073/pnas.96.12.6603. [DOI] [PMC free article] [PubMed] [Google Scholar]
- 3.Konofagou EE, Ottensmeyer M, Agabian S, Dawson S, Hynynen K. Estimating localized oscillatory tissue motion for assessment of the underlying mechanical modulus. Ultrasonics. 2004;42:951–956. doi: 10.1016/j.ultras.2003.12.001. [DOI] [PubMed] [Google Scholar]
- 4.Melodelima D, Bamber J, Duck F, Shipley J, Xu L. Elastography for breast cancer diagnosis using radiation force: System development and performance evaluation. Ultrasound Med. Biol. 2006;32:387–396. doi: 10.1016/j.ultrasmedbio.2005.12.003. [DOI] [PubMed] [Google Scholar]
- 5.Nightingale KR, Bentley R, Trahey GE. Observations of tissue response to acoustic radiation force: Opportunities for imaging. Ultrason. Imag. 2002;24:100–108. doi: 10.1177/016173460202400301. [DOI] [PubMed] [Google Scholar]
- 6.Sarvazyan A, Rudenko O, Swanson S, Fowlkes J, Emelianov S. Shear wave elasticity imaging: A new ultrasonic technology of medical diagnostics. Ultrasound Med. Biol. 1998;24(9):1419–1435. doi: 10.1016/s0301-5629(98)00110-0. [DOI] [PubMed] [Google Scholar]
- 7.Viola F, Walker WF. Radiation force imaging of viscoelastic properties with reduced artifacts. IEEE Trans. Ultrason. Ferroelectr. Freq. Control. 2003;50:736–742. doi: 10.1109/tuffc.2003.1209564. [DOI] [PubMed] [Google Scholar]
- 8.Palmeri ML, McAleavey SA, Fong KL, Trahey GE, Nightingale KR. Dynamic mechanical response of elastic spherical inclusions to impulsive acoustic radiation force excitation. IEEE Trans. Ultrason. Ferroelectr. Freq. Control. 2006;53(11):2065–2079. doi: 10.1109/tuffc.2006.146. [DOI] [PMC free article] [PubMed] [Google Scholar]
- 9.Dahl JJ, Pinton GF, Palmeri ML, Agrawal V, Nightingale KR, Trahey GE. A parallel tracking method for acoustic radiation force impulse imaging. IEEE Trans. Ultrason. Ferroelectr. Freq. Control. 2007;54(2):301–312. doi: 10.1109/tuffc.2007.244. [DOI] [PMC free article] [PubMed] [Google Scholar]
- 10.Pinton GF, Dahl JJ, Trahey GE. Rapid tracking of small displacements with ultrasound. IEEE Trans. Ultrason. Ferroelectr. Freq. Control. 2006;53(6):1103–1117. doi: 10.1109/tuffc.2006.1642509. [DOI] [PubMed] [Google Scholar]
- 11.Fahey BJ, Palmeri ML, Trahey GE. Frame rate considerations for real-time abdominal acoustic radiation force impulse imaging. Ultrason. Imag. 2006;30:193–210. doi: 10.1177/016173460602800401. [DOI] [PMC free article] [PubMed] [Google Scholar]
- 12.Cheung MMH, Smallhorn JF, McCrindle BW, Van Arsdell GS, Redington AN. Noninvasive assessment of ventricular force-frequency relations in the univentricular circulation by tissue Doppler echocardiography: A novel method of assessing myocardial performance in congenital heart disease. Heart. 2005;91:1338–1342. doi: 10.1136/hrt.2004.048207. [DOI] [PMC free article] [PubMed] [Google Scholar]
- 13.Price DJA, Wallbridge DR, Stewart MJ. Tissue Doppler imaging: Current and potential clinical applications. Heart. 2000;84:ii11–ii18. doi: 10.1136/heart.84.suppl_2.ii11. [DOI] [PMC free article] [PubMed] [Google Scholar]
- 14.Hsu SJ, Bouchard RR, Dumont DM, Wolf PD, Trahey GE. In vivo assessment of myocardial stiffness with acoustic radiation force impulse imaging. Ultrasound Med. Biol. 2007;33(11):1706–1719. doi: 10.1016/j.ultrasmedbio.2007.05.009. [DOI] [PMC free article] [PubMed] [Google Scholar]
- 15.Herman BA, Harris GR. Models and regulatory considerations for transient temperature rise during diagnostic ultrasound pulses. Ultrasound Med. Biol. 2002;28(9):1217–1224. doi: 10.1016/s0301-5629(02)00558-6. [DOI] [PubMed] [Google Scholar]
- 16.Palmeri ML, Frinkley KD, Nightingale KR. Experimental studies of the thermal effects associated with radiation force imaging of soft tissue. Ultrason. Imag. 2004;26:29–40. doi: 10.1177/016173460402600203. [DOI] [PubMed] [Google Scholar]
- 17.Dahl JJ, Dumont DM, Allen JD, Miller EM, Trahey GE. Acoustic radiation force impulse imaging for noninvasive characterization of carotid artery atherosclerotic plaques: A feasibility study. Ultrasound Med. Biol. doi: 10.1016/j.ultrasmedbio.2008.11.001. to be published. [DOI] [PMC free article] [PubMed] [Google Scholar]
- 18.Palmeri ML, Nightingale KR. On the thermal effects associated with radiation force imaging of soft tissue. IEEE Trans. Ultrason. Ferroelectr. Freq. control. 2004 May;51(5):551–565. [PubMed] [Google Scholar]
- 19.Wu J, Chase JD, Zhu Z, Holzapfel TP. Temperature rise in tissue-mimicking material generated by unfocused and focused ultrasound transducers. Ultrasound Med. Biol. 1992;18(5):495–512. doi: 10.1016/0301-5629(92)90089-s. [DOI] [PubMed] [Google Scholar]
- 20.I.E.C. Safety Standard . International Electrotechnical Commission. Tech. Rep.; Geneva, switzerland: 2001. Particular requirements for the safety of ultrasonic medical diagnostic and monitoring equipment; pp. 60601–2-37. [Google Scholar]
- 21.Lyons ME, Parker KJ. Absorption and attenuation in soft tissue II—Experimental results. IEEE Trans. Ultrason. Ferroelectr. Freq. Control. 1988;35(4):511–521. doi: 10.1109/58.4189. [DOI] [PubMed] [Google Scholar]
- 22.Nyborg WLM. Acoustic streaming. In: Mason WP, editor. Physical Acoustics. IIB. Academic Press Inc; New York: 1965. pp. 265–331. chap. 11. [Google Scholar]
- 23.Torr G. The acoustic radiation force. Am. J. Phys. 1984;52:402–408. [Google Scholar]
- 24.Bishop J, Poole G, Plewes D. Magnetic resonance imaging of shear wave propagation in excised tissue. J. Magn. Reson. Imaging. 1998;8(6):1257–1265. doi: 10.1002/jmri.1880080613. [DOI] [PubMed] [Google Scholar]
- 25.Shattuck DP, Smith SW, von Ramm OT. Explososcan: A parallel processing technique for high speed ultrasound imaging with linear phased arrays. J. Acoust. Soc. Am. 1984;75(4):1273–1282. doi: 10.1121/1.390734. [DOI] [PubMed] [Google Scholar]
- 26.Fahey BJ, Palmeri ML, Trahey GE. The impact of physiological motion on tissue tracking during radiation force imaging. Ultrasound Med. Biol. 2007;33(7):1149–1166. doi: 10.1016/j.ultrasmedbio.2007.01.007. [DOI] [PMC free article] [PubMed] [Google Scholar]
- 27.Nyborg WLM. Solutions of the bio-heat transfer equation. Phys. Med. Biol. 1988;33:785–792. doi: 10.1088/0031-9155/33/7/002. [DOI] [PubMed] [Google Scholar]
- 28.Thomenius K. Thermal dosimetry model for diagnostic ultra-sound. Proc. IEEE Ultrason. Symp. 1990:1399–1408. [Google Scholar]
- 29.Jensen JA, Svendsen NB. Calculation of pressure fields from arbitrarily shaped, apodized, and excited ultrasound transducers. IEEE Trans. Ultrason. Ferroelectr. Freq. Control. 1992;39(2):262–267. doi: 10.1109/58.139123. [DOI] [PubMed] [Google Scholar]
- 30.Palmeri ML, Sharma AC, Bouchard RR, Nightingale RW, Nightingale KR. A finite element method model of soft tissue response to impulsive acoustic radiation force. IEEE Trans. Ultrason. Ferroelectr. Freq. Control. 2005 Oct;52(10):1699–1712. doi: 10.1109/tuffc.2005.1561624. [DOI] [PMC free article] [PubMed] [Google Scholar]
- 31.Palmeri ML, McAleavey SA, Trahey GE, Nightingale KR. Ultrasonic tracking of acoustic radiation force-induced displacements in homogeneous media. IEEE Trans. Ultrason. Ferroelectr. Freq. Control. 2006;53:1300–1313. doi: 10.1109/tuffc.2006.1665078. [DOI] [PMC free article] [PubMed] [Google Scholar]
- 32.Zipparo M. Mid- to high-power ultrasound imaging arrays—From ARFI to HIFU. Proc. IEEE Ultrason. Symp. 2003:684–688. [Google Scholar]


